. 2022 Jul 15;23(14):7830.
doi: 10.3390/ijms23147830.

Laparoscopic Sleeve Gastrectomy in Patients with Severe Obesity Restores Adaptive Responses Leading to Nonalcoholic Steatohepatitis

Affiliations

Laparoscopic Sleeve Gastrectomy in Patients with Severe Obesity Restores Adaptive Responses Leading to Nonalcoholic Steatohepatitis

Noemí Cabré et al. Int J Mol Sci. .

Abstract

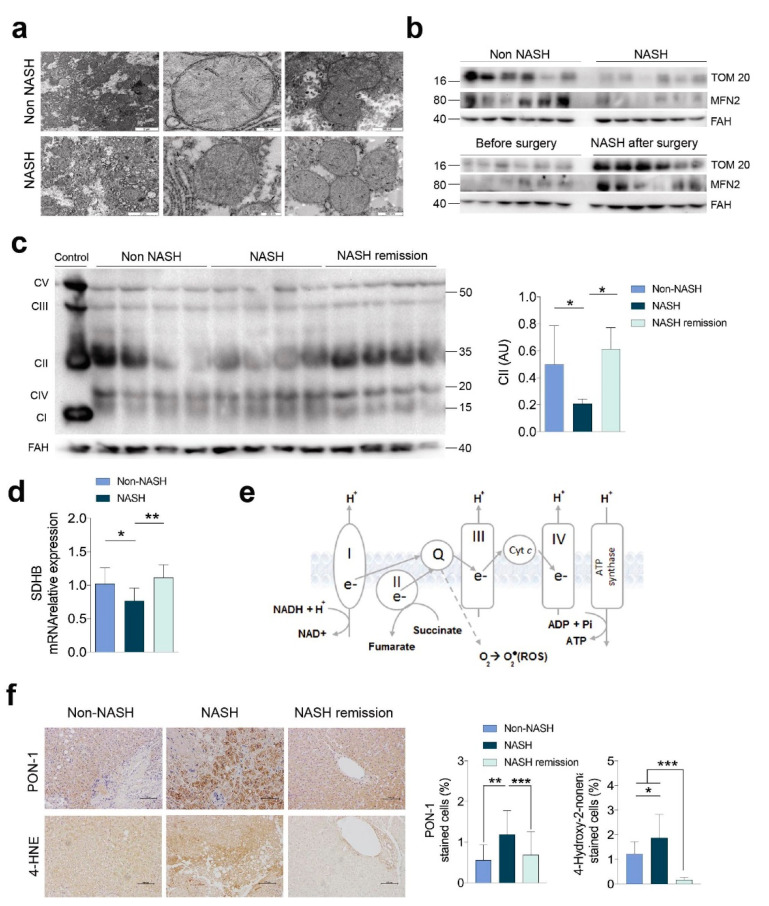
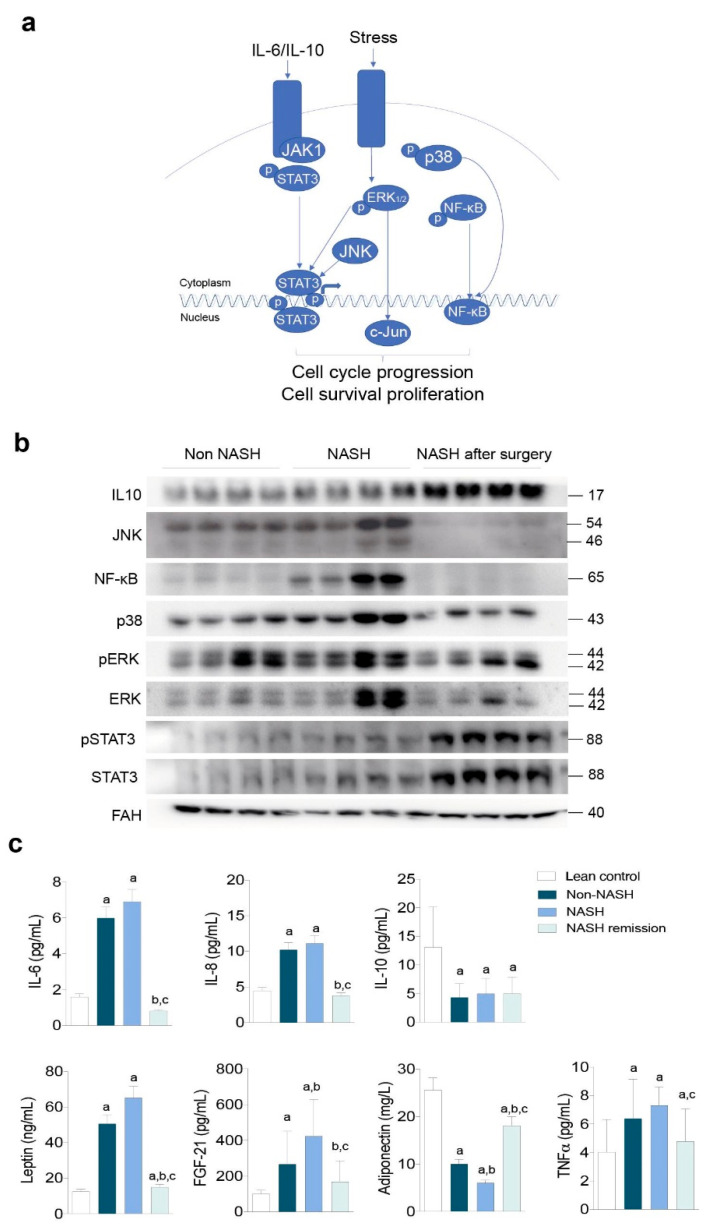
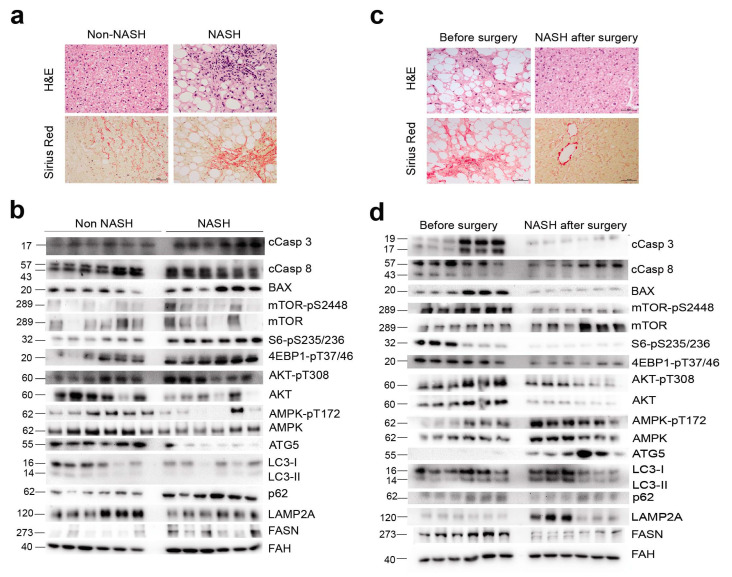
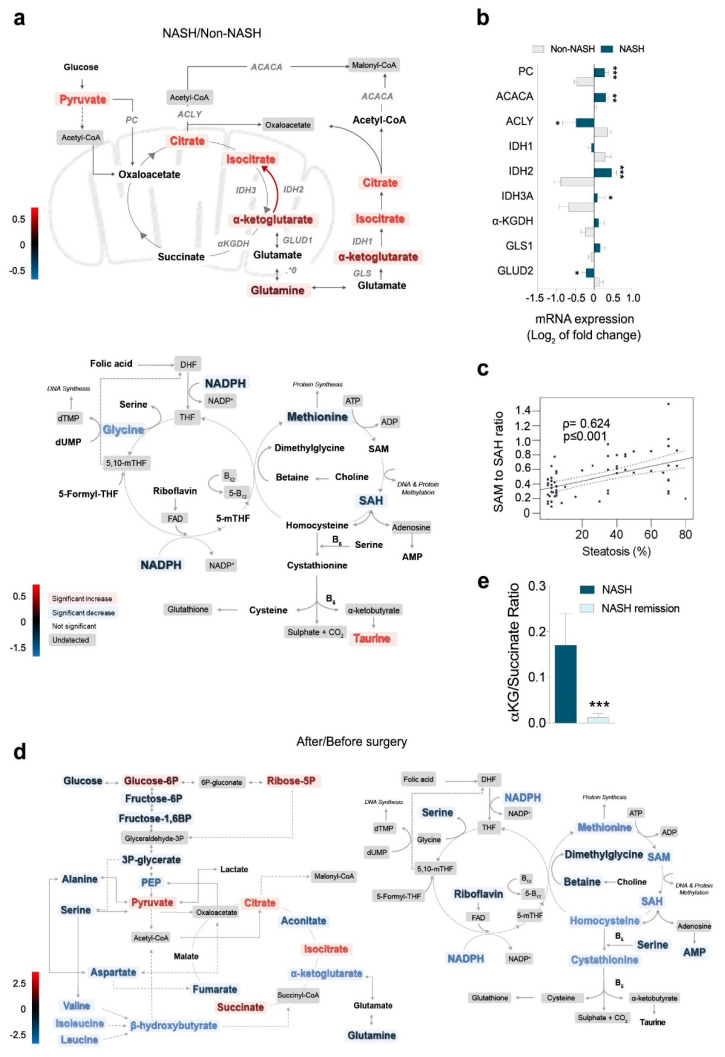
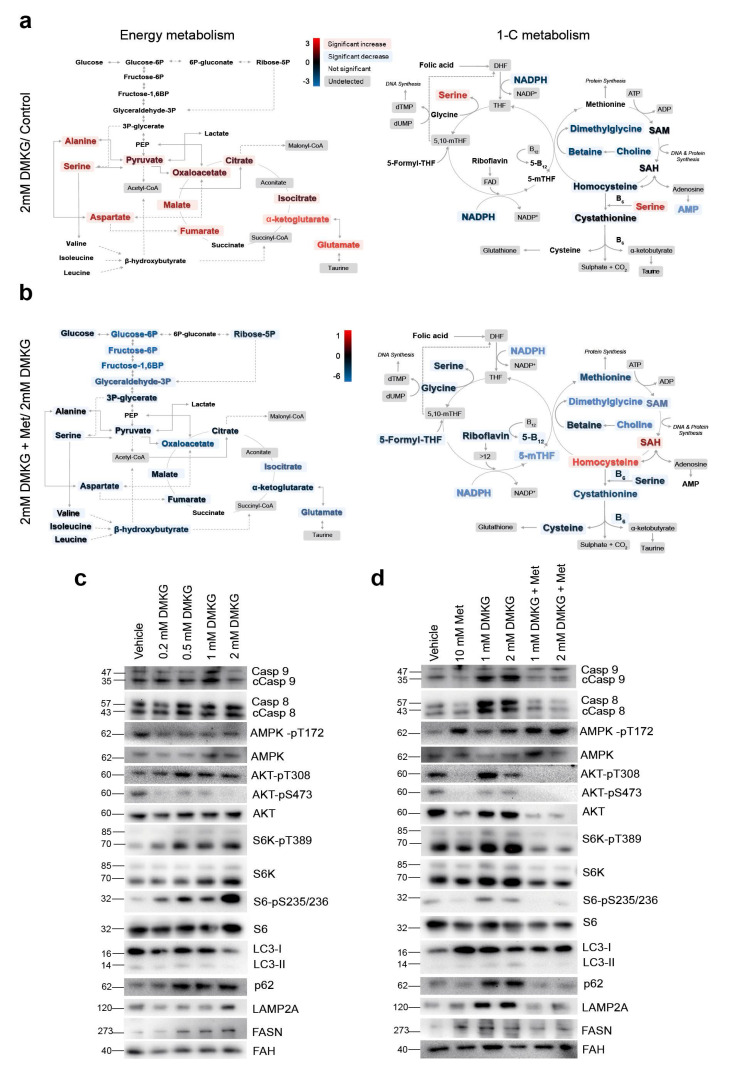
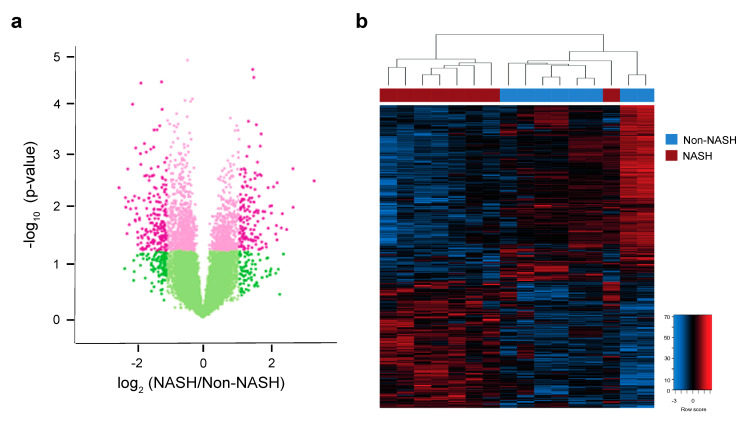
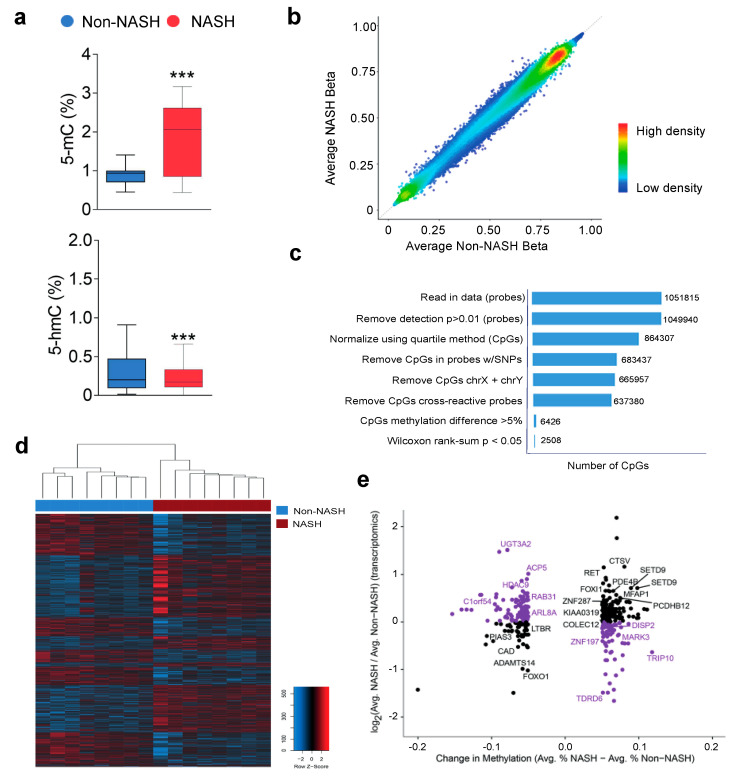
The surgically induced remission of liver disease represents a model to investigate the signalling processes that trigger the development of nonalcoholic steatohepatitis with the aim of identifying novel therapeutic targets. We recruited patients with severe obesity with or without nonalcoholic steatohepatitis and obtained liver and plasma samples before and after laparoscopic sleeve gastrectomy for immunoblotting, immunocytochemical, metabolomic, transcriptomic and epigenetic analyses. Functional studies were performed in HepG2 cells and primary hepatocytes. Surgery was associated with a decrease in the inflammatory response and revealed the role of mitogen-activated protein kinases. Nonalcoholic steatohepatitis was associated with an increased glutaminolysis-induced production of α-ketoglutarate and the hyperactivation of mammalian target of rapamycin complex 1. These changes were crucial for adenosine monophosphate-activated protein kinase/mammalian target of rapamycin-driven pathways that modulated hepatocyte survival by coordinating apoptosis and autophagy and affected methylation-related epigenomic remodelling enzymes. Hepatic transcriptome signatures and differentially methylated genomic regions distinguished patients with and without steatohepatitis. Our results suggest that the increased glutaminolysis-induced α-ketoglutarate production and the mammalian target of rapamycin complex 1 dysregulation play a crucial role in the inefficient adaptive responses leading to steatohepatitis in obesity.

Keywords: DNA methylation; bariatric surgery; energy metabolism; epigenetics; functional studies; glutaminolysis; multi-omics approach.


Conflict of interest statement

The authors declare no conflict of interest.

Figures

Figure 1
Figure 1
Impairment of oxidative phosphorylation and oxidative stress were reversible in the livers of patients with NASH: (a) transmission electron microscopy of hepatocyte mitochondria; (b) representative Western blots of Tom20 and Mfn2 (n = 12, each group); (c) representative Western blots of the OXPHOS complexes; (d) mRNA expression of succinate dehydrogenase B recapitulated the changes in complex II (n = 12, each group); (e) a schematic figure representing the importance of complex II in oxidative phosphorylation; (f) alterations in 4-hydroxy-2-nonenal and paraoxonase-1 (PON-1) (n = 31, each group). * p < 0.05, ** p < 0.01, and *** p < 0.001 by Mann–Whitney U test. In panel (c), the term “control” refers to a positive technical control. In the rest of the experiments, the results of patients with NASH were compared with those of patients without NASH and those after surgery with those before. In panel b, the non-NASH/NASH and before/after surgery blot pairs are shown separately, because they were run on different gels. The results are shown as the means and SD. The numbers to the left of the blots in panel b and to the right in panel c are the molecular weights. FAH: Fumarylacetoacetate hydrolase.
Figure 2
Figure 2
Adaptive responses to hepatocellular damage and oxidative and inflammatory stresses determined the severity of liver disease: (a) schematic representation of the regulatory role of MAPKs; (b) representative Western blots indicating that NASH remission reversed the molecular signals associated with mitochondrial stress but increased IL-10 expression and STAT-3 activation (n = 16, each group); (c) circulating cytokine concentrations in patients and lean controls. a At least p < 0.05 with respect to the controls. b,c At least p < 0.05 compared to the livers of patients without and with NASH, respectively, by the Mann–Whitney U test. In panel 1c, the term “lean control” refers to a lean individual. The results are shown as the means and SD. The numbers to the right of the blots are the molecular weights. FAH: Fumarylacetoacetate hydrolase.
Figure 3
Figure 3
Hepatic AMPK/mTOR-driven pathways coordinated apoptosis and autophagy in liver disease: (a) histology differentiated the livers of patients with and without NASH and (b) confirmed the cellular improvement after NASH remission; (c) representative Western blots comparing selected markers in the livers of patients with and without NASH (n = 18, each) indicated increased apoptosis and compromised autophagy in NASH, accompanied by decreased AMP phosphorylation and increased mTOR phosphorylation; (d) the same markers examined in patients with NASH before and after surgery (n = 18, each) indicated that NASH remission reversed apoptosis and reactivated autophagy. In panels b and d, the non-NASH/NASH and before/after surgery blot pairs are shown separately, because they were run on different gels. The numbers to the left of the blots are the molecular weights. FAH: Fumarylacetoacetate hydrolase.
Figure 4
Figure 4
The liver metabolome revealed the key role of glutaminolysis activation in NASH: (a) the accumulation of glutamine, α-KG, citrate, and pyruvate in the livers of patients with NASH was the most prominent metabolomic finding; (b) significant mRNA overexpression of glutamate dehydrogenase, glutaminase, and isocitrate dehydrogenases and underexpression of α-KG-dehydrogenase and pyruvate carboxylase in the livers of patients with NASH; (c) changes in the methionine cycle; (d) NASH remission increased the entry of glucose carbon into the mitochondria and decreased anaplerotic reactions; (e) NASH remission significantly decreased the α-KG-to-succinate ratio. * p < 0.05, ** p < 0.01, and *** p < 0.001, by the Mann–Whitney U test. The results are shown as the means and SD. The red colour indicates an increase and the blue colour a decrease in metabolite concentrations comparing the groups indicated in the figure. Colour intensity indicates the.
Figure 5
Figure 5
In cultured hepatocytes, increases in cellular α-KG altered mitochondrial metabolism, apoptosis, and autophagy. (a) Quantitative metabolomics revealed that the increased α-KG levels altered the amino acid metabolome and resulted in the accumulation of metabolites from the citric acid cycle. Metabolites from one-carbon metabolism were either unaffected or significantly decreased. (b) Supplementation with metformin abrogated most of the α-KG-induced metabolic effects. (c) Representative Western blots of selected markers indicated a dose-dependent effect of α-KG in stimulating apoptosis and decreasing autophagy via mTORC1 activation. (d) Metformin also abrogated these effects by increasing AMPK phosphorylation. “Vehicle” blots are blots without DMKG and were used as controls. The red colour indicates an increase and the blue colour a decrease in metabolite concentrations comparing the groups indicated in the figure. Colour intensity indicates the degree of change, expressed as log2 fold-change, according to the scale shown next to the panels. The numbers to the left of the blots are the molecular weights. FAH: Fumarylacetoacetate hydrolase.
Figure 6
Figure 6
Hepatic transcriptome signature associated with NASH. (a) Volcano plot showing changes in mRNA expression in patients with or without NASH. Pink colouring indicates p-values < 0.05, while darker shading indicates absolute value of log2 (fold-change) in expression greater than 1. (b) Heatmap showing significantly differentially expressed genes with p < 0.05 and absolute value of log2 (fold-change) > 1. Unsupervised hierarchical clustering revealed a clear separation between NASH and non-NASH (shown as red and blue bars across the top of the heatmap, respectively). The colour range indicates low to high gene expression (blue to red, respectively).
Figure 7
Figure 7
In liver DNA, differentially methylated genomic regions were associated with hepatic gene expression: (a) NASH affected the 5-methylcytosine-to-5-hydroxymethylcytosine conversion in genomic DNA with (b) stable bimodal distribution of CpG methylation; (c) there were 2508 differentially methylated CpGs between groups; (d) unsupervised hierarchical clustering identified a subset of 367 differentially methylated CpGs in promoters that distinguished the livers of patients with and without NASH. (e) The scatter plot shows changes in methylation and gene expression. Purple colouring indicates CpGs in promoters of genes whose expression goes up or down with promoter hypo- or hypermethylation, respectively and labels indicate significant correlations between methylation and gene expression. *** p < 0.001.

References

    1. Polyzos S.A., Kountouras J., Mantzoros C.S. Obesity and nonalcoholic fatty liver disease: From pathophysiology to therapeutics. Metabolism. 2019;92:82–97. doi: 10.1016/j.metabol.2018.11.014. - DOI - PubMed
    1. Koliaki C., Szendroedi J., Kaul K., Jelenik T., Nowotny P., Jankowiak F., Herder C., Carstensen M., Krausch M., Knoefel W.T., et al. Adaptation of hepatic mitochondrial function in humans with non-alcoholic fatty liver is lost in steatohepatitis. Cell. Metab. 2015;21:739–746. doi: 10.1016/j.cmet.2015.04.004. - DOI - PubMed
    1. Hernández-Alvarez M.I., Sebastián D., Vives S., Ivanova S., Bartoccioni P., Kakimoto P., Plana N., Veiga S.R., Hernández V., Vasconcelos N., et al. Deficient endoplasmic reticulum-mitochondrial phosphatidylserine transfer causes liver disease. Cell. 2019;177:881–895. doi: 10.1016/j.cell.2019.04.010. - DOI - PubMed
    1. Cuyàs E., Corominas-Faja B., Joven J., Menendez J.A. Cell cycle regulation by the nutrient-sensing mammalian target of rapamycin (mTOR) pathway. Methods Mol. Biol. 2014;1170:113–144. doi: 10.1007/978-1-4939-0888-2_7. - DOI - PubMed
    1. Calvo N., Beltrán-Debón R., Rodríguez-Gallego E., Hernández-Aguilera A., Guirro M., Mariné-Casadó R., Millá L., Alegret J.M., Sabench F., del Castillo D., et al. Liver fat deposition and mitochondrial dysfunction in morbid obesity: An approach combining metabolomics with liver imaging and histology. World J. Gastroenterol. 2015;21:7529–7544. doi: 10.3748/wjg.v21.i24.7529. - DOI - PMC - PubMed

MeSH terms

Substances