. 2022 Jul 17;23(14):7867.
doi: 10.3390/ijms23147867.

Identification of Leukocyte Surface P2X7 as a Biomarker Associated with Alzheimer's Disease

Affiliations

Identification of Leukocyte Surface P2X7 as a Biomarker Associated with Alzheimer's Disease

Yihan Li et al. Int J Mol Sci. .

Abstract

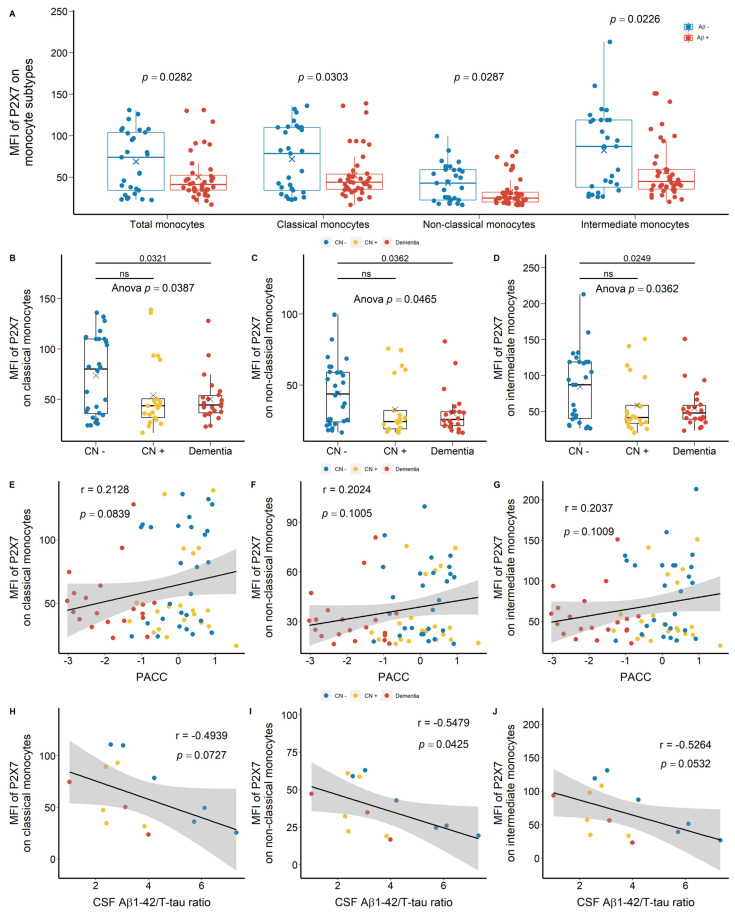
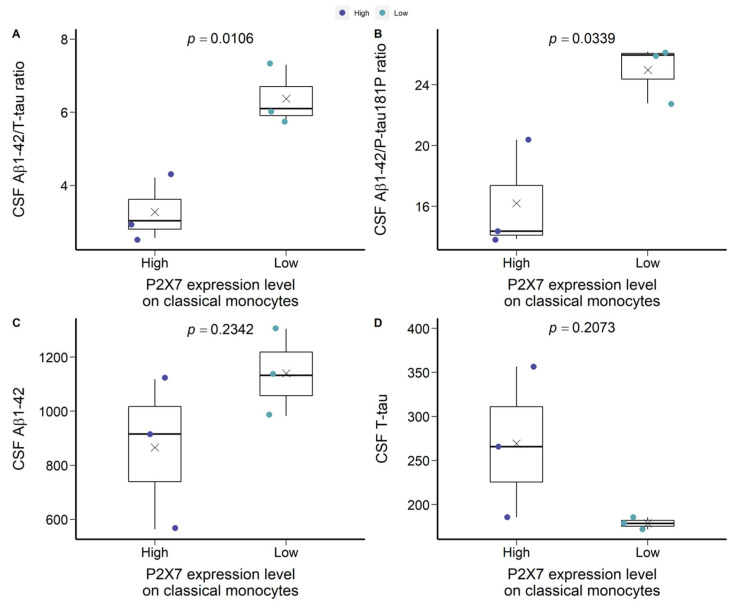
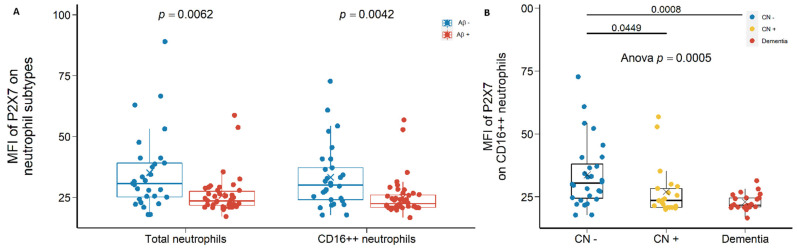
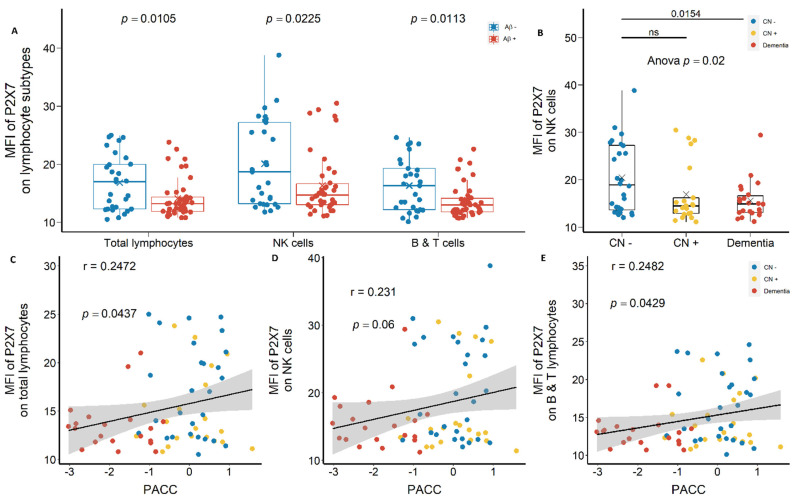
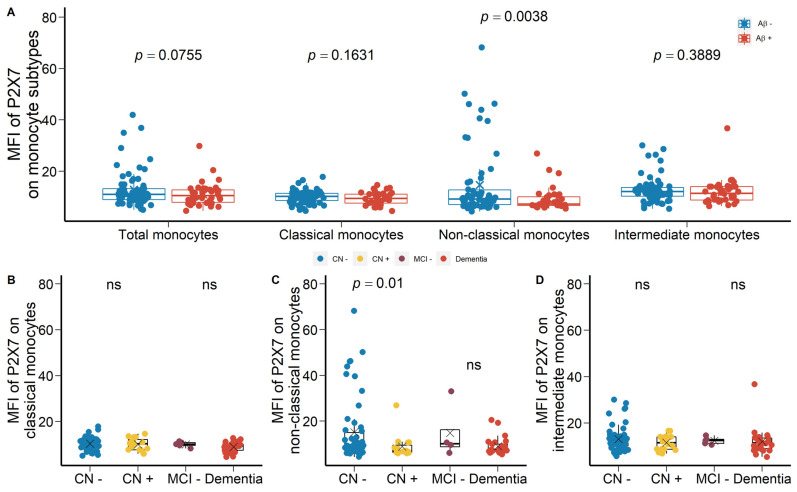
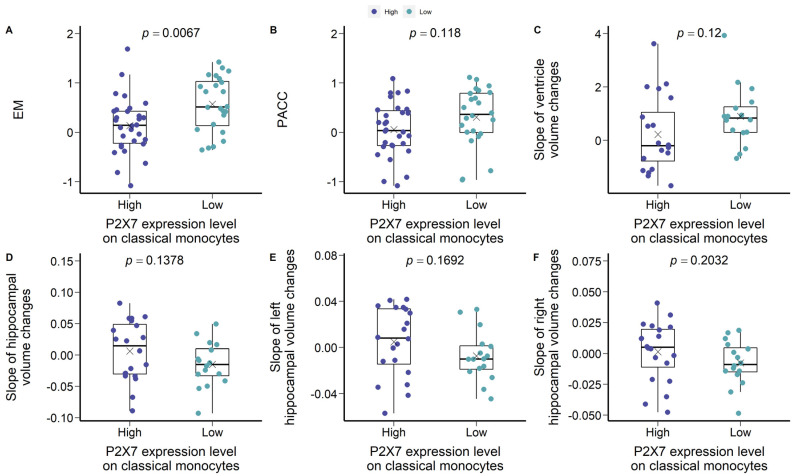
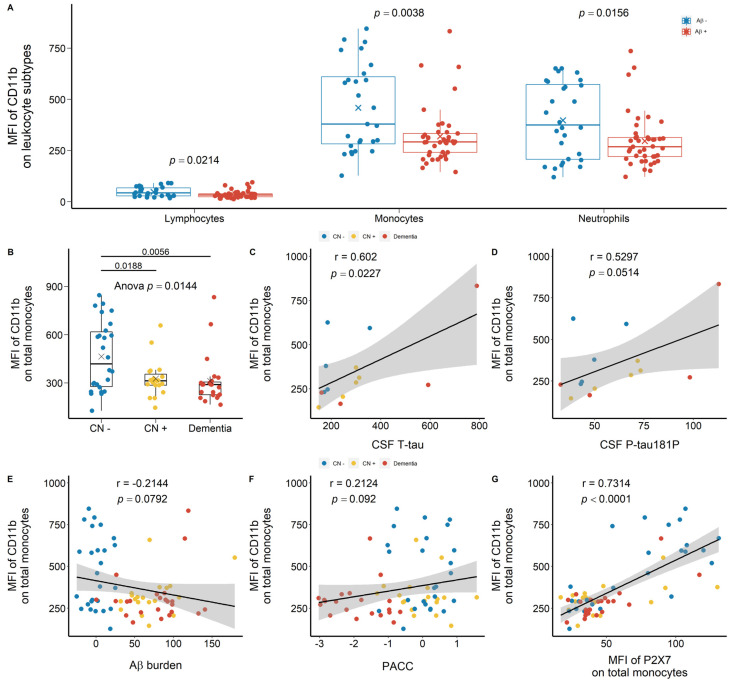
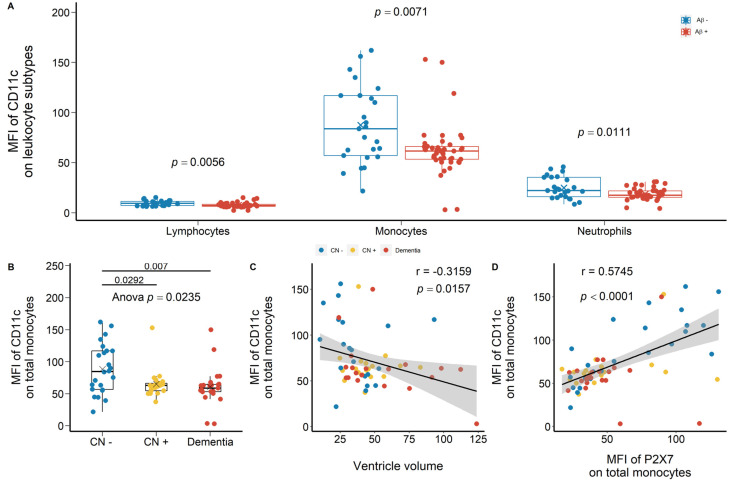
Alzheimer's disease (AD) has shown altered immune responses in the periphery. We studied P2X7 (a proinflammatory receptor and a scavenger receptor) and two integrins, CD11b and CD11c, on the surface of circulating leukocytes and analysed their associations with Aβ-PET, brain atrophy, neuropsychological assessments, and cerebrospinal fluid (CSF) biomarkers. Total 287 age-matched, sex-balanced participants were recruited in a discovery cohort and two validation cohorts through the AIBL study and studied using tri-colour flow cytometry. Our results demonstrated reduced expressions of P2X7, CD11b, and CD11c on leukocytes, particularly monocytes, in Aβ +ve cases compared with Aβ -ve controls. P2X7 and integrin downregulation was observed at pre-clinical stage of AD and stayed low throughout disease course. We further constructed a polygenic risk score (PRS) model based on 12 P2RX7 risk alleles to assess the genetic impact on P2X7 function in AIBL and ADNI cohorts. No significant association was identified between the P2RX7 gene and AD, indicating that P2X7 downregulation in AD is likely caused by environmental changes rather than genetic factors. In conclusion, the downregulation of P2X7 and integrins at pre-clinical stage of AD indicates altered pro-inflammatory responses, phagocytic functions, and migrating capabilities of circulating monocytes in early AD pathogenesis. Our study not only improves our understanding of peripheral immune involvement in early stage of AD but also provides more insights into novel biomarker development, diagnosis, and prognosis of AD.

Keywords: CSF Aβ1-42; CSF P-tau181P; CSF T-tau; brain atrophy; episodic memory; myeloid cells; purinergic receptors; the Preclinical Alzheimer’s Cognitive Composite (PACC).


Conflict of interest statement

The authors declare no conflict of interest. The funders had no role in the design of the study; in the collection, analyses, or interpretation of data; in the writing of the manuscript, or in the decision to publish the results.

Figures

Figure 1
Figure 1
P2X7 expressions on monocytes in the discovery cohort. (A) P2X7 expressions on total monocytes (left 1), CD14+CD16 classical monocytes (left 2), CD14dimCD16+ non-classical monocytes (right 2), and CD14+CD16+ intermediate monocytes (right 1) between Aβ −ve controls (Aβ−) and Aβ +ve cases (Aβ+). Bar graphs illustrated the boxplot distribution of individual measurements with “x” denoting the mean. Two group comparison was determined by t-test. (BD) P2X7 expressions on classical monocytes, non-classical monocytes, and intermediate monocytes between CN (CN−: CN −ve), pre-clinical (CN+: CN +ve), and AD with dementia (Dementia: MCI +ve and AD) individuals. Bar graphs illustrated the boxplot distribution of individual measurements with “x” denoting the mean. Three-group comparison was determined by one-way ANOVA followed by multiple comparison using Dunnett’s post-hoc test (solid line). (EJ) Associations between monocyte P2X7 expressions, PACC, and CSF biomarker. Correlation r and p values were calculated by Pearson product-moment correlational analysis. The “grey” band indicated the 95% confidence interval of the black linear regression line. ns: no significance.
Figure 2
Figure 2
Characteristics of P2X7-low CN −ve and P2X7-high CN −ve groups in the discovery cohort. (A) CSF Aβ1-42/T-tau ratio. (B) CSF Aβ1-42/P-tau181P ratio. (C) CSF Aβ1-42 concentration (μg/L). (D) CSF T-tau concentration (μg/L). Two group comparison was determined by t-test.
Figure 3
Figure 3
P2X7 expressions on neutrophils in the discovery cohort. (A) P2X7 expressions on total neutrophils (left) and CD14CD16++ neutrophils (right) between in Aβ −ve controls (Aβ−) and Aβ +ve cases (Aβ+). Bar graphs illustrated the boxplot distribution of individual measurements with “x” denoting the mean. Two group comparison was determined by t-test. (B) P2X7 expressions on CD14CD16++ neutrophils between CN (CN−: CN −ve), pre-clinical (CN+: CN +ve), and AD with dementia (Dementia: MCI +ve and AD) individuals. Bar graphs illustrated the boxplot distribution of individual measurements with “x” denoting the mean. Three-group comparison was determined by one-way ANOVA followed by multiple comparison using Dunnett’s post-hoc test (solid line).
Figure 4
Figure 4
P2X7 expressions on lymphocytes in the discovery cohort. (A) P2X7 expressions on total lymphocytes (left), CD14CD16+ NK cells (middle), and CD14CD16 B and T lymphocytes (right) between Aβ −ve (Aβ−) and Aβ +ve (Aβ+). Bar graphs illustrated the boxplot distribution of individual measurements with “x” denoting the mean. Two group comparison was determined by t-test. (B) P2X7 expressions on NK cells between CN (CN−: CN −ve), pre-clinical (CN+: CN +ve), and AD with dementia (Dementia: MCI +ve and AD) individuals. Bar graphs illustrated the boxplot distribution of individual measurements with “x” denoting the mean. Three-group comparison was determined by one-way ANOVA followed by multiple comparison using Dunnett’s post-hoc test (solid line). (CE) The associations between P2X7 expressions and PACC. Correlation r and p values were calculated by Pearson product-moment correlational analysis. ns: no significance.
Figure 5
Figure 5
P2X7 expressions on monocytes in the validation cohort A. (A) P2X7 expressions on total monocytes (left 1), CD14+CD16 classical monocytes (left 2), CD14dimCD16+ non-classical monocytes (right 2), and CD14+CD16+ intermediate monocytes (right 1) between Aβ −ve controls (Aβ−) and Aβ +ve cases (Aβ+). Two group comparison was determined by t-test. (BD) Comparisons of P2X7 expressions on classic monocytes, non-classical monocytes, and intermediate monocytes between CN (CN−: CN −ve) and pre-clinical (CN+: CN +ve) individuals. Comparisons of P2X7 expressions on classic monocytes, non-classical monocytes, and intermediate monocytes between prodromal (MCI−: MCI −ve) and AD with dementia (Dementia: MCI +ve and AD) individuals. Two group comparison was determined by t-test. ns: no significance.
Figure 6
Figure 6
Characteristics of P2X7-low CN −ve and P2X7-high CN −ve groups in the validation cohort A. (A) EM. (B) PACC. (C) Slope of ventricle volume changes per year. (D) Slope of hippocampal volume changes per year. (E) Slope of left hippocampal volume changes per year. (F) Slope of right hippocampal volume changes per year. Two group comparison was determined by t-test.
Figure 7
Figure 7
CD11b expressions on peripheral leukocytes in the discovery cohort. (A) CD11b expressions on total lymphocytes (left), total monocytes (middle), and total neutrophils (right) between Aβ −ve (Aβ−) and Aβ +ve (Aβ+). Bar graphs illustrated the boxplot distribution of individual measurements with “x” denoting the mean. Two group comparison was determined by t-test. (B) CD11b expressions on total monocytes between CN (CN−: CN −ve), pre-clinical (CN+: CN +ve), and AD with dementia (Dementia: MCI +ve and AD) individuals. Bar graphs illustrated the boxplot distribution of individual measurements with “x” denoting the mean. Three-group comparison was determined by one-way ANOVA followed by multiple comparison using Dunnett’s post-hoc test (solid line). (CF) Associations between monocytic CD11b expressions, CSF biomarkers (μg/L), Aβ burden (CL) measured by PET, and PACC. (G) Association between leukocyte CD11b expressions and P2X7 expressions. Correlation r and p values were calculated by Pearson product-moment correlational analysis. The “grey” band indicated the 95% confidence interval of the black linear regression line.
Figure 8
Figure 8
CD11c expressions on peripheral leukocytes in the discovery cohort. (A) CD11c expressions on total lymphocytes (left), total monocytes (middle), and total neutrophils (right) between Aβ −ve controls (Aβ−) and Aβ +ve cases (Aβ+). Bar graphs illustrated the boxplot distribution of individual measurements with “x” denoting the mean. Two group comparison was determined by t-test. (B) CD11c expressions on total monocytes between CN (CN−: CN −ve), pre-clinical (CN+: CN +ve), and AD with dementia individuals (Dementia: MCI +ve and AD). Bar graphs illustrated the boxplot distribution of individual measurements with “x” denoting the mean. Three-group comparison was determined by one-way ANOVA followed by multiple comparison using Dunnett’s post-hoc test (solid line). (C) The association between monocyte CD11c expression and ventricle volume. (D) The association between monocyte CD11c expression and P2X7 expression. Correlation r and p values were calculated by Pearson product-moment correlational analysis. The “grey” band indicated the 95% confidence interval of the black linear regression line.

References

    1. Scheltens P., De Strooper B., Kivipelto M., Holstege H., Chételat G., Teunissen C.E., Cummings J., van der Flier W.M. Alzheimer’s disease. Lancet. 2021;397:1577–1590. doi: 10.1016/S0140-6736(20)32205-4. - DOI - PMC - PubMed
    1. Selkoe D.J., Hardy J. The amyloid hypothesis of Alzheimer’s disease at 25 years. EMBO Mol. Med. 2016;8:595–608. doi: 10.15252/emmm.201606210. - DOI - PMC - PubMed
    1. De Strooper B., Karran E. The cellular phase of Alzheimer’s disease. Cell. 2016;164:603–615. doi: 10.1016/j.cell.2015.12.056. - DOI - PubMed
    1. Li Y., Laws S.M., Miles L.A., Wiley J.S., Huang X., Masters C.L., Gu B.J. Genomics of Alzheimer’s disease implicates the innate and adaptive immune systems. Cell. Mol. Life Sci. 2021;78:7397–7426. doi: 10.1007/s00018-021-03986-5. - DOI - PMC - PubMed
    1. Villemagne V.L., Burnham S., Bourgeat P., Brown B., Ellis K.A., Salvado O., Szoeke C., Macaulay S.L., Martins R., Maruff P., et al. Amyloid β deposition, neurodegeneration, and cognitive decline in sporadic Alzheimer’s disease: A prospective cohort study. Lancet Neurol. 2013;12:357–367. doi: 10.1016/S1474-4422(13)70044-9. - DOI - PubMed

MeSH terms