

Varying Oxygen Partial Pressure Elicits Blood-Borne Microparticles Expressing Different Cell-Specific Proteins-Toward a Targeted Use of Oxygen?
- PMID: 35887238
- PMCID: PMC9322965
- DOI: 10.3390/ijms23147888
Varying Oxygen Partial Pressure Elicits Blood-Borne Microparticles Expressing Different Cell-Specific Proteins-Toward a Targeted Use of Oxygen?
Abstract
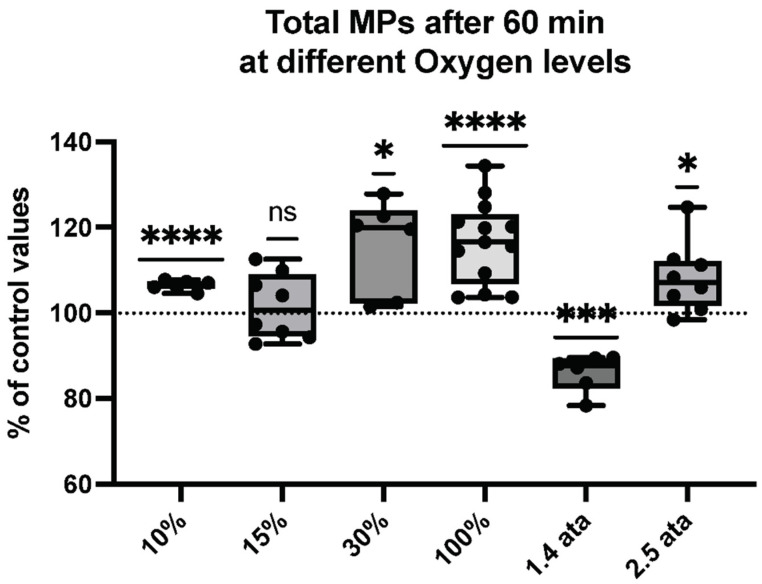
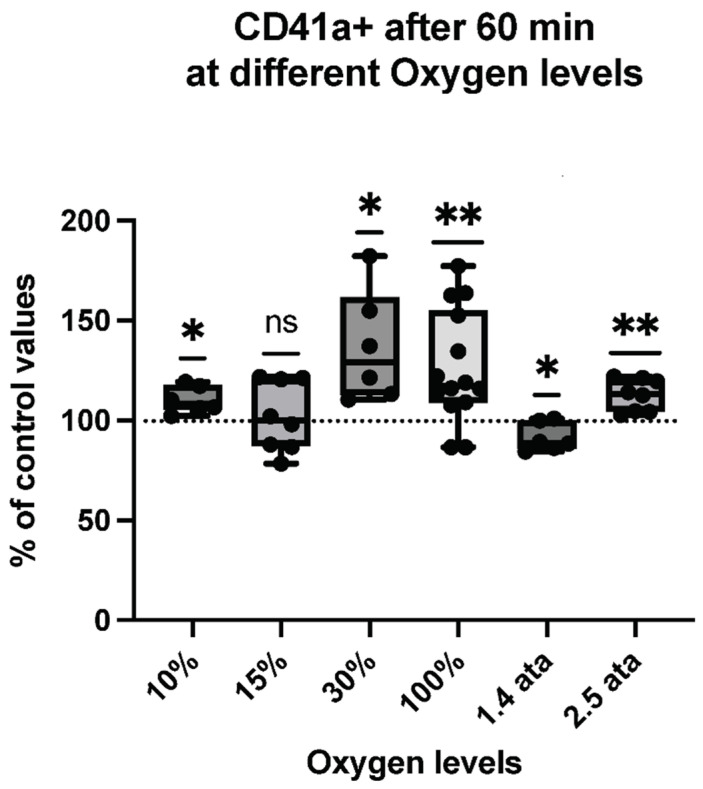
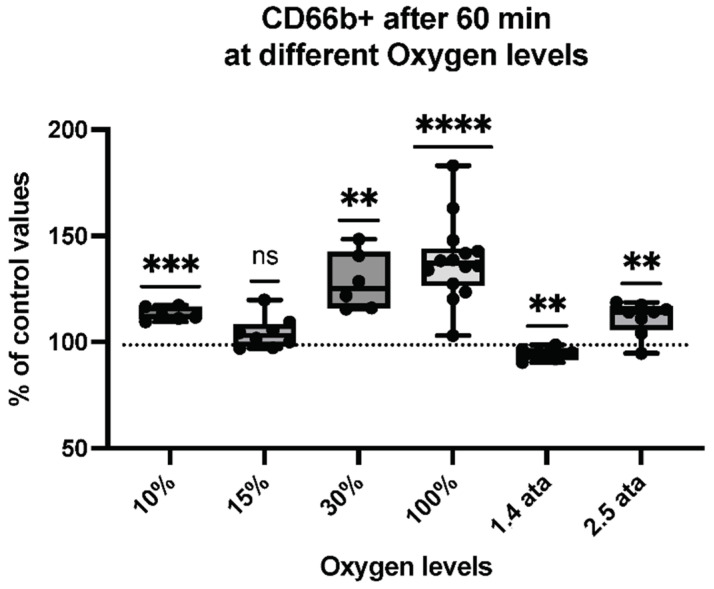
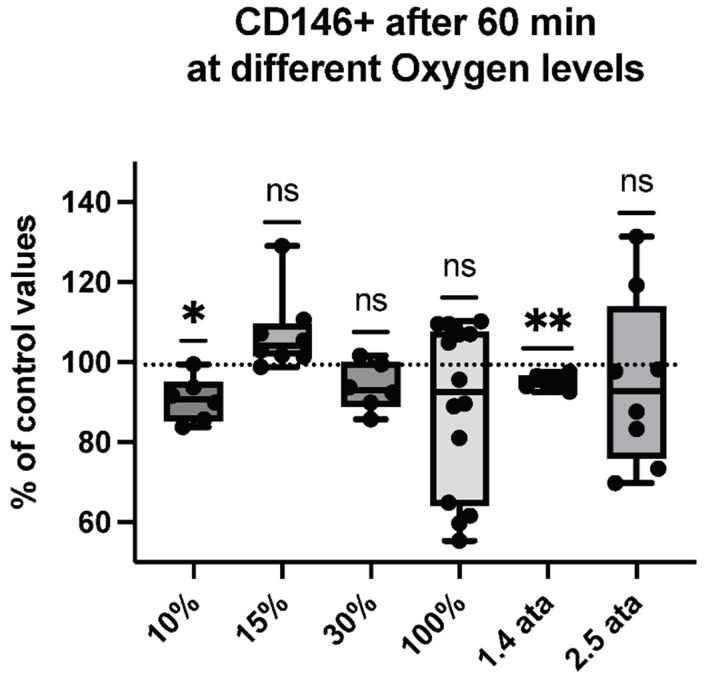
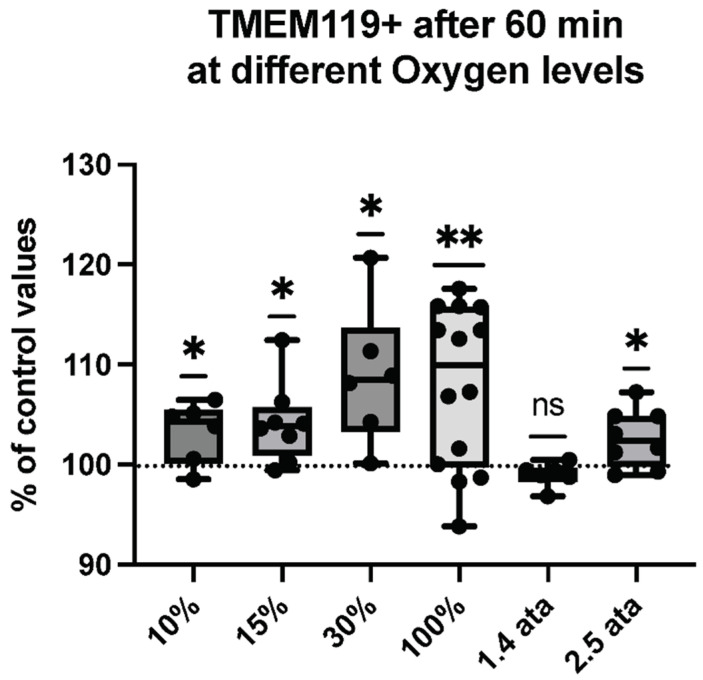
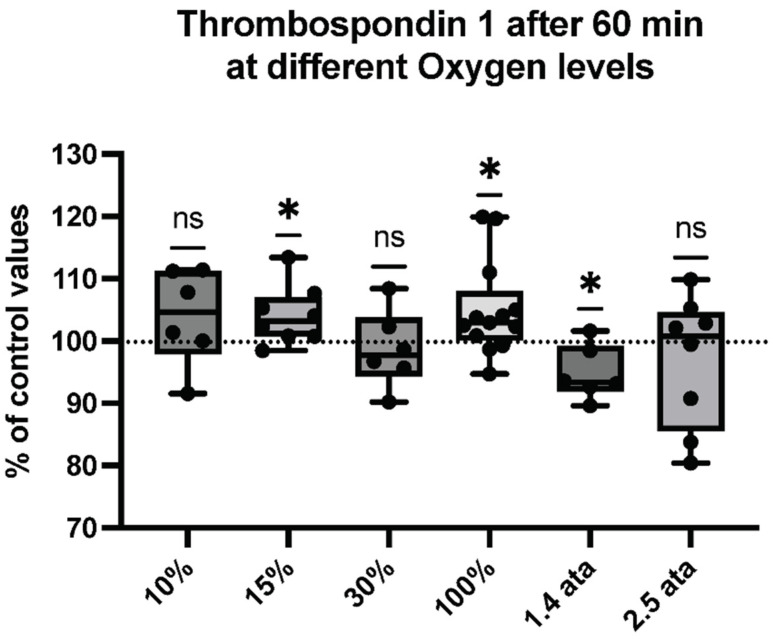
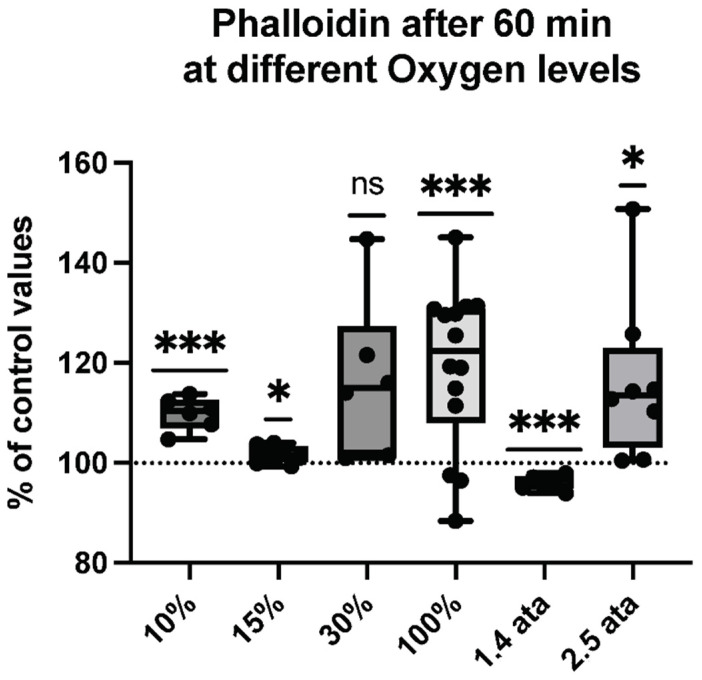
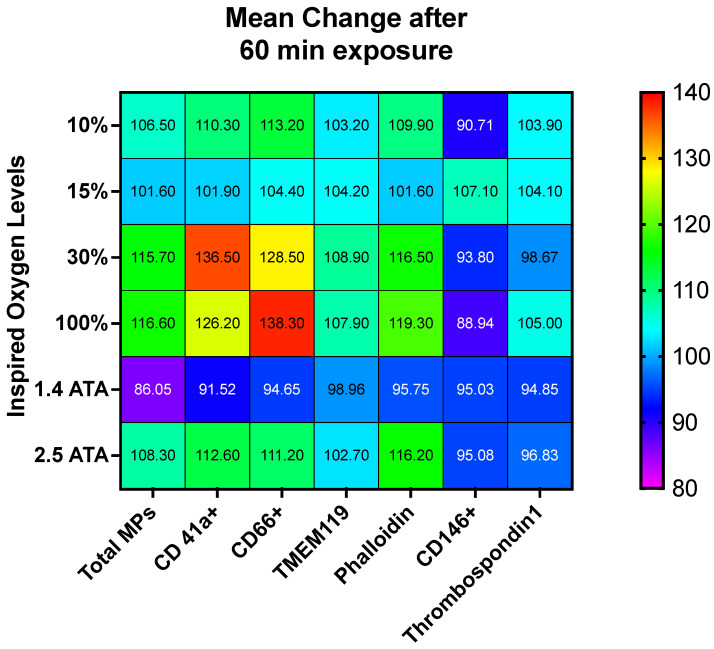
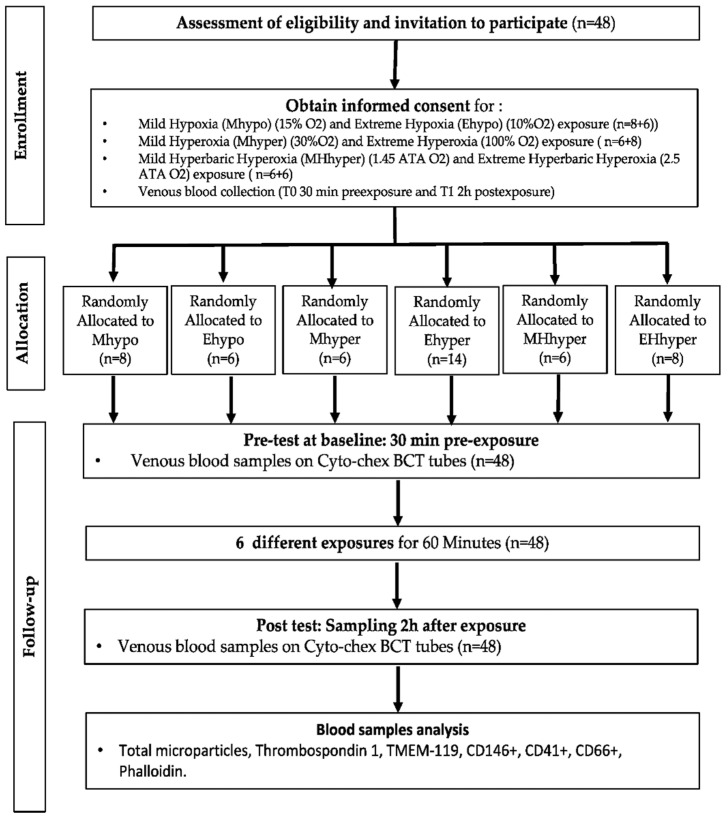
Oxygen is a powerful trigger for cellular reactions, but there are few comparative investigations assessing the effects over a large range of partial pressures. We investigated a metabolic response to single exposures to either normobaric (10%, 15%, 30%, 100%) or hyperbaric (1.4 ATA, 2.5 ATA) oxygen. Forty-eight healthy subjects (32 males/16 females; age: 43.7 ± 13.4 years, height: 172.7 ± 10.07 cm; weight 68.4 ± 15.7 kg) were randomly assigned, and blood samples were taken before and 2 h after each exposure. Microparticles (MPs) expressing proteins specific to different cells were analyzed, including platelets (CD41), neutrophils (CD66b), endothelial cells (CD146), and microglia (TMEM). Phalloidin binding and thrombospondin-1 (TSP), which are related to neutrophil and platelet activation, respectively, were also analyzed. The responses were found to be different and sometimes opposite. Significant elevations were identified for MPs expressing CD41, CD66b, TMEM, and phalloidin binding in all conditions but for 1.4 ATA, which elicited significant decreases. Few changes were found for CD146 and TSP. Regarding OPB, further investigation is needed to fully understand the future applications of such findings.
Keywords: altitude; cellular reactions; decompression sickness; diving; hyperbaric oxygen; hyperoxia; hyperoxic-hypoxic paradox; hypoxia; normobaric oxygen paradox.
Conflict of interest statement
The authors declare no conflict of interest.
Figures
Similar articles
-
Effects of Pressure, Hypoxia, and Hyperoxia on Neutrophil Granulocytes.Biomolecules. 2024 Sep 30;14(10):1242. doi: 10.3390/biom14101242. Biomolecules. 2024. PMID: 39456176 Free PMC article.
-
Oxidative Stress Response Kinetics after 60 Minutes at Different (1.4 ATA and 2.5 ATA) Hyperbaric Hyperoxia Exposures.Int J Mol Sci. 2023 Aug 2;24(15):12361. doi: 10.3390/ijms241512361. Int J Mol Sci. 2023. PMID: 37569737 Free PMC article.
-
Association of microparticles and neutrophil activation with decompression sickness.J Appl Physiol (1985). 2015 Sep 1;119(5):427-34. doi: 10.1152/japplphysiol.00380.2015. Epub 2015 Jul 2. J Appl Physiol (1985). 2015. PMID: 26139218
-
The Hyperoxic-Hypoxic Paradox.Biomolecules. 2020 Jun 25;10(6):958. doi: 10.3390/biom10060958. Biomolecules. 2020. PMID: 32630465 Free PMC article. Review.
-
MAN UNDER PRESSURE.Can Med Assoc J. 1964 Oct 31;91(18):941-5. Can Med Assoc J. 1964. PMID: 14217256 Free PMC article. Review.
Cited by
-
Neuroinflammation with increased glymphatic flow in a murine model of decompression sickness.J Neurophysiol. 2023 Mar 1;129(3):662-671. doi: 10.1152/jn.00005.2023. Epub 2023 Feb 8. J Neurophysiol. 2023. PMID: 36752495 Free PMC article.
-
Oxidative Stress Response's Kinetics after 60 Minutes at Different (30% or 100%) Normobaric Hyperoxia Exposures.Int J Mol Sci. 2022 Dec 30;24(1):664. doi: 10.3390/ijms24010664. Int J Mol Sci. 2022. PMID: 36614106 Free PMC article. Clinical Trial.
-
Effectiveness of Hyperbaric Oxygen Therapy in SARS-CoV-2 Pneumonia: The Primary Results of a Randomised Clinical Trial.J Clin Med. 2022 Dec 20;12(1):8. doi: 10.3390/jcm12010008. J Clin Med. 2022. PMID: 36614808 Free PMC article.
-
Exhaled breath condensate profiles of U.S. Navy divers following prolonged hyperbaric oxygen (HBO) and nitrogen-oxygen (Nitrox) chamber exposures.J Breath Res. 2023 Jun 12;17(3):10.1088/1752-7163/acd715. doi: 10.1088/1752-7163/acd715. J Breath Res. 2023. PMID: 37207635 Free PMC article. Clinical Trial.
-
Oxygen Variations-Insights into Hypoxia, Hyperoxia and Hyperbaric Hyperoxia-Is the Dose the Clue?Int J Mol Sci. 2023 Aug 30;24(17):13472. doi: 10.3390/ijms241713472. Int J Mol Sci. 2023. PMID: 37686277 Free PMC article.
References
Publication types
MeSH terms
Substances
Grants and funding
LinkOut - more resources
Full Text Sources
Research Materials
Miscellaneous
