. 2022 Jul 18;23(14):7902.
doi: 10.3390/ijms23147902.

Unusual Association of NF-κB Components in Tumor-Associated Macrophages (TAMs) Promotes HSPG2-Mediated Immune-Escaping Mechanism in Breast Cancer

Affiliations

Unusual Association of NF-κB Components in Tumor-Associated Macrophages (TAMs) Promotes HSPG2-Mediated Immune-Escaping Mechanism in Breast Cancer

Veronica De Paolis et al. Int J Mol Sci. .

Abstract

The cellular heterogeneity of the tumor environment of breast cancer (BC) is extremely complex and includes different actors such as neoplastic, stromal, and immunosuppressive cells, which contribute to the chemical and mechanical modification of the environment surrounding the tumor-exasperating immune-escaping mechanisms. In addition to molecular signals that make the tumor microenvironment (TME) unacceptable for the penetrance of the immune system, the physical properties of tumoral extracellular matrix (tECM) also have carved out a fundamental role in the processes of the protection of the tumor niche. Tumor-associated macrophages (TAMs), with an M2 immunosuppressive phenotype, are important determinants for the establishment of a tumor phenotype excluded from T cells. NF-κB transcription factors orchestrate innate immunity and represent the common thread between inflammation and cancer. Many studies have focused on canonical activation of NF-κB; however, activation of non-canonical signaling predicts poor survival and resistance to therapy. In this scenario, we demonstrated the existence of an unusual association of NF-κB components in TAMs that determines the deposition of HSPG2 that affects the stiffness of tECM. These results highlight a new mechanism counterbalanced between physical factors and a new perspective of mechano-pathology to be targeted to counteract immune evasion in BC.

Keywords: 3D culture; HSPG2; NF-κB; tumor-associated macrophages.


Conflict of interest statement

The authors declare no conflict of interest.

Figures
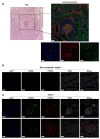
Figure 1
Figure 1
Human triple-negative breast cancer tissue analysis. (a) Left panel: Immunohistochemical analysis showing HE staining in malignant tissues was used to identify high cellular density areas and cancer islets. Right panel: Immunofluorescence analysis on the same section was performed to stain HSPG2 in red, and the tissue section was counterstained in green with WGA. Immunofluorescence analysis on sections of tissues derived from the same patients on (b) non-neoplastic surrounding tissue and (c) tumoral tissue were performed to stain HSPG2 in red and CD206+ macrophages in green. Nuclei were counterstained with DAPI, and the tissue section in gray with WGA. Scale bars represent 40 μm. The representative images derived from qualitative analysis of TNBC biopsies of n = 3 patients.
Figure 2
Figure 2
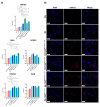
Macrophage marker expression. (a) Gene expression analysis of M2-markers evaluated by qRT-PCR. Error bars represent ±SEM. One-way ANOVA and Tukey correction was used to evaluate the differences between means; * p < 0.033, ** p < 0.002, *** p < 0.0002, **** p < 0.0001. n = 4 for each experimental group. (b) Immunofluorescence analysis of the surface marker CD163 showing CD163+ macrophages in red. Mφ untreated macrophages and M1-polarized macrophages with LPS were used as negative controls. Nuclei were counterstained with DAPI. Scale bars represent 40 μm.
Figure 3
Figure 3
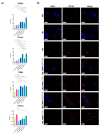
HSPG2 expression in macrophages. (a) Gene expression analysis of HSPG2 and canonical and non-canonical NF-κB pathways were evaluated in untreated and treated macrophages by qRT-PCR. Error bars represent ±SEM. One-way ANOVA and Tukey correction were used to evaluate the differences between means; * p < 0.033, ** p < 0.002, *** p < 0.0002, **** p < 0.0001. n = 4 for each experimental group. (b) Immunofluorescence analysis of HSPG2 in untreated and treated macrophages showing HSPG2 in red and nuclei counterstained with DAPI. Scale bars represent 40 μm.
Figure 4
Figure 4
p65/p52 unusual association. (a) Gene expression analysis of NF-κB target genes and HSPG2 by qRT-PCR in TAMs treated with QNZ, compared to control DMSO treatment. n = 5 for each experimental group. (b) Western blot analysis of cytoplasmic and nuclear fractions of treated macrophages. GAPDH and H3 were used as cytoplasmic and nuclear markers (Wh = whole extract; Cyt = cytoplasmic fraction; Nuc = nuclear fraction). n = 3 for each experimental group. (c) Co-immunoprecipitation (Co-IP) of p65 and p52 proteins in nuclear extracts of untreated and treated macrophages. Upper panel: IP with p65 antibody; lower panel: immunoblot with p52 antibody on the same membrane shown in the upper panel. IP lane was compared to the control IgG lane, INPUT represents 1% of the total nuclear lysate. n = 3 for each experimental group. Error bars represent ±SEM. Student’s t-test was used to analyze the efficacy of QNZ treatment for each gene, compared to the control treatment. One-way ANOVA and Tukey correction were used to evaluate the differences between means for the nuclear protein enrichment; * p < 0.033, ** p < 0.002, *** p < 0.0002.
Figure 5
Figure 5
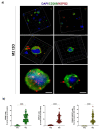
HSPG2 expression in t3D matrix. (a) 3D volume rendering of Z-stack volumes acquired at different zooming-in (+3× or 5× zoom-in). The immunofluorescence representative images display M2 embedded in t3D matrix. CD206 was detected in green, HSPG2 in red; nuclei were counterstained with DAPI. Scale bars represent 10 μm. (b) Dot-plot graphs showing total quantifications, displayed as percentages of all counted nuclei, of either CD206+ cells (green dots), HSPG2+ cells (red dots), or double-positive CD206+HSPG2+ cells (yellow dots). The analyses were performed on all acquired Z-plans from both Mφ (n = 2230) and M2 (n = 1114) macrophages in t3D matrix. Error bars represent ±SEM. Student’s t-test; **** p < 0.0001.
Figure 6
Figure 6
Macrophage genes expression in h3D and t3D matrix. (a) M2-markers and for (b) HSPG2, (c) canonical and non-canonical NF-κB pathway by qRT-PCR. One-way ANOVA and Tukey correction were used to evaluate the differences between means; * p < 0.033, ** p < 0.002, *** p < 0.0002, **** p < 0.0001. n = 3 for each experimental group.

References

    1. Siegel R.L., Miller K.D., Fuchs H.E., Jemal A. Cancer Statistics, 2022. CA Cancer J. Clin. 2022;72:7–33. doi: 10.3322/caac.21708. - DOI - PubMed
    1. Zhao S., Zuo W.-J., Shao Z.-M., Jiang Y.-Z. Molecular Subtypes and Precision Treatment of Triple-Negative Breast Cancer. Ann. Transl. Med. 2020;8:499. doi: 10.21037/atm.2020.03.194. - DOI - PMC - PubMed
    1. Peterson J.M., Pepin A., Thomas R., Biagi T., Stark E., Sparks A.D., Johnson K., Kaltman R. Racial Disparities in Breast Cancer Hereditary Risk Assessment Referrals. J. Genet. Couns. 2020;29:587–593. doi: 10.1002/jgc4.1250. - DOI - PubMed
    1. Bai X., Ni J., Beretov J., Graham P., Li Y. Immunotherapy for Triple-Negative Breast Cancer: A Molecular Insight into the Microenvironment, Treatment, and Resistance. J. Natl. Cancer Cent. 2021;1:75–87. doi: 10.1016/j.jncc.2021.06.001. - DOI - PMC - PubMed
    1. Liubomirski Y., Lerrer S., Meshel T., Rubinstein-Achiasaf L., Morein D., Wiemann S., Körner C., Ben-Baruch A. Tumor-Stroma-Inflammation Networks Promote Pro-Metastatic Chemokines and Aggressiveness Characteristics in Triple-Negative Breast Cancer. Front. Immunol. 2019;10:757. doi: 10.3389/fimmu.2019.00757. - DOI - PMC - PubMed