

Protein Abundance of Drug Transporters in Human Hepatitis C Livers
- PMID: 35887291
- PMCID: PMC9317752
- DOI: 10.3390/ijms23147947
Protein Abundance of Drug Transporters in Human Hepatitis C Livers
Abstract
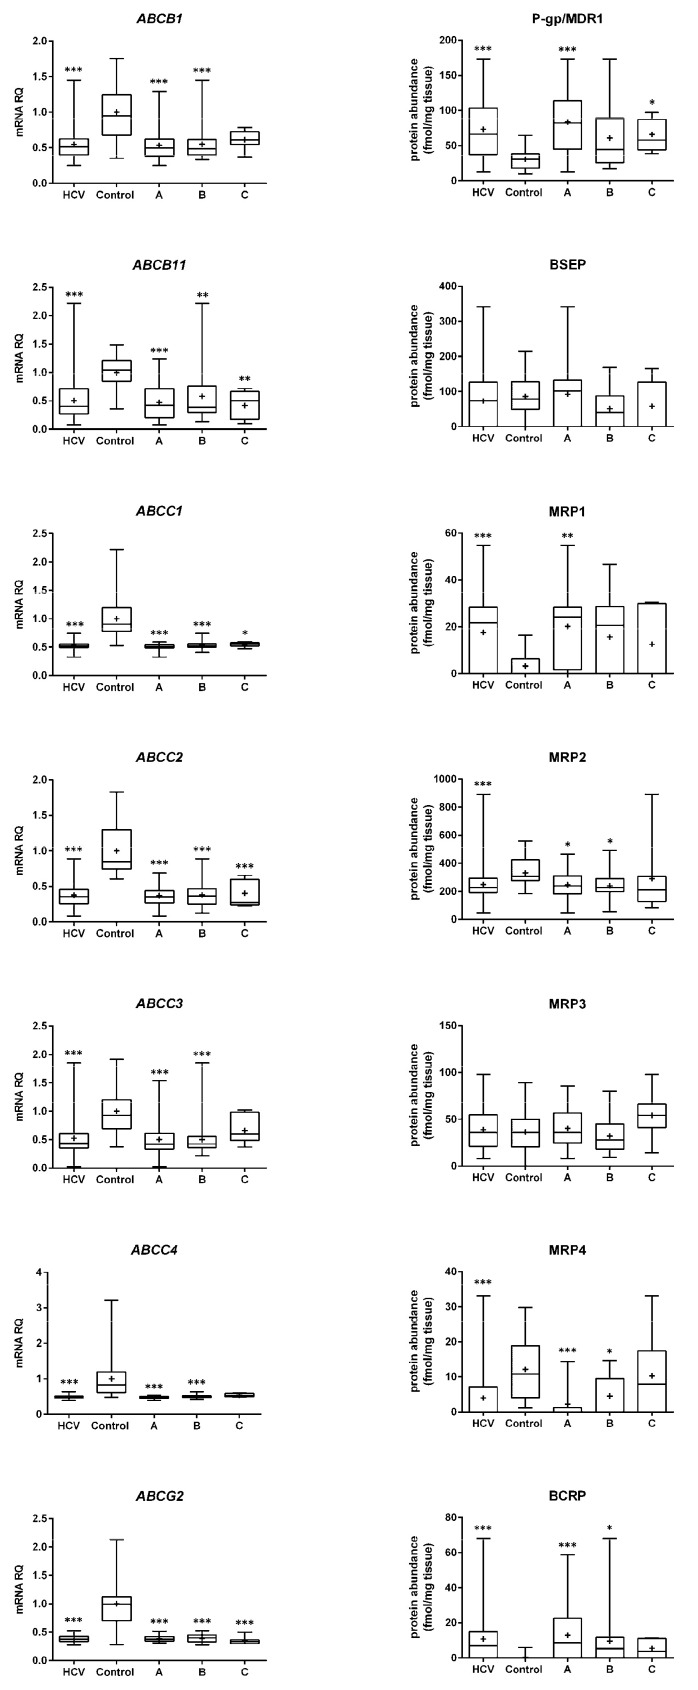
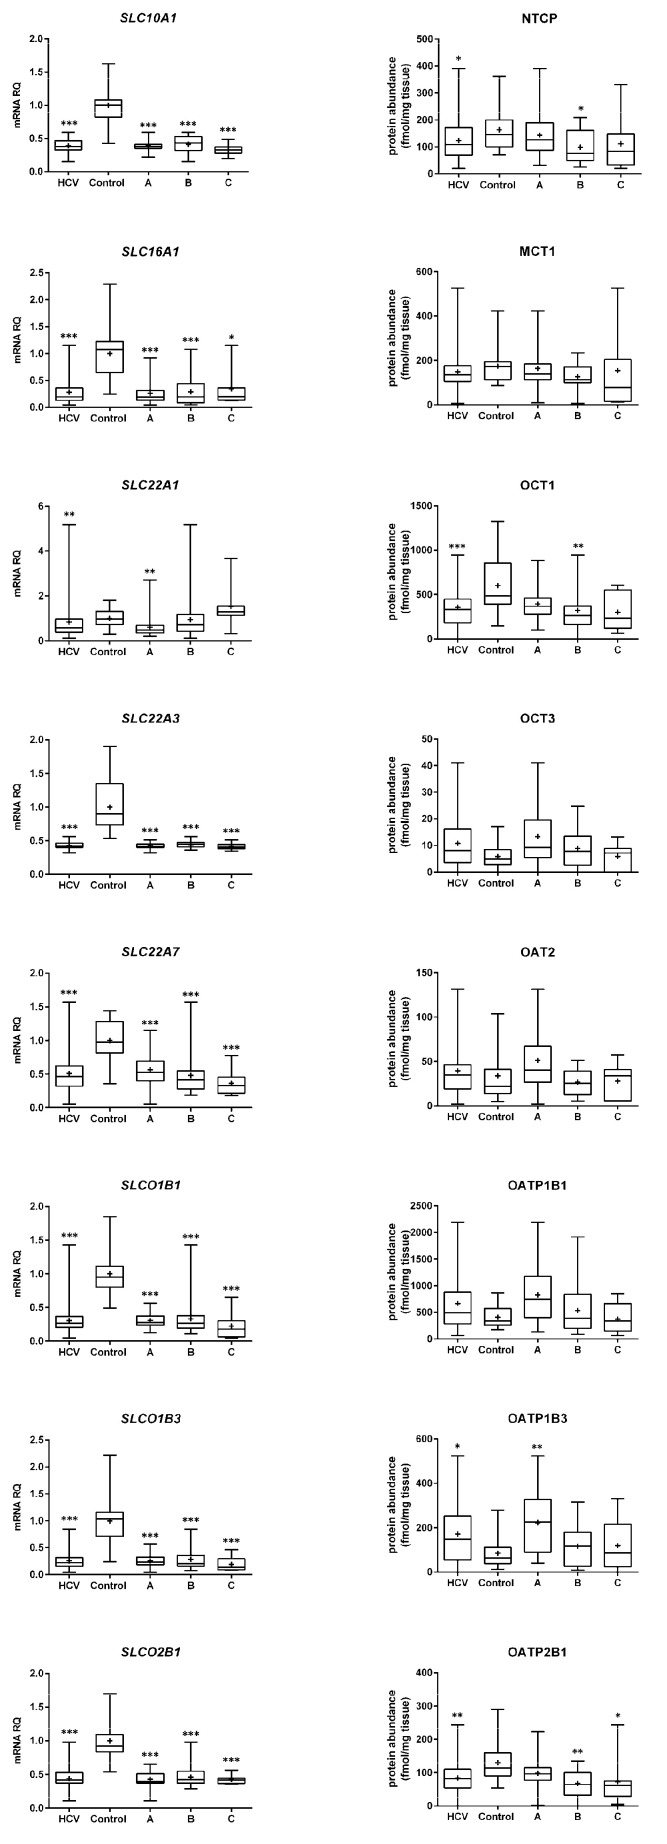
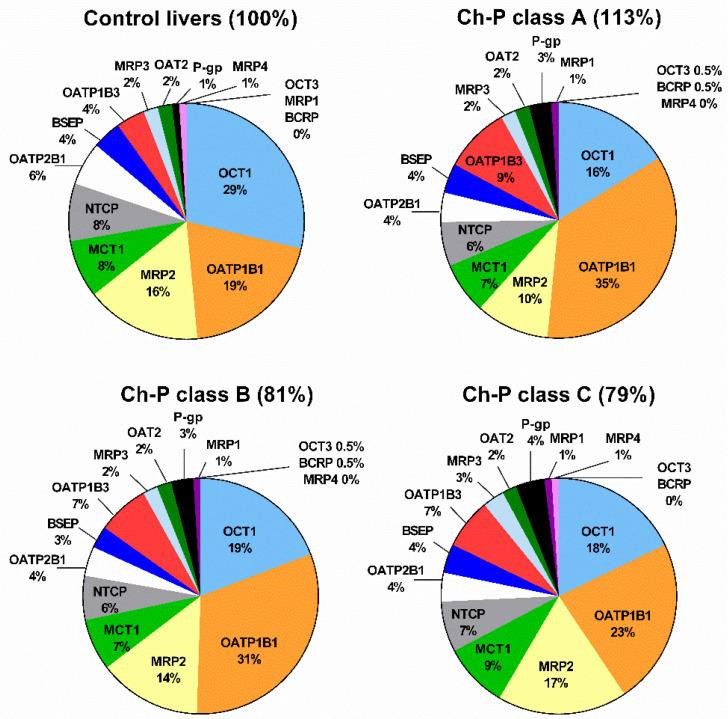
Transmembrane drug transport in hepatocytes is one of the major determinants of drug pharmacokinetics. In the present study, ABC transporters (P-gp, MRP1, MRP2, MRP3, MRP4, BCRP, and BSEP) and SLC transporters (MCT1, NTCP, OAT2, OATP1B1, OATP1B3, OATP2B1, OCT1, and OCT3) were quantified for protein abundance (LC-MS/MS) and mRNA levels (qRT-PCR) in hepatitis C virus (HCV)-infected liver samples from the Child-Pugh class A (n = 30), B (n = 21), and C (n = 7) patients. Protein levels of BSEP, MRP3, MCT1, OAT2, OATP1B3, and OCT3 were not significantly affected by HCV infection. P-gp, MRP1, BCRP, and OATP1B3 protein abundances were upregulated, whereas those of MRP2, MRP4, NTCP, OATP2B1, and OCT1 were downregulated in all HCV samples. The observed changes started to be seen in the Child-Pugh class A livers, i.e., upregulation of P-gp and MRP1 and downregulation of MRP2, MRP4, BCRP, and OATP1B3. In the case of NTCP, OATP2B1, and OCT1, a decrease in the protein levels was observed in the class B livers. In the class C livers, no other changes were noted than those in the class A and B patients. The results of the study demonstrate that drug transporter protein abundances are affected by the functional state of the liver in hepatitis C patients.
Keywords: Child–Pugh score; cirrhosis; drug transporter; hepatitis C; liquid chromatography-mass spectrometry; liver; protein quantification; real-time PCR.
Conflict of interest statement
The authors declare no conflict of interest.
Figures
References
-
- Li D.K., Chung R.T. Overview of Direct-Acting Antiviral Drugs and Drug Resistance of Hepatitis C Virus. Methods Mol. Biol. 2019;191:3–32. - PubMed
-
- Chu X., Chan G.H., Houle R., Lin M., Yabut J., Fandozzi C. In Vitro Assessment of Transporter Mediated Perpetrator DDIs for Several Hepatitis C Virus Direct-Acting Antiviral Drugs and Prediction of DDIs with Statins Using Static Models. AAPS J. 2022;24:45. doi: 10.1208/s12248-021-00677-8. - DOI - PubMed
-
- Sjöstedt N., Adiwidjaja J., Murphy W.A., Brouwer K.L.R. Drug transport in the liver. In: You G., Morris M.E., editors. Drug Transporters: Molecular Characterization and Role in Drug Disposition. 3rd ed. John Wiley & Sons; Boston, MA, USA: 2022.
MeSH terms
Substances
Grants and funding
LinkOut - more resources
Full Text Sources
Medical
Miscellaneous
