. 2022 Jul 20;23(14):8002.
doi: 10.3390/ijms23148002.

Differences in the Autophagy Response to Hypoxia in the Hippocampus and Neocortex of Rats

Affiliations

Differences in the Autophagy Response to Hypoxia in the Hippocampus and Neocortex of Rats

Anna Churilova et al. Int J Mol Sci. .

Abstract

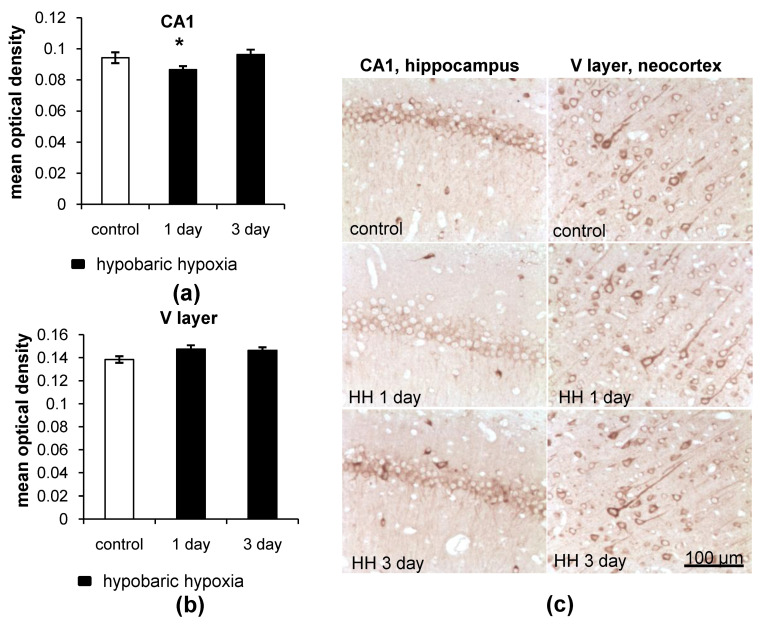
Autophagy is a regulated mechanism of degradation of misfolded proteins and organelles in the cell. Neurons are highly differentiated cells with extended projections, and therefore, their functioning largely depends on the mechanisms of autophagy. For the first time in an animal model using immunohistochemistry, dot analysis, and qRT-PCR, the autophagy (macroautophagy) activity in neurons of two brain regions (hippocampus and neocortex) under normoxia and after exposure to hypoxia was studied. It was found that under normoxia, the autophagic activity was higher in the hippocampal neurons than in the neocortex of rats. In the hippocampus, the exposure of rats to hypoxia resulted in a decrease in the content of autophagy markers LC3 and p62, which was followed by activation of the autophagy-related gene expression. In the neocortex, no changes in these marker proteins were observed after the exposure to hypoxia. These data indicate that the neurons in the hippocampus and neocortex differ in the autophagy response to hypoxia, which may reflect the physiological and functional differences of the pyramidal cells of these brain regions and may to some extent account for the extreme vulnerability of the CA1 hippocampal neurons and relatively high resistance of the neocortical neurons to hypoxia.

Keywords: autophagy; hippocampus; hypoxia; neocortex; neurons.


Conflict of interest statement

The authors declare no conflict of interest.

Figures

Figure A1
Figure A1
The representative immunoblots of LC3 and p62 in the hippocampus and neocortex of rats exposed to HH.
Figure 1
Figure 1
LC3 accumulation in the CA1 field of the hippocampus and the V layer of the neocortex of rats after chloroquine (CQ) injection. (a) Results of immunohistochemistry quantitation of LC3; (b,c) representative images of LC3 accumulation and puncta staining in the CA1 field of the hippocampus and the V layer of the neocortex of rats 1 day after CQ injections. The results are presented as the mean ± standard error of the mean. * the difference between the experimental groups within a brain region is statistically significant, p < 0.05; # the difference between the control groups of the hippocampus and neocortex of rats is statistically significant, p < 0.05.
Figure 2
Figure 2
p62 accumulation in the CA1 field of the hippocampus and the V layer of the neocortex of rats after CQ injection. (a) Results of immunohistochemistry quantification of p62; (b,c) representative images of p62 accumulation and puncta staining in the CA1 field of the hippocampus and the V layer of the neocortex of rats 1 day after CQ injections. The results are presented as the mean ± standard error of the mean. * the difference between the experimental groups within a brain region is statistically significant, p < 0.05; # the difference between the control groups of the hippocampus and neocortex of rats is statistically significant, p < 0.05.
Figure 3
Figure 3
The effect of hypobaric hypoxia (HH) on LC3 protein levels in the CA1 field of the hippocampus and the V layer of the neocortex of rats. (a,b) Immunohistochemical quantification of LC3 levels; (c) representative images of LC3 staining. The results are presented as the mean ± standard error of the mean. * the difference between the experimental groups within a brain region is statistically significant, p < 0.05.
Figure 4
Figure 4
Representative images showing LC3 dots and LC3 staining in the neurons of the CA1 field of the hippocampus and the V layer of the neocortex of rats after exposure to HH.
Figure 5
Figure 5
The effect of HH on the protein levels of p62 in the CA1 field of the hippocampus and the V layer of the neocortex of rats. (a,b) Immunohistochemical quantification of p62 levels; (c) representative images of p62 staining. The results are presented as the mean ± standard error of the mean. * the difference between the experimental groups within a brain region is statistically significant, p < 0.05.
Figure 6
Figure 6
Representative images showing p62 dots and p62 staining in neurons of the CA1 field of the hippocampus and the V layer of the neocortex of rats after exposure to HH.
Figure 7
Figure 7
The assessment of LC3 and p62 levels in the hippocampus and neocortex of rats after exposure to HH. (a,b) Dot quantitation of LC3 and p62 levels, respectively, in the hippocampus. (c,d) Dot quantitation of LC3 and p62 levels, respectively, in the neocortex. The results are presented as the mean ± standard error of the mean. * the difference between the experimental groups within a brain region is statistically significant, p < 0.05.
Figure 8
Figure 8
The effect of HH on the expression of autophagy-related genes in the hippocampus and neocortex of rats. (a,b) Relative mRNA levels of map-lc3 and tf-eb, respectively, in the hippocampus. (c,d) Relative mRNA levels of map-lc3 and tf-eb, respectively, in the neocortex. The results are presented as the mean ± standard error of the mean. * the difference between the experimental groups within a brain region is statistically significant, p < 0.05.

References

    1. Klionsky D.J., Emr S.D. Autophagy as a regulated pathway of cellular degradation. Science. 2000;290:1717–1721. doi: 10.1126/science.290.5497.1717. - DOI - PMC - PubMed
    1. Mizushima N., Komatsu M. Autophagy: Renovation of cells and tissues. Cell. 2011;147:728–741. doi: 10.1016/j.cell.2011.10.026. - DOI - PubMed
    1. Yu L., Chen Y., Tooze S.A. Autophagy pathway: Cellular and molecular mechanisms. Autophagy. 2018;14:207–215. doi: 10.1080/15548627.2017.1378838. - DOI - PMC - PubMed
    1. Stavoe A.K.H., Holzbaur E.L.F. Autophagy in neurons. Annu. Rev. Cell Dev. Biol. 2019;35:477–500. doi: 10.1146/annurev-cellbio-100818-125242. - DOI - PMC - PubMed
    1. Yamamoto A., Yue Z. Autophagy and its normal and pathogenic states in the brain. Annu. Rev. Neurosci. 2014;37:55–78. doi: 10.1146/annurev-neuro-071013-014149. - DOI - PubMed

LinkOut - more resources