. 2022 Jul 5;12(7):996.
doi: 10.3390/life12070996.

Heterogeneities in Ventricular Conduction Following Treatment with Heptanol: A Multi-Electrode Array Study in Langendorff-Perfused Mouse Hearts

Affiliations

Heterogeneities in Ventricular Conduction Following Treatment with Heptanol: A Multi-Electrode Array Study in Langendorff-Perfused Mouse Hearts

Xiuming Dong et al. Life (Basel). .

Abstract

Background: Previous studies have associated slowed ventricular conduction with the arrhythmogenesis mediated by the gap junction and sodium channel inhibitor heptanol in mouse hearts. However, they did not study the propagation patterns that might contribute to the arrhythmic substrate. This study used a multi-electrode array mapping technique to further investigate different conduction abnormalities in Langendorff-perfused mouse hearts exposed to 0.1 or 2 mM heptanol. Methods: Recordings were made from the left ventricular epicardium using multi-electrode arrays in spontaneously beating hearts during right ventricular 8 Hz pacing or S1S2 pacing. Results: In spontaneously beating hearts, heptanol at 0.1 and 2 mM significantly reduced the heart rate from 314 ± 25 to 189 ± 24 and 157 ± 7 bpm, respectively (ANOVA, p < 0.05 and p < 0.001). During regular 8 Hz pacing, the mean LATs were increased by 0.1 and 2 mM heptanol from 7.1 ± 2.2 ms to 19.9 ± 5.0 ms (p < 0.05) and 18.4 ± 5.7 ms (p < 0.05). The standard deviation of the mean LATs was increased from 2.5 ± 0.8 ms to 10.3 ± 4.0 ms and 8.0 ± 2.5 ms (p < 0.05), and the median of phase differences was increased from 1.7 ± 1.1 ms to 13.9 ± 7.8 ms and 12.1 ± 5.0 ms by 0.1 and 2 mM heptanol (p < 0.05). P5 took a value of 0.2 ± 0.1 ms and was not significantly altered by heptanol at 0.1 or 2 mM (1.1 ± 0.9 ms and 0.9 ± 0.5 ms, p > 0.05). P50 was increased from 7.3 ± 2.7 ms to 24.0 ± 12.0 ms by 0.1 mM heptanol and then to 22.5 ± 7.5 ms by 2 mM heptanol (p < 0.05). P95 was increased from 1.7 ± 1.1 ms to 13.9 ± 7.8 ms by 0.1 mM heptanol and to 12.1 ± 5.0 ms by 2 mM heptanol (p < 0.05). These changes led to increases in the absolute inhomogeneity in conduction (P5−95) from 7.1 ± 2.6 ms to 31.4 ± 11.3 ms, 2 mM: 21.6 ± 7.2 ms, respectively (p < 0.05). The inhomogeneity index (P5−95/P50) was significantly reduced from 3.7 ± 1.2 to 3.1 ± 0.8 by 0.1 mM and then to 3.3 ± 0.9 by 2 mM heptanol (p < 0.05). Conclusion: Increased activation latencies, reduced CVs, and the increased inhomogeneity index of conduction were associated with both spontaneous and induced ventricular arrhythmias.

Keywords: action potential duration; conduction; detrended fluctuation analysis; dispersion; entropy; heptanol; heterogeneity; hypokalemia; inhomogeneity; mouse; variability.


Conflict of interest statement

The authors declare no conflict of interest.

Figures

Figure 1
Figure 1
A cartoon of 64-channel multi-electrode array arranged in an 8 × 8 grid. Figure reproduced from MappingLab with permission.
Figure 2
Figure 2
Representative biphasic electrograms obtained from spontaneously beating hearts under control conditions (top) and in the presence of 0.1 mM (middle) or 2 mM heptanol (bottom).
Figure 3
Figure 3
Representative biphasic electrograms from a single channel (A) and corresponding activation maps (B) obtained from spontaneously beating hearts under control conditions and in the presence of 0.1 mM. Representative biphasic electrograms from a single channel (C) and corresponding activation maps (D) obtained from spontaneously beating hearts under control conditions and in the presence of 2 mM. There was a dose-dependent reduction in heart rate as heptanol concentration increased (E). * p < 0.05, *** p < 0.001. Data from n = 5 hearts. Differences between groups were tested using ANOVA followed by Tukey’s honestly significant difference test.
Figure 4
Figure 4
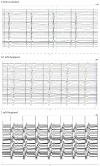
Representative biphasic electrograms obtained during 8 Hz pacing under control conditions (top) and in the presence of 0.1 mM (middle) or 2 mM heptanol (bottom).
Figure 5
Figure 5
Representative biphasic electrograms (A) and corresponding activation maps (B) from a single channel obtained during 8 Hz pacing under control conditions and in the presence of 0.1 mM. Representative biphasic electrograms (C) and corresponding activation maps (D) from a single channel obtained during 8 Hz pacing under control conditions and in the presence of 2 mM.
Figure 6
Figure 6
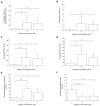
Mean local activation time (LAT) (A), standard deviation of mean LATs (B), median of phase differences (C), P5 (D), P50 (E), P95 (F), absolute inhomogeneity (P5–95, (G)), and inhomogeneity index (P5–95/P50, (H)) obtained during 8 Hz pacing before and after introduction of 0.1 mM or 2 mM heptanol. Data from n = 5 hearts. Differences between groups were tested using ANOVA followed by Tukey’s honestly significant difference test. * indicates p < 0.05.
Figure 7
Figure 7
Normalized median of phase differences (A), P5 (B), P50 (C), P95 (D), absolute inhomogeneity (P5–95, (E)), and inhomogeneity index (P5–95/P50, (F)) obtained during 8 Hz pacing before and after introduction of 0.1 mM or 2 mM heptanol. Data from n = 5 hearts. Differences between groups were tested using ANOVA followed by Tukey’s honestly significant difference test. * indicates p < 0.05.

Similar articles

Cited by

References

    1. Antzelevitch C., Burashnikov A. Overview of Basic Mechanisms of Cardiac Arrhythmia. Card. Electrophysiol. Clin. 2011;3:23–45. doi: 10.1016/j.ccep.2010.10.012. - DOI - PMC - PubMed
    1. Kotadia I.D., Whitaker J., Roney C.H., Niederer S., O’Neill M., Bishop M. Anisotropic Cardiac Conduction. Arrhythmia Electrophysiol. Rev. 2020;9:202–210. doi: 10.15420/aer.2020.04. - DOI - PMC - PubMed
    1. Mirza M., Strunets A., Shen W.-K., Jahangir A. Mechanisms of arrhythmias and conduction disorders in older adults. Clin. Geriatr. Med. 2012;28:555–573. doi: 10.1016/j.cger.2012.08.005. - DOI - PMC - PubMed
    1. Tolppanen H., Siirila-Waris K., Harjola V.P., Marono D., Parenica J., Kreutzinger P., Nieminen T., Pavlusova M., Tarvasmaki T., Twerenbold R., et al. Ventricular conduction abnormalities as predictors of long-term survival in acute de novo and decompensated chronic heart failure. ESC Heart Fail. 2016;3:35–43. doi: 10.1002/ehf2.12068. - DOI - PMC - PubMed
    1. Tse G., Lai E.T., Tse V., Yeo J.M. Molecular and Electrophysiological Mechanisms Underlying Cardiac Arrhythmogenesis in Diabetes Mellitus. J. Diabetes Res. 2016;2016:2848759. doi: 10.1155/2016/2848759. - DOI - PMC - PubMed