. 2022 Jul 16;15(14):4962.
doi: 10.3390/ma15144962.

Application of Genetically Encoded Photoconvertible Protein SAASoti for the Study of Enzyme Activity in a Single Live Cell by Fluorescence Correlation Microscopy

Affiliations

Application of Genetically Encoded Photoconvertible Protein SAASoti for the Study of Enzyme Activity in a Single Live Cell by Fluorescence Correlation Microscopy

Ilya D Solovyev et al. Materials (Basel). .

Abstract

Fluorescent Correlation Spectroscopy (FCS) allows us to determine interactions of labeled proteins or changes in the oligomeric state. The FCS method needs a low amount of fluorescent dye, near nanomolar concentrations. To control the amount of fluorescent dye, we used new photoconvertible FP SAASoti. This work is devoted to the proof of principle of using photoconvertible proteins to measure caspase enzymatic activity in a single live cell. The advantage of this approach is that partial photoconversion of the FP makes FCS measurements possible when studying enzymatic reactions. To investigate the process, in vivo we used HeLa cell line expressing the engineered FRET sensor, SAASoti-23-KFP. This FRET sensor has a cleavable (DEVD) sequence in the linker between two FPs for the detection of one of the key enzymes of apoptosis, caspase-3. Caspase-3 activity was detected by registering the increase in the fluorescent lifetimes of the sensor, whereas the diffusion coefficient of SAASoti decreased. This can be explained by an increase in the total cell viscosity during apoptosis. We can suppose that in the moment of detectible caspase-3 activity, cell structure already has crucial changes in viscosity.

Keywords: FCS; FLIM; FRET sensor; caspase; photoconvertible FP; single cell.


Conflict of interest statement

The authors declare no conflict of interest. The funders had no role in the design of the study; in the collection, analyses, or interpretation of data; in the writing of the manuscript, or in the decision to publish the results.

Figures

Figure 1
Figure 1
An autocorrelation curve for a triplet model for red SAASoti.
Figure 2
Figure 2
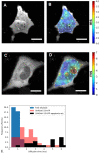
The left panels (A,C) are fluorescence images of HeLa cells transfected with (A) free SAASoti and (C) SAASoti-23-KFP in the red channel. The right panels (B,D) are images of the diffusion time distributions of the SAASoti red form in the cell. The color corresponds to the value of the diffusion time according to the scale to the right of the images in milliseconds. Images are 80 × 80 microns in size. (E) Points diagram distribution from (0.5 ms bining) for free SAASOti (B), SAASOti-23-KFP (D), and SAASOti-23-KFP 2 h after induction of apoptosis by staurosporine (Figure 3D). Scale bar = 20 μm.
Figure 3
Figure 3
FLIM images of a HeLa cell transfected with a SAASoti-23-KFP sensor, (A) right after staurosporine and (B) after 2 h of incubation with staurosporine. (C) The distribution of the average fluorescence lifetimes is blue before and red after the induction of apoptosis for the whole frame (cell). (D) Diffusion time distribution image after 2 h of incubation with staurosporine. Images were acquired using a Microtime 200 confocal system (PicoQuant), excitation at 395/20 nm (red form generation), and 532 nm laser (red form excitation); emission was registered in the red channel. Scale bar = 20 μm.
Figure 4
Figure 4
Distribution of average lifetimes with diffusion times in the range of 1–3 ms (6 points, blue) and 5–7 ms (8 points, red) in the vicinity of ±3 pixels of the FCS measurement points. Left—at the time of the addition of staurosporine; right—2 h after the addition of staurosporine.

References

    1. Chalfie M., Tu Y., Euskirchen G., Ward W.W., Prasher D.C. Green fluorescent protein as amarker for gene expression. Science. 1994;263:802–805. doi: 10.1126/science.8303295. - DOI - PubMed
    1. Tsien R.Y. The green fluorescent protein. Annu. Rev. Biochem. 1998;67:509–544. doi: 10.1146/annurev.biochem.67.1.509. - DOI - PubMed
    1. Matz M.V., Fradkov A.F., Labas Y.A., Savitsky A.P., Zaraisky A.G., Markelov M.L., Lukyanov S.A. Fluorescent Proteins from Nonbioluminescent Anthozoa Species. Nat. Biotechnol. 1999;17:969–973. doi: 10.1038/13657. - DOI - PubMed
    1. Germond A., Fujita H., Ichimura T., Watanabe T.M. Design and development of genetically encoded fluorescent sensors to monitor intracellular chemical and physical parameters. Biophys. Rev. 2016;8:121–138. doi: 10.1007/s12551-016-0195-9. - DOI - PMC - PubMed
    1. Terry B.R., Matthews E.K., Haseloff J. Molecular Characterization of Recombinant Green Fluorescent Protein by Fluorescence Correlation Microscopy. Biochem. Biophys. Res. Commun. 1995;217:21–27. doi: 10.1006/bbrc.1995.2740. - DOI - PubMed