. 2022 Jun 29;12(7):604.
doi: 10.3390/metabo12070604.

Whole Exome Sequencing Enhanced Imputation Identifies 85 Metabolite Associations in the Alpine CHRIS Cohort

Affiliations

Whole Exome Sequencing Enhanced Imputation Identifies 85 Metabolite Associations in the Alpine CHRIS Cohort

Eva König et al. Metabolites. .

Abstract

Metabolites are intermediates or end products of biochemical processes involved in both health and disease. Here, we take advantage of the well-characterized Cooperative Health Research in South Tyrol (CHRIS) study to perform an exome-wide association study (ExWAS) on absolute concentrations of 175 metabolites in 3294 individuals. To increase power, we imputed the identified variants into an additional 2211 genotyped individuals of CHRIS. In the resulting dataset of 5505 individuals, we identified 85 single-variant genetic associations, of which 39 have not been reported previously. Fifteen associations emerged at ten variants with >5-fold enrichment in CHRIS compared to non-Finnish Europeans reported in the gnomAD database. For example, the CHRIS-enriched ETFDH stop gain variant p.Trp286Ter (rs1235904433-hexanoylcarnitine) and the MCCC2 stop lost variant p.Ter564GlnextTer3 (rs751970792-carnitine) have been found in patients with glutaric acidemia type II and 3-methylcrotonylglycinuria, respectively, but the loci have not been associated with the respective metabolites in a genome-wide association study (GWAS) previously. We further identified three gene-trait associations, where multiple rare variants contribute to the signal. These results not only provide further evidence for previously described associations, but also describe novel genes and mechanisms for diseases and disease-related traits.

Keywords: ExWAS; GWAS; association study; imputation; metabolomics; whole-exome sequencing.


Conflict of interest statement

A.L. is currently employed by and holds stock in Regeneron Pharmaceuticals, though this work was initiated prior to employment and is unrelated. The authors declare no conflict of interest. The funders had no role in the design of the study; in the collection, analyses, or interpretation of data; in the writing of the manuscript, or in the decision to publish the results.

Figures

Figure 1
Figure 1
Flowchart of the study methods and summary of results.
Figure 2
Figure 2
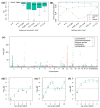
Main results of the metabolite ExWAS. (a) Squared correlation of imputed dosages and sequenced genotypes in 181 validation samples split into bins based on MAC or MAF in the reference panel. Number of variants included in the bins from left to right: 2–4: 1851; 5–9: 4412; 10–0.005 = 24,868; 0.005–0.01 = 24,232; 0.01–0.05 = 53,488; 0.05–0.1 = 19,669; 0.1–0.5 = 57,563. (b) Concordance of imputed and sequenced hard calls in 181 validation samples split into bins based on MAC and MAF in the reference panel. (c) Manhattan plot of the single-variant associations of all 175 traits. The 85 significant associations listed in Table S4 are highlighted and colored by metabolite class. The dashed horizontal line indicates the significance threshold of 5.5 × 10⁻⁹. (df) −log10 p-value of the skato gene test, adding the variants constituting the gene test iteratively for tryptophan—TDO2 (d), sphingomyeline C18:0—CERS4 (e), and carnitine—SLC22A5 (f). In each step i on the x-axis, the gene test is computed using only the i variants with the smallest single variant p-value. Below each point, the minor allele count of the added variant is given.
Figure 3
Figure 3
Variant enrichment in CHRIS compared to gnomAD. (a) Minor allele frequency (MAF) of matching variants in CHRIS and gnomAD for variants with a minor allele count greater zero in both cohorts are plotted in grey. For gnomAD the non-Finnish European (NFE) MAF is plotted using both exome and genome sequencing data. Variants with conditionally significant annotations in CHRIS are plotted in color, with variants enriched at least five-fold in CHRIS colored in green and labeled with gene—trait(s). (b) CHRIS MAF versus the absolute value of beta is plotted as grey points for all significant single variants. The conditionally significant associations listed in Table 1 are colored. For variants that existed in gnomAD, the gnomAD NFE MAF is plotted as triangles in green (>5 times enriched) or purple (<5 times or not enriched) and connected for visibility. For variants that did not exist in gnomAD or had an allele count of zero, only the CHRIS MAF is plotted in orange. Associations from Table 1 with an absolute beta value greater than one are annotated with gene—trait(s).
Figure 4
Figure 4
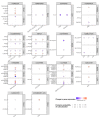
Results of the colocalization analysis. For each index variant with at least one gene colocalized at a posterior probability (PP) ≥ 0.8 in at least one of the three tissues whole blood (Blood), kidney cortex (Kidney), or liver (Liver), colocalization data of all protein coding genes and traits with PP ≥ 0.3 are displayed. The colors represent the change in gene expression relative to an increase in the colocalized metabolite level.

References

    1. Kastenmüller G., Raffler J., Gieger C., Suhre K. Genetics of human metabolism: An update. Hum. Mol. Genet. 2015;24:R93–R101. doi: 10.1093/hmg/ddv263. - DOI - PMC - PubMed
    1. Johnson C.H., Ivanisevic J., Siuzdak G. Metabolomics: Beyond biomarkers and towards Mechanisms. Nat. Rev. Mol. Cell Biol. 2016;17:451–459. doi: 10.1038/nrm.2016.25. - DOI - PMC - PubMed
    1. Aderemi A.V., Ayeleso A.O., Oyedapo O.O., Mukwevho E. Metabolomics: A scoping review of its role as a tool for disease biomarker discovery in selected non-communicable diseases. Metabolites. 2021;11:418. doi: 10.3390/metabo11070418. - DOI - PMC - PubMed
    1. Hagenbeek F.A., Pool R., van Dongen J., Draisma H.H.M., Jan Hottenga J., Willemsen G., Abdellaoui A., Fedko I.O., den Braber A., Visser P.J., et al. Heritability estimates for 361 blood metabolites across 40 genome-wide association studies. Nat. Commun. 2020;11:39. doi: 10.1038/s41467-019-13770-6. - DOI - PMC - PubMed
    1. Hysi P.G., Mangino M., Christofidou P., Falchi M., Karoly E.D., NIHR Bioresource Investigators. Mohney R.P., Valdes A.M., Spector T.D., Menni C. Metabolome genome-wide association study identifies 74 novel genomic regions influencing plasma metabolites levels. Metabolites. 2022;12:61. doi: 10.3390/metabo12010061. - DOI - PMC - PubMed

LinkOut - more resources