. 2022 Jul 18;12(7):660.
doi: 10.3390/metabo12070660.

Long-Term Mastication Changed Salivary Metabolomic Profiles

Affiliations

Long-Term Mastication Changed Salivary Metabolomic Profiles

Yoji Saeki et al. Metabolites. .

Abstract

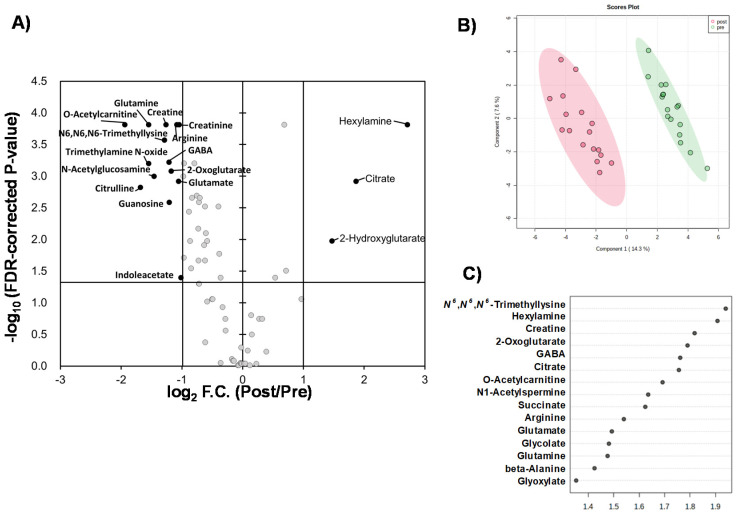
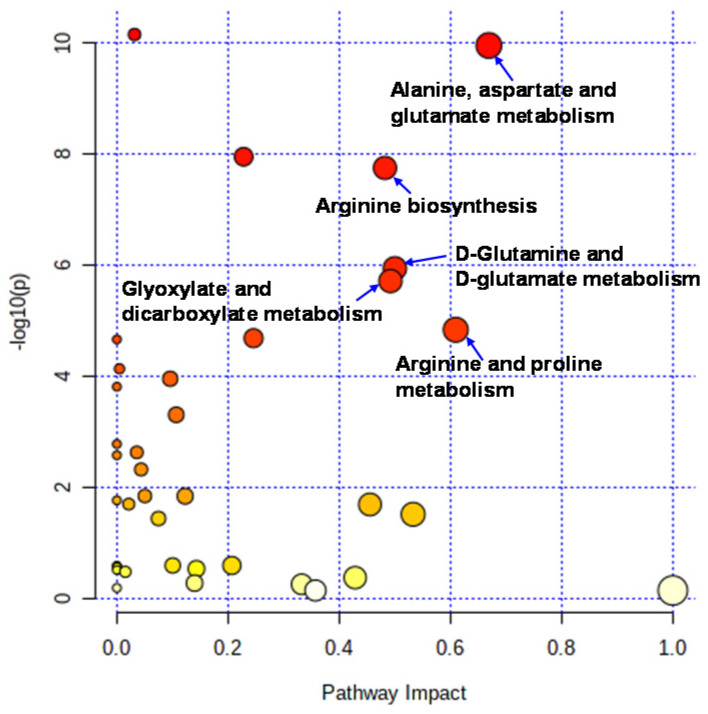
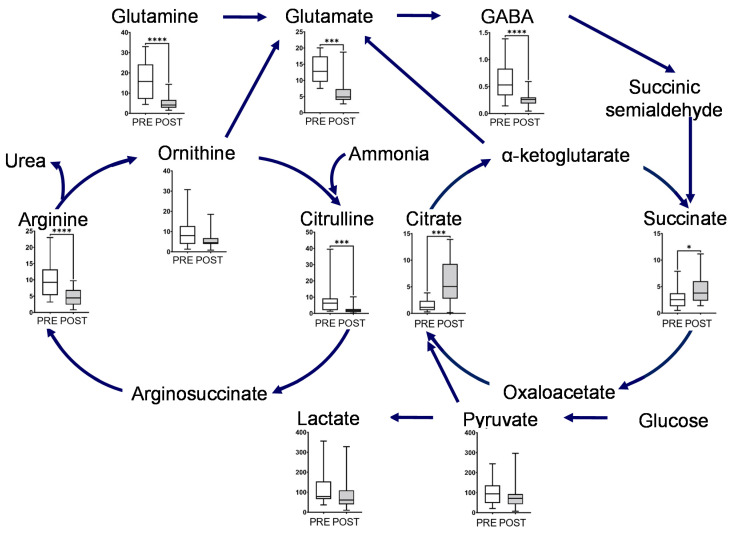
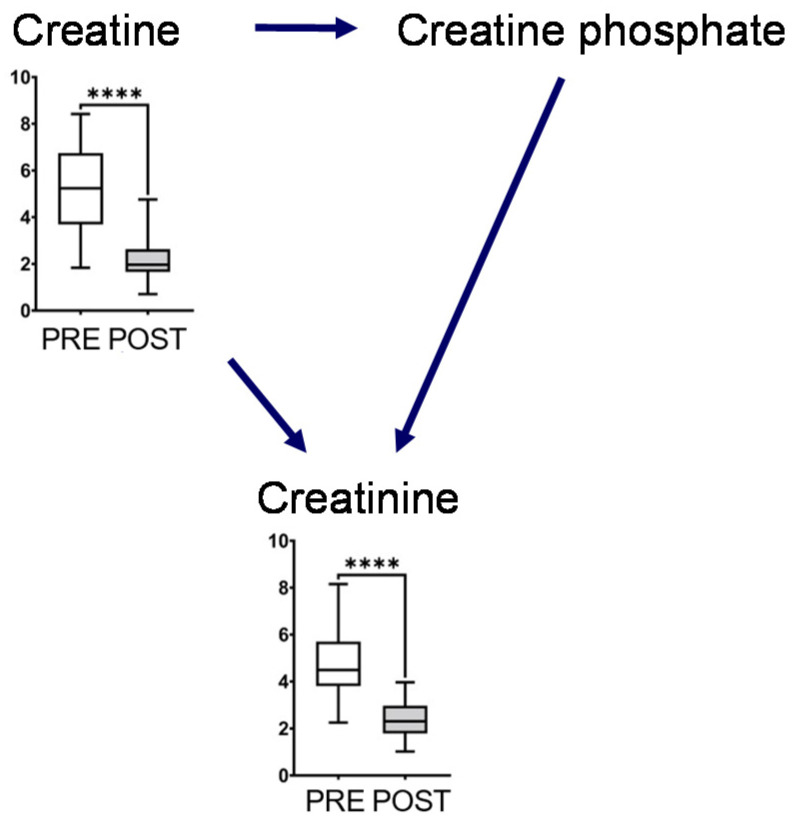
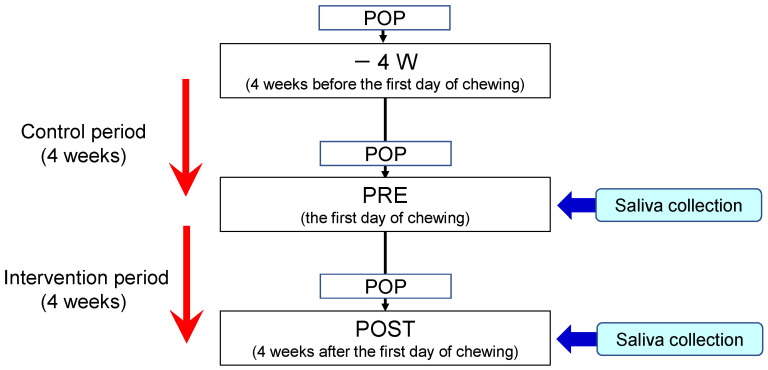
Saliva is an ideal biofluid for monitoring oral and systemic health. Repeated mastication is a typical physical stimulus that improves salivary flow and oral hygiene. Recent metabolomic studies have shown the potential of salivary metabolomic components for various disease monitoring systems. Here, we evaluated the effect of long-term mastication on salivary metabolomic profiles. Young women with good oral hygiene (20.8 ± 0.3 years, n = 17) participated. They were prohibited from chewing gum during control periods (4 weeks each) and were instructed to chew a piece of gum base seven times a day for 10 min each time during the intervention period. Paired samples of unstimulated whole saliva collected on the last day of the control and intervention period were compared. Liquid chromatography−time-of-flight mass spectrometry successfully quantified 85 metabolites, of which 41 showed significant differences (p < 0.05, Wilcoxon paired test corrected by false discovery rate). Except for a few metabolites, such as citrate, most metabolites showed lower concentrations after the intervention. The pathways related to glycogenic amino acids, such as alanine, arginine, and glutamine, altered considerably. This study suggests that long-term mastication induces unstimulated salivary component-level changes.

Keywords: chewing; liquid chromatography–mass spectrometry; mastication; metabolomic profile; saliva.


Conflict of interest statement

This study was conducted with an appropriate joint research fund of Lotte Co., Ltd. Yoji Saeki and Minji Kim are basic researchers of Central Laboratory, Lotte Co., Ltd., and declare a conflict of interest. The other authors declare no conflict of interest.

Figures

Figure 1
Figure 1
Comparisons of quantified metabolites. (A) Volcano plot. The X-axis indicates log2-fold change (FC) of metabolite concentrations in PRE sample divided by those of POST sample. Vertical bars indicate FC = 0.5 and 2.0. The Y-axis indicates −log10 (FDR-corrected p-value). The horizontal bar indicates FDR-corrected p = 0.05. (B) Score plots of PLS-DA. X and Y axes indicate the 1st and 2nd components. The R2 and Q2 values are 0.968 and 0.856 (average of 5 times of 7-fold cross-validation), respectively, with two components. Quantile normalization of each sample was conducted, and subsequently, metabolite concentration was normalized by autoscaling to eliminate sample-dependent bias. One plot indicates one sample of PRE (red) and POST (green). The light circles indicate 95% confidential intervals. (C) Variable importance in projection (VIP) showing top 15 metabolites. One plot indicates a metabolite. The right box indicates the higher or lower average concentrations of 0 W and 4 W.
Figure 2
Figure 2
Pathways analysis. Pathway analysis was conducted to evaluate the pathway-level change between PRE and POST. The X-axis indicates pathway impacts. The Y-axis indicated −log10(P) of each pathway.
Figure 3
Figure 3
Box plot of metabolite concentration of individual pathways. Urea and glutamate cycle, TCA cycles, and glycolytic pathway. The horizontal bars of the box plots indicate the maximum, 75%, 50%, 25%, and minimum values of the data. The Y-axis indicates concentration (μmol/L). FDR-corrected **** p < 0.0001, *** p < 0.001, and * p < 0.05 by the paired Wilcoxon test.
Figure 4
Figure 4
Creatine metabolism. The horizontal bars of the box plots indicate the maximum, 75%, 50%, 25%, and minimum values of the data. The Y-axis indicates concentration (μmol/L). FDR-corrected **** p < 0.0001 by the paired Wilcoxon test.
Figure 5
Figure 5
Experimental protocol. POP indicates professional oral prophylaxis.

References

    1. Dodds M.W., Johnson D.A., Yeh C.K. Health Benefits of Saliva: A Review. J. Dent. 2005;33:223–233. doi: 10.1016/j.jdent.2004.10.009. - DOI - PubMed
    1. Kaufman E., Lamster I.B. The Diagnostic Applications of Saliva—A Review. Crit. Rev. Oral Biol. Med. 2002;13:197–212. doi: 10.1177/154411130201300209. - DOI - PubMed
    1. Lee J.M., Garon E., Wong D.T. Salivary Diagnostics. Orthod. Craniofac. Res. 2009;12:206–211. doi: 10.1111/j.1601-6343.2009.01454.x. - DOI - PMC - PubMed
    1. Takenouchi A., Saeki Y., Otani E., Kim M., Fushimi A., Satoh Y., Kakegawa Y., Arai H., Taguchi N., Matsukubo T. Effects of Chewing Gum Base on Oral Hygiene and Mental Health: A Pilot Study. Bull. Tokyo Dent. Coll. 2021;62:7–14. doi: 10.2209/tdcpublication.2020-0009. - DOI - PubMed
    1. Srivastava S. Emerging Insights into the Metabolic Alterations in Aging Using Metabolomics. Metabolites. 2019;9:301. doi: 10.3390/metabo9120301. - DOI - PMC - PubMed

LinkOut - more resources