

A Continuous Microfluidic Concentrator for High-Sensitivity Detection of Bacteria in Water Sources
- PMID: 35888910
- PMCID: PMC9324615
- DOI: 10.3390/mi13071093
A Continuous Microfluidic Concentrator for High-Sensitivity Detection of Bacteria in Water Sources
Abstract
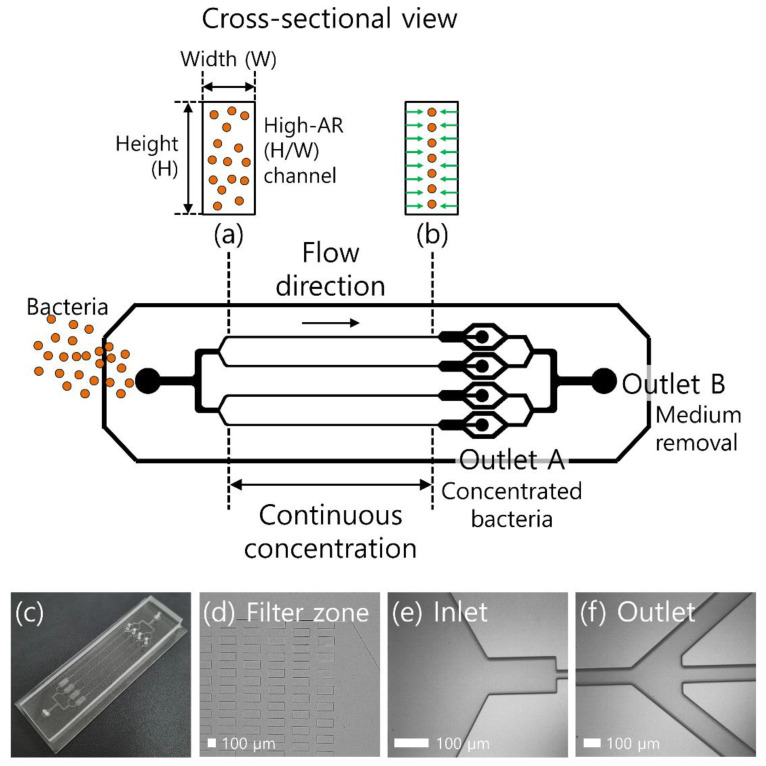
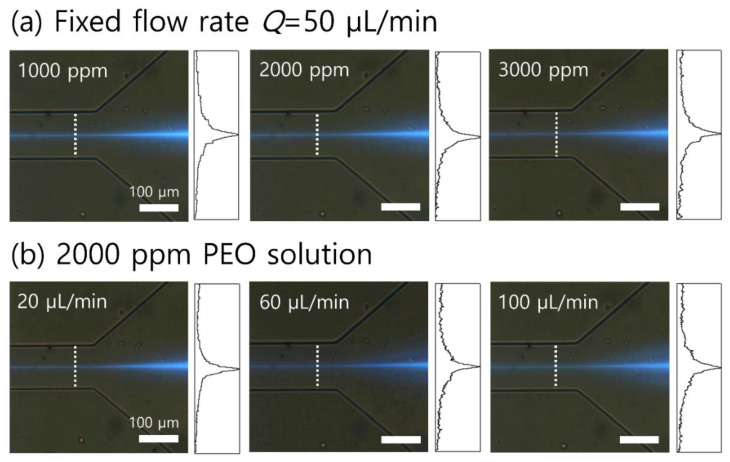
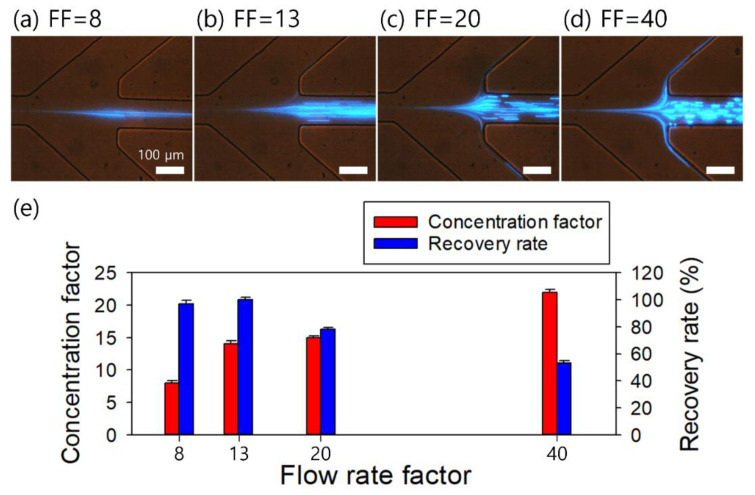
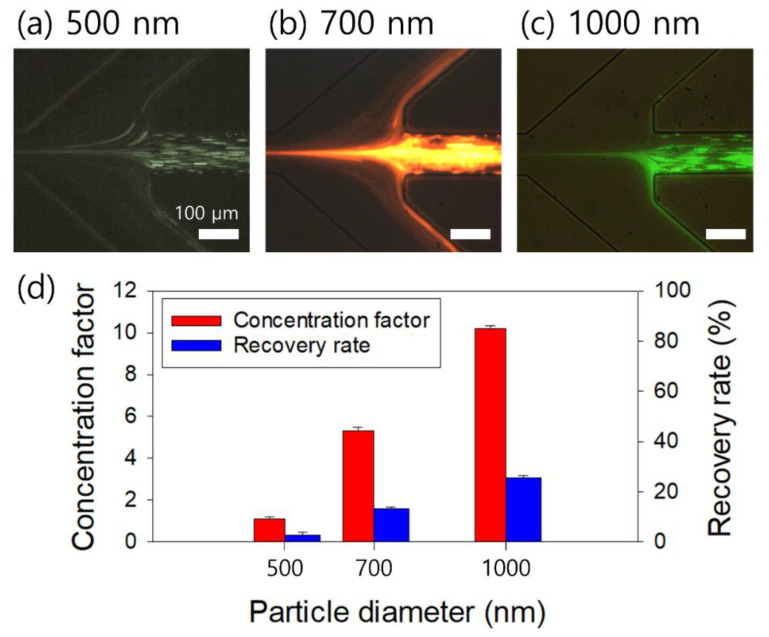
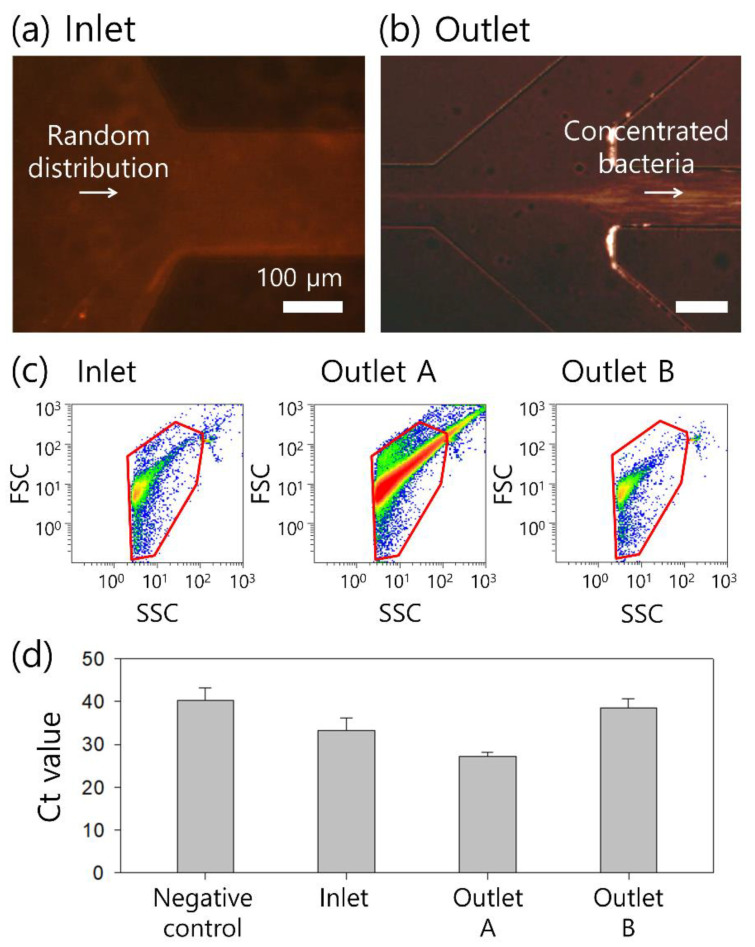
Water contamination is a critical issue that threatens global public health. To enable the rapid and precise monitoring of pathogen contamination in drinking water, a concentration technique for bacterial cells is required to address the limitations of current detection methods, including the culture method and polymerase chain reaction. Here we present a viscoelastic microfluidic device for the continuous concentration of bacterial cells. To validate the device performance for cell concentration, the flow characteristics of 2-μm particles were estimated in viscoelastic fluids at different concentrations and flow rates. Based on the particle flow distributions, the flow rate factor, which is defined as the ratio of the inlet flow rate to the outlet flow rate at the center outlet, was optimized to achieve highly concentrated bacterial cells by removal of the additional suspending medium. The flow characteristics of 0.5-, 0.7-, and 1.0-μm-diameter particles were evaluated to consider the effect of a wide spectrum of bacterial size distribution. Finally, the concentration factor of bacterial cells, Staphylococcus aureus, suspended in a 2000-ppm polyethylene oxide solution was found to be 20.6-fold at a flow rate of 20 μL/min and a flow rate factor of 40.
Keywords: bacteria; concentration; viscoelastic fluid; water contamination.
Conflict of interest statement
The authors declare no conflict of interest.
Figures
Similar articles
-
Viscoelastic Separation and Concentration of Fungi from Blood for Highly Sensitive Molecular Diagnostics.Sci Rep. 2019 Feb 28;9(1):3067. doi: 10.1038/s41598-019-39175-5. Sci Rep. 2019. PMID: 30816161 Free PMC article.
-
Separation and Washing of Candida Cells from White Blood Cells Using Viscoelastic Microfluidics.Micromachines (Basel). 2023 Mar 23;14(4):712. doi: 10.3390/mi14040712. Micromachines (Basel). 2023. PMID: 37420947 Free PMC article.
-
High throughput single-cell and multiple-cell micro-encapsulation.J Vis Exp. 2012 Jun 15;(64):e4096. doi: 10.3791/4096. J Vis Exp. 2012. PMID: 22733254 Free PMC article.
-
Recent advances in direct current electrokinetic manipulation of particles for microfluidic applications.Electrophoresis. 2019 Sep;40(18-19):2484-2513. doi: 10.1002/elps.201900048. Epub 2019 Mar 8. Electrophoresis. 2019. PMID: 30816561 Review.
-
Sources, pathways, and relative risks of contaminants in surface water and groundwater: a perspective prepared for the Walkerton inquiry.J Toxicol Environ Health A. 2002 Jan 11;65(1):1-142. doi: 10.1080/152873902753338572. J Toxicol Environ Health A. 2002. PMID: 11809004 Review.
Cited by
-
Continuous On-Chip Cell Washing Using Viscoelastic Microfluidics.Micromachines (Basel). 2023 Aug 25;14(9):1658. doi: 10.3390/mi14091658. Micromachines (Basel). 2023. PMID: 37763821 Free PMC article.
References
-
- Council C.C. Drinking Water Chlorination: A Review of Disinfection Practices and Issues. Chlorine Chemistry Council/American Chemistry Council; Arlington, VA, USA: 2003. p. 68.
Grants and funding
LinkOut - more resources
Full Text Sources
