. 2022 Jul 5;10(7):1356.
doi: 10.3390/microorganisms10071356.

Determining the International Spread of B.1.1.523 SARS-CoV-2 Lineage with a Set of Mutations Highly Associated with Reduced Immune Neutralization

Affiliations

Determining the International Spread of B.1.1.523 SARS-CoV-2 Lineage with a Set of Mutations Highly Associated with Reduced Immune Neutralization

Lukas Zemaitis et al. Microorganisms. .

Abstract

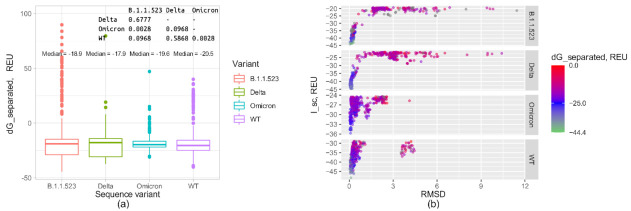
Here, we report the emergence of the variant lineage B.1.1.523 that contains a set of mutations including 156_158del, E484K and S494P in the spike protein. E484K and S494P are known to significantly reduce SARS-CoV-2 neutralization by convalescent and vaccinated sera and are considered as mutations of concern. Lineage B.1.1.523 presumably originated in the Russian Federation and spread across European countries with the peak of transmission in April-May 2021. The B.1.1.523 lineage has now been reported from 31 countries. In this article, we analyze the possible origin of this mutation subset and its immune response using in silico methods.

Keywords: B.1.1.523; GISAID; SARS-CoV-2; phylogeny; variant of concern (VOC).


Conflict of interest statement

The authors declare no conflict of interest.

Figures

Figure A1
Figure A1
The distribution of cases of the lineage B.1.1.523 and different haplotypes based on five positions across countries at different time points. The “0” time point indicates the date of the earliest lineage sequence uploaded onto the GISAID database. The haplotypes for 484,494,256,257,258 S protein positions are indicated in the gray background (“.”—wild type residue, “?”—undetermined haplotype). Only the cases of B.1.1.523 which correspond to the top 12 countries with the most abundant detection rates are included in the underlying data. The top 12 countries correspond to 93% of all cases.
Figure A2
Figure A2
WT Omicron Rosetta local docking results modelling escape effects of the d156_158 mutation (B.1.1.523), del156_157&R158G mutations (Delta variant) and d130_d132&d56_57 mutations (Omicron) on NTD-directed neutralizing antibody 4–8 Fab [23,36]. (a) Complex formation energy represented by Rosetta dG_separation score of top scoring structures resulting from local docking. The p values for pairwise comparisons using Wilcoxon rank sum test with continuity correction are indicated in the top right corner. The p values were corrected for multiple comparisons using the Benjamini–Hochberg procedure. (b) RMSD values (comparing to the initial structure) and dG_separation scores for the 500 top scoring structures from the docking calculations (chosen out of 5000 based on the I_sc score).
Figure 1
Figure 1
Mutation overview in the B.1.1.523 lineage. Several other mutations have been observed in the spike-protein sequence of the B.1.1.523 variant, including E156V, F306L, D614G, E780A, D839V and T1027I.
Figure 2
Figure 2
The overlap between the two data sets used for the focused ML tree. The sequences were chosen either based on the Pango assignment or by identity with a B.1.1.523 lineage sequence (EPI_ISL_1590462). Most of the sequences with high identity (>0.993) to the Latvian B.1.1.523 lineage were classified as belonging to B.1.1.523. However, 21 sequences (6%) were not assigned to B.1.1.523.
Figure 3
Figure 3
Phylogeny based on S protein sequence. The color of the dots denoting inner nodes depicts the bootstrap values. (a) The tree represents a maximum likelihood tree based on all unique S protein sequences of the genomes deposited into GISAID. The visible subset of the tree matches lineages that lead to branches which have 156_158del and E484K or S494P mutations. The arrow “->” indicates haplotype transitions detected by comparing parental sequences with their offspring variants. The five-letter haplotype strings match 156, 157, 158, 484 and 494 positions of the S protein with “.”, meaning the wild type. The pink squares and the labels in red indicate prominent transitions discussed in the main text. (b) The lower tree matches the maximum likelihood tree based on whole genomes of the cases visualized in the upper tree. The black solid lines indicate a match of nodes for two B.1.1.523 sequences from Turkey in the phylogenies based on the S protein and whole genome.
Figure 4
Figure 4
S protein region of B.1.1.523 sequences from Turkey. Turkey/HSGM-B11599/2021 and Turkey/HSGM-B11931/2021 were classified by Pango as belonging to the B.1.1.523 lineage. The top figure is a snapshot from the Nextclade analysis. The top sequence is the reference sequence hCoV-19 used by GISAID. The asterisks ** indicate a sequence from Turkish variants that have their two most variable sequences manually swapped with corresponding regions from the reference sequence. The two lower graphs indicate the sequence alignments from the two extremely variable fragments. The order of sequences is the same as in the upper graph: reference sequence, three Turkish sequences with swapped fragments and three original Turkish sequences.
Figure 5
Figure 5
Phylogeny based on S protein sequence with modified sequences from Turkey. The cladogram of the maximum likelihood tree includes the three pairs of Turkish sequences with their variable regions either swapped with counterparts of reference sequences or left as original. The color of the tips of leaves indicates if they are classified as B.1.1.523. Tip labels indicate their Pango assignment with colors indicating different lineages. The different tips connecting grey lines indicate a Turkish sequence. The asterisks (“**”) in front of the sequence name labels indicate the sequence variant where the variable regions were swapped with corresponding regions from the reference sequences. Next to the sequence labels, the haplotype at positions 156–158,484,494 with “.” indicates the wild type and “-” a gap.
Figure 6
Figure 6
The distribution of cases of the lineage B.1.1.523 across countries at different time points. The “0” time point indicates the date of the earliest lineage sequence uploaded onto the GISAID database. Only sequences that have the typical set of S mutations were considered (E484K, S494P, 156_158del). Only the cases which correspond to the top 12 countries with the most abundant detection rate are included in the underlying data. The top 12 countries correspond to 93% of all cases.
Figure 7
Figure 7
B.1.1.523 Transmission clusters. Sequences with identity larger or equal to 99.3% of the Latvian B.1.1.523 sequence (EPI_ISL_1590462) were used for the analysis. (a) The plot indicates the number of cases where the assigned country to a node of the most recent common ancestor (MRCA) of a cluster is different from a sequence that belongs to the cluster. The arrow starts at a country name that matches a MRCA node of clusters (origin) and it points to a country matching a country of a leaf (destination). The color of the edges denote median values of the ultrafast boot strap approximation values for the corresponding MRCA node. (b) The corresponding Stankey diagram of visualizes cases with the same origin and destination.
Figure 8
Figure 8
Newly sequenced cases of B.1.1.523 and Delta lineages (B.1.617.2) in Germany. The data number of new cases per month and lineage assignments are based on GISAID metadata (parsed on 20 May 2022). Counts represent number counts per month based on the date attribute of the GISAID data. Only sequences defined to a day value in the date were considered.
Figure 9
Figure 9
Escape effects of the d156_158 mutation (B.1.1.523), del156_157&R158G mutations (Delta variant), and d130_d132&d56_57 mutations (Omicron) on NTD-directed neutralizing antibody 4–8 Fab [23,36]. (a) Complex formation energy predicted by PRODIGY [27] based on top scoring structures resulting from local docking. For all possible pairs of sequence variants, p values for pairwise comparisons using Wilcoxon rank sum test with continuity correction were <2 × 10⁻¹⁶. The p values were corrected for multiple comparisons using the Benjamini–Hochberg procedure. (b) HADDOCK docking scores in arbitrary units (a.u) for the mutants and the wild type complexes. The error bars represent the standard deviation.
Figure 10
Figure 10
Escape effects of the E484 and S494P mutations and their combination. (a) The distribution of relative ∆∆∆G values based on FoldX calculations using available S protein—antibodies crystal structures. The ∆∆G values indicate a relative increase in binding energy compared with the wild type structure for a particular mutation or set of mutations. The ∆∆∆G indicates the minimum difference between the ∆∆G of the double mutation and any of the two single point mutations. The larger the value, the larger the synergy in evading interaction with the antibody. If a complex’s ∆∆∆G was greater than 15%, its label is given containing the name followed by the corresponding value of ∆∆∆G. (b) The structure of an antibody and receptor binding domain of the S protein complex (PDB ID: 6YZ5 that was highly impacted by the double mutation [38]. The green color depicts the S protein, cyan color—antibody chain. Sticks depict the E484 and S494 residues together with residues that form polar contacts with E484 or S494. The polar contacts are depicted by yellow dashes.

References

    1. World Health Organisation WHO Coronavirus (COVID-19) Dashboard. [(accessed on 1 October 2021)]. Available online: https://covid19.who.int/
    1. Wu F., Zhao S., Yu B., Chen Y.M., Wang W., Song Z.G., Hu Y., Tao Z.W., Tian J.H., Pei Y.Y., et al. A new coronavirus associated with human respiratory disease in China. Nature. 2020;579:265–269. doi: 10.1038/s41586-020-2008-3. - DOI - PMC - PubMed
    1. European Centre for Disease Prevention and Control How ECDC Collects and Processes COVID-19 Data. [(accessed on 1 October 2021)]. Available online: https://www.ecdc.europa.eu/en/covid-19/data-collection.
    1. Yuelong S., John M. GISAID: Global initiative on sharing all influenza data—From vision to reality. Eurosurveillance. 2017;22:30494. doi: 10.2807/1560-7917.ES.2017.22.13.30494. - DOI - PMC - PubMed
    1. World Health Organisation Tracking SARS-CoV-2 Variants. [(accessed on 1 October 2021)]. Available online: https://www.who.int/en/activities/tracking-SARS-CoV-2-variants/

LinkOut - more resources