. 2022 Jul 11;12(14):2372.
doi: 10.3390/nano12142372.

Graphene Oxide Nanoplatforms to Enhance Cisplatin-Based Drug Delivery in Anticancer Therapy

Affiliations

Graphene Oxide Nanoplatforms to Enhance Cisplatin-Based Drug Delivery in Anticancer Therapy

Elena Giusto et al. Nanomaterials (Basel). .

Abstract

Chemotherapeutics such as platinum-based drugs are commonly used to treat several cancer types, but unfortunately, their use is limited by several side effects, such as high degradation of the drug before entering the cells, off-target organ toxicity and development of drug resistance. An interesting strategy to overcome such limitations is the development of nanocarriers that could enhance cellular accumulation in target cells in addition to decreasing associated drug toxicity in normal cells. Here, we aim to prepare and characterize a graphene-oxide-based 2D nanoplatform functionalised using highly branched, eight-arm polyethylene-glycol, which, owing to its high number of available functional groups, offers considerable loading capacity over its linear modalities and represents a highly potent nanodelivery platform as a versatile system in cancer therapy. The obtained results show that the GO@PEG carrier allows for the use of lower amounts of Pt drug compared to a Pt-free complex while achieving similar effects. The nanoplatform accomplishes very good cellular proliferation inhibition in osteosarcoma, which is strictly related to increased cellular uptake. This enhanced cellular internalization is also observed in glioblastoma, although it is less pronounced due to differences in metabolism compared to osteosarcoma. The proposed GO@PEG nanoplatform is also promising for the inhibition of migration, especially in highly invasive breast carcinoma (i.e., MDA-MB-231 cell line), neutralizing the metastatic process. The GO@PEG nanoplatform thus represents an interesting tool in cancer treatment that can be specifically tailored to target different cancers.

Keywords: breast cancer; drug delivery systems; glioblastoma; graphene oxide; nanomaterials; nanomedicine; osteosarcoma; platinum-based drug.


Conflict of interest statement

The authors declare no conflict of interest.

Figures

Figure 1
Figure 1
Pt-based drugs. Cisplatin, carboplatin and oxaliplatin.
Figure 2
Figure 2
Chemical structure of Compound 1 (Pt-free).
Figure 3
Figure 3
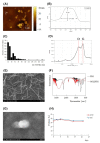
Characterization of GO-based nanoplatforms. (A) AFM image of PEGylated GO flakes. (B) Height profile was determined for marked GO flakes. (C) Size distribution of GO flakes in supernatant and typical D and G bands of GO are shown by the Raman spectrum (D). (E) Scanning electron microscopy images (SEM) of graphene oxide in stock solution and the presence of PEG in the sample with GO are demonstrated by IR spectra (F). (H) Successfully PEGylated GO flakes are displayed by SEM (G). Release kinetics of Pt-loaded GO@PEG at 4 °C and 23 °C (n = 3).
Figure 4
Figure 4
Cell viability and morphological analysis in osteosarcoma cell lines. An MTT assay was performed after 72 h of cell culture. The data show the percentage of viable cells compared to cells alone as the control, and the mean ± standard error of the mean is presented. The graphs show the viability of the U2-OS cell line (A), the MG63 cell line (B), the SAOS-2 cell line (C) and the respective morphological images of the cells cultured for 72 h in the presence of the 30 mM concentration. Phalloidin red stains for actin filaments, and DAPI blue stains for cell nuclei (D). Scale bars: 100 µm. (* p-value ≤ 0.05; *** p-value ≤ 0.001; **** p-value ≤ 0.0001). Significant differences between GO@PEG and the other compounds are reported in the graph as follows: a: GO@PEG vs. Pt-free; p-value ≤ 0.01 and GO@PEG vs. GO@PEG-Pt p-value ≤ 0.001 in U2-OS; GO@PEG vs. Pt-free p-value ≤ 0.01 and GO@PEG vs GO@PEG-Pt p-value ≤ 0.0001 in MG63; GO@PEG vs. Pt-free p-value ≤ 0.05 and GO@PEG vs GO@PEG-Pt p-value ≤ 0.001 in SAOS-2. b and F: GO@PEG vs Pt-free and GO@PEG vs. GO@PEG-Pt both p-value ≤ 0.0001 in all cell lines.
Figure 5
Figure 5
Cell viability and morphological analysis in glioblastoma cell lines. An MTT assay was performed after 72 h of cell culture. The data show the percentage of viable cells compared to cells alone as the control, and the mean ± standard error of the mean is presented. The graphs show the viability of the U87 cell line (A), the U118 cell line (B) and the respective morphological images of the cells cultured for 72 h in the presence of the 30 mM concentration. Phalloidin red stains for actin filaments, and DAPI blue stains for cell nuclei (C). Scale bars: 100 µm. (* p-value ≤ 0.05; ** p-value ≤ 0.01). Significant differences between GO@PEG and the other compounds are reported in the graph as follows, a: GO@PEG vs. Pt-free p-value ≤ 0.01 in U87; GO@PEG vs. GO@PEG-Pt p-value ≤ 0.05 in U118. b: GO@PEG vs. Pt-free p-value ≤ 0.0001 and GO@PEG vs. GO@PEG-Pt p-value ≤ 0.01 in U87, GO@PEG vs. Pt-free p-value ≤ 0.01 and GO@PEG vs. GO@PEG-Pt p-value ≤ 0.0001 in U118. F: GO@PEG vs. Pt-free p-value ≤ 0.0001 and GO@PEG vs. GO@PEG-Pt p-value ≤ 0.001 in U87, GO@PEG vs. Pt-free p-value ≤ 0.0001 and GO@PEG vs. GO@PEG-Pt p-value ≤ 0.0001 in U118.
Figure 6
Figure 6
Cell viability and morphological analysis in breast adenocarcinoma cell lines. An MTT assay was performed after 72 h of cell culture. The data show the percentage of viable cells compared to cells alone as the control, and the mean ± standard error of the mean is presented. The graphs show the viability of the MDA-MB-231 cell line (A), the MDA-MB 468 cell line (B) and the respective morphological images of the cells cultured for 72 h in the presence of the 30 mM concentration. Phalloidin red stains for actin filaments, and DAPI blue stains for cell nuclei (C). Scale bars: 100 µm. (* p-value ≤ 0.05, *** p-value ≤ 0.001). Significant differences between GO@PEG and the other compounds are reported in the graph as follows, a: GO@PEG vs. GO@PEG-Pt p-value ≤ 0.05 in MDA-MB 468. b: GO@PEG vs. Pt-free p-value ≤ 0.01 and GO@PEG vs. GO@PEG-Pt p-value ≤ 0.0001 in MDA-MB 468. F: GO@PEG vs. Pt-free p-value ≤ 0.001 in MDA-MB 231, GO@PEG vs. Pt-free and GO@PEG vs. GO@PEG-Pt both p-value ≤ 0.0001 in MDA-MB 468.
Figure 7
Figure 7
Human osteosarcoma cell lines: ICP-OES on U2-OS (A), MG63 (B) and SAOS-2 (C). Scratch test on U2-OS (D), MG63 (E) and SAOS-2 (F). α: Pt-free vs. cells only and GO@PEG-Pt vs. cells only, both p values ≤ 0.0001 in U2-OS; Pt-free vs. cells only. p value ≤ 0.0001 in SAOS-2. β: Pt-free vs. cells only and GO@PEG-Pt vs. cells only, both p values ≤ 0.0001 in U2-OS; Pt-free vs. cells only, p value ≤ 0.01, and GO@PEG-Pt vs. cells only, p value ≤ 0.0001 in MG63; Pt-free vs. cells only and GO@PEG-Pt vs. cells only, both p values ≤ 0.0001 in SAOS-2. φ: Pt-free vs. cells only and GO@PEG-Pt vs. cells only both, p value ≤ 0.0001 in U2-OS, MG63 and SAOS-2. Significant differences between Pt-free and GO@PEG-Pt are reported in the graph as follows: * p-value ≤ 0.05, *** p-value ≤ 0.001, **** p-value ≤ 0.0001. Representative DAPI staining of scratch test on MG63 cells (G) cells. Scale bars = 500 µm. Cell nuclei are indicated in blue.
Figure 8
Figure 8
Human glioblastoma cell lines. ICP-OES on U87 (A) and U118 (B). Scratch test on U87 (C) and U118 (D); α: Pt-free vs. cells alone, p value ≤ 0.05, and GO@PEG-Pt vs. cells alone, p value ≤ 0.0001 for U87. β: Pt-free vs. cells alone, p value ≤ 0.0001, and GO@PEG-Pt vs. cells alone, p value ≤ 0.05 in U87; Pt-free vs. cells alone, p value ≤ 0.001, and GO@PEG-Pt vs. cells alone, p value ≤ 0.0001 in U118. φ: Pt-free vs. cells alone, p value ≤ 0.0001 in U87; Pt-free vs. cells alone, p value ≤ 0.001, and GO@PEG-Pt vs. cells alone, p value ≤ 0.0001 in U118. Significant differences between Pt-free and GO@PEG-Pt are reported in the graph as follows: * p-value ≤ 0.05, ** p-value ≤ 0.01, **** p-value ≤ 0.0001. Representative DAPI staining of scratch test on U118 cells (E). Scale bars = 500 µm. Cell nuclei are indicated in blue.
Figure 9
Figure 9
Human breast adenocarcinoma cell lines. ICP-OES on MDA-MB-231 (A) and MDA-MB-468 (B). Scratch test on MDA-MB-231 (C) and MDA-MB-468 (D); β: Pt-free vs. cells alone and GO@PEG-Pt vs. cells alone, both p values ≤ 0.0001 in MDA-MB 231. φ: Pt-free vs. cells alone and GO@PEG-Pt vs. cells alone, both p values ≤ 0.0001 in MDA-MB 231; Pt-free vs. cells alone, p value ≤ 0.0001, and GO@PEG-Pt vs. cells alone, p value ≤ 0.001 in MDA-MB 468. Significant differences between Pt-free and GO@PEG-Pt are reported in the graph as follows: **** p-value ≤ 0.0001. Representative DAPI staining of scratch test on MDA-MB-231 cells (E). Scale bars = 500 µm. Cell nuclei are indicated in blue.

Similar articles

Cited by

References

    1. De Martel C., Georges D., Bray F., Ferlay J., Clifford G.M. Global burden of cancer attributable to infections in 2018: A worldwide incidence analysis. Lancet Glob Health. 2020;8:e180–e190. doi: 10.1016/S2214-109X(19)30488-7. - DOI - PubMed
    1. World Health Organization—Cancer. 2021. [(accessed on 3 February 2022)]. Available online: https://www.who.int/news-room/fact-sheets/detail/cancer.
    1. Golemis E.A., Scheet P., Beck T.N., Scolnick E.M., Hunter D.J., Hawk E., Hopkins N. Molecular mechanisms of the preventable causes of cancer in the United States. Genes Dev. 2018;32:868–902. doi: 10.1101/gad.314849.118. - DOI - PMC - PubMed
    1. Hulvat M.C. Cancer Incidence and Trends. Surg. Clin. North. Am. 2020;100:469–481. doi: 10.1016/j.suc.2020.01.002. - DOI - PubMed
    1. Schirrmacher V. From chemotherapy to biological therapy: A review of novel concepts to reduce the side effects of systemic cancer treatment (Review) Int. J. Oncol. 2019;54:407–419. doi: 10.3892/ijo.2018.4661. - DOI - PMC - PubMed

Grants and funding

LinkOut - more resources