

ER-Stress and Senescence Coordinately Promote Endothelial Barrier Dysfunction in Diabetes-Induced Atherosclerosis
- PMID: 35889743
- PMCID: PMC9323824
- DOI: 10.3390/nu14142786
ER-Stress and Senescence Coordinately Promote Endothelial Barrier Dysfunction in Diabetes-Induced Atherosclerosis
Abstract
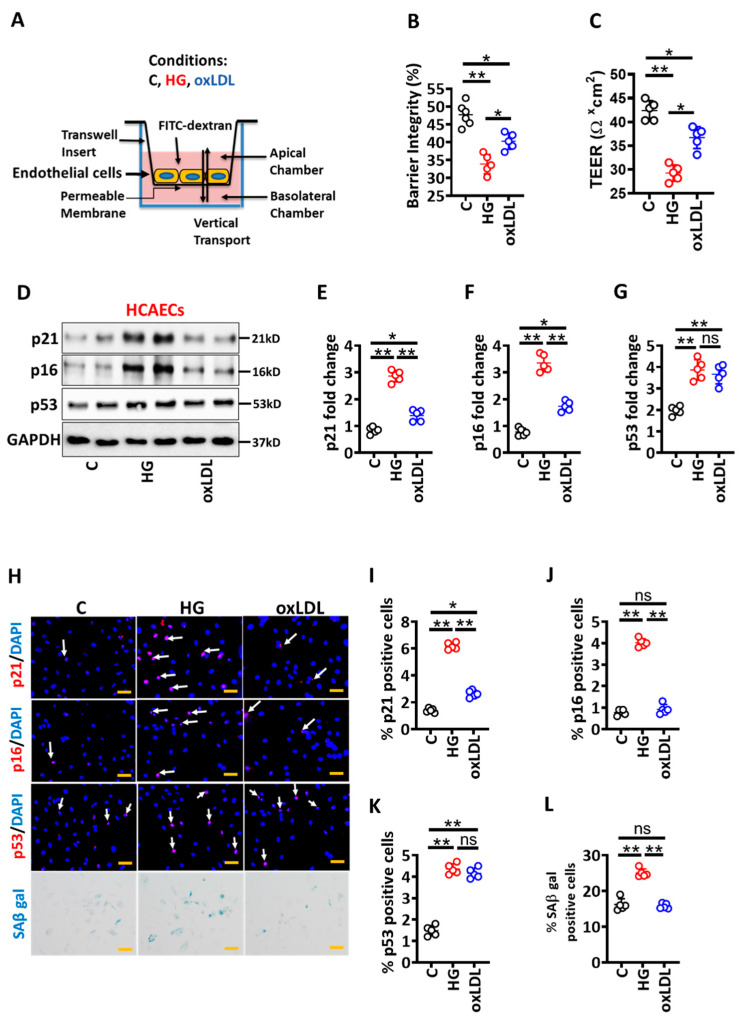
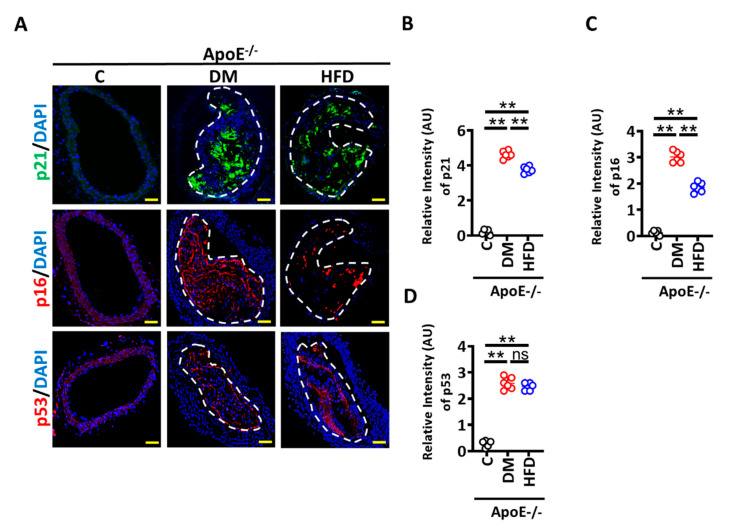
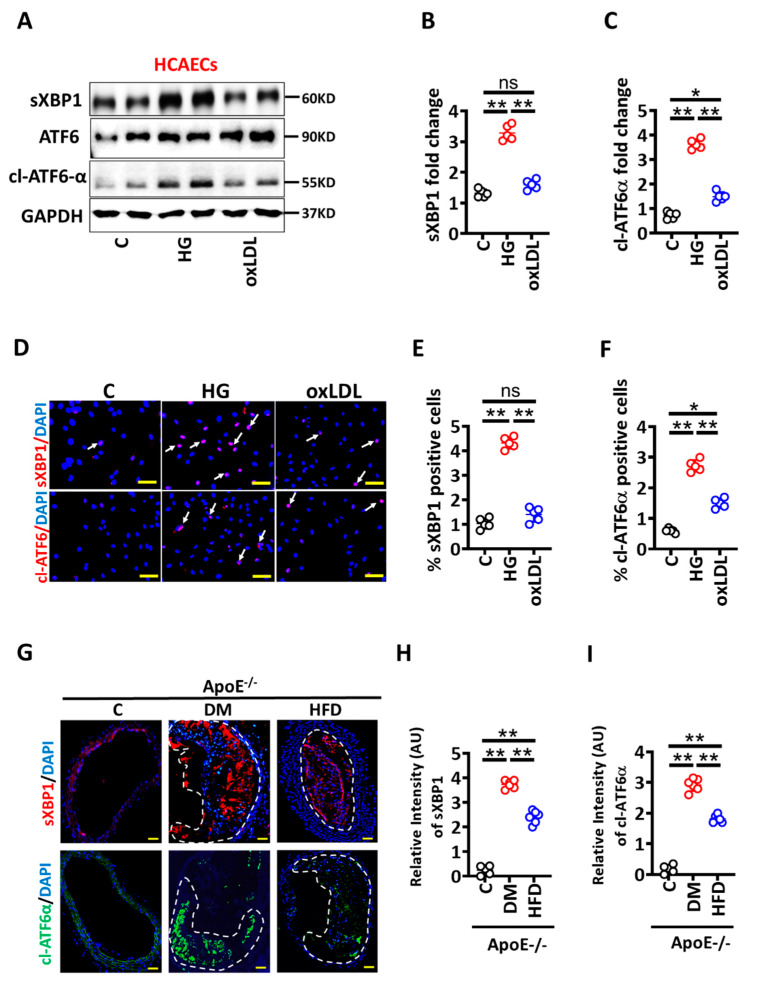
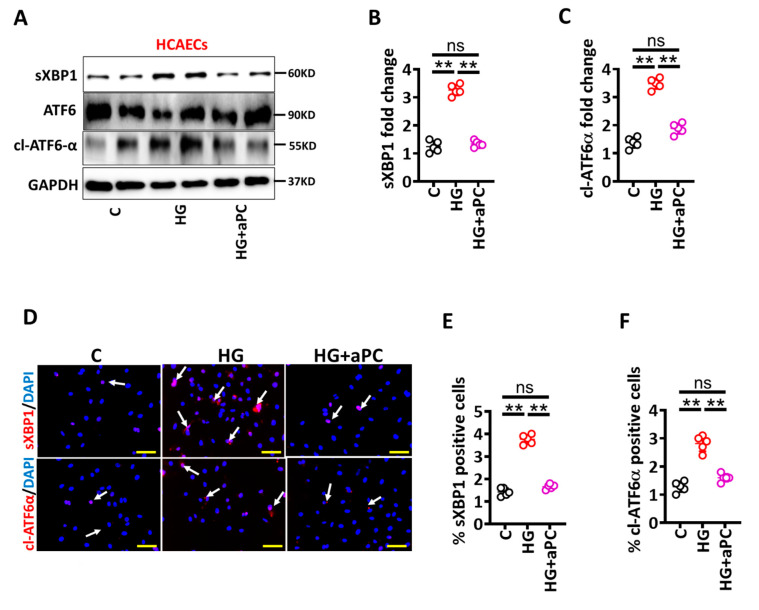
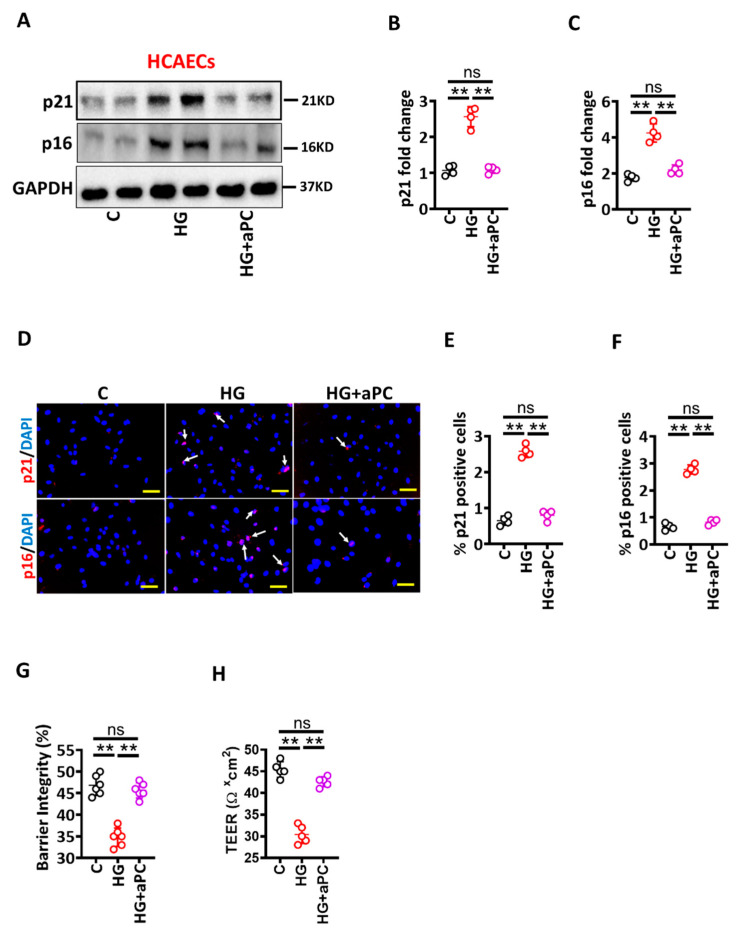
Diabetes mellitus is hallmarked by accelerated atherosclerosis, a major cause of mortality among patients with diabetes. Efficient therapies for diabetes-associated atherosclerosis are absent. Accelerated atherosclerosis in diabetic patients is associated with reduced endothelial thrombomodulin (TM) expression and impaired activated protein C (aPC) generation. Here, we directly compared the effects of high glucose and oxidized LDL, revealing that high glucose induced more pronounced responses in regard to maladaptive unfolded protein response (UPR), senescence, and vascular endothelial cell barrier disruption. Ex vivo, diabetic ApoE-/- mice displayed increased levels of senescence and UPR markers within atherosclerotic lesions compared with nondiabetic ApoE-/- mice. Activated protein C pretreatment maintained barrier permeability and prevented glucose-induced expression of senescence and UPR markers in vitro. These data suggest that high glucose-induced maladaptive UPR and associated senescence promote vascular endothelial cell dysfunction, which-however-can be reversed by aPC. Taken together, current data suggest that reversal of glucose-induced vascular endothelial cell dysfunction is feasible.
Keywords: activated protein C; atherosclerosis; diabetes; endothelial cells; senescence; unfolded protein response.
Conflict of interest statement
The authors declare that no conflict of interest exists.
Figures
Similar articles
-
Hypercoagulability Impairs Plaque Stability in Diabetes-Induced Atherosclerosis.Nutrients. 2022 May 10;14(10):1991. doi: 10.3390/nu14101991. Nutrients. 2022. PMID: 35631132 Free PMC article.
-
Featured Article: Deterioration of visual function mediated by senescence-associated endoplasmic reticulum stress in inflammatory tie2-TNF mice.Exp Biol Med (Maywood). 2018 Aug;243(12):976-984. doi: 10.1177/1535370218794915. Epub 2018 Aug 16. Exp Biol Med (Maywood). 2018. PMID: 30114984 Free PMC article.
-
Cholesterol-induced HRD1 reduction accelerates vascular smooth muscle cell senescence via stimulation of endoplasmic reticulum stress-induced reactive oxygen species.J Mol Cell Cardiol. 2024 Feb;187:51-64. doi: 10.1016/j.yjmcc.2023.12.007. Epub 2024 Jan 3. J Mol Cell Cardiol. 2024. PMID: 38171043
-
Role of endoplasmic reticulum stress signalling in diabetic endothelial dysfunction and atherosclerosis.Diab Vasc Dis Res. 2017 Jan;14(1):14-23. doi: 10.1177/1479164116666762. Epub 2016 Oct 20. Diab Vasc Dis Res. 2017. PMID: 27941052 Free PMC article. Review.
-
The UPR in atherosclerosis.Semin Immunopathol. 2013 May;35(3):321-32. doi: 10.1007/s00281-013-0372-x. Epub 2013 Apr 4. Semin Immunopathol. 2013. PMID: 23553213 Free PMC article. Review.
Cited by
-
RCN1 downregulation-driven endoplasmic reticulum stress impairs endothelial function and diabetic foot ulcer healing.Cell Mol Life Sci. 2025 Aug 25;82(1):318. doi: 10.1007/s00018-025-05814-6. Cell Mol Life Sci. 2025. PMID: 40853392 Free PMC article.
-
Portrayal of NLRP3 Inflammasome in Atherosclerosis: Current Knowledge and Therapeutic Targets.Int J Mol Sci. 2023 May 3;24(9):8162. doi: 10.3390/ijms24098162. Int J Mol Sci. 2023. PMID: 37175869 Free PMC article. Review.
-
Unfolded protein responses: Dynamic machinery in wound healing.Pharmacol Ther. 2025 Mar;267:108798. doi: 10.1016/j.pharmthera.2025.108798. Epub 2025 Jan 17. Pharmacol Ther. 2025. PMID: 39826569 Review.
-
Increased cellular protein modification by methylglyoxal activates endoplasmic reticulum-based sensors of the unfolded protein response.Redox Biol. 2024 Feb;69:103025. doi: 10.1016/j.redox.2024.103025. Epub 2024 Jan 5. Redox Biol. 2024. PMID: 38199038 Free PMC article.
-
Implications of endoplasmic reticulum stress and autophagy in aging and cardiovascular diseases.Front Pharmacol. 2024 Jul 25;15:1413853. doi: 10.3389/fphar.2024.1413853. eCollection 2024. Front Pharmacol. 2024. PMID: 39119608 Free PMC article. Review.
References
-
- Benjamin E.J., Muntner P., Alonso A., Bittencourt M.S., Callaway C.W., Carson A.P., Chamberlain A.M., Chang A.R., Cheng S., Das S.R., et al. Correction to: Heart Disease and Stroke Statistics-2019 Update: A Report From the American Heart Association. Circulation. 2020;141:e33. doi: 10.1161/CIR.0000000000000746. - DOI - PubMed
-
- Benjamin E.J., Muntner P., Alonso A., Bittencourt M.S., Callaway C.W., Carson A.P., Chamberlain A.M., Chang A.R., Cheng S., Das S.R., et al. Heart Disease and Stroke Statistics-2019 Update: A Report From the American Heart Association. Circulation. 2019;139:e56–e528. doi: 10.1161/CIR.0000000000000659. - DOI - PubMed
-
- Maahs D.M., Daniels S.R., de Ferranti S.D., Dichek H.L., Flynn J., Goldstein B.I., Kelly A.S., Nadeau K.J., Martyn-Nemeth P., Osganian S.K., et al. Cardiovascular disease risk factors in youth with diabetes mellitus: A scientific statement from the American Heart Association. Circulation. 2014;130:1532–1558. doi: 10.1161/CIR.0000000000000094. - DOI - PubMed
-
- Engelbertsen D., To F., Duner P., Kotova O., Soderberg I., Alm R., Gomez M.F., Nilsson J., Bengtsson E. Increased inflammation in atherosclerotic lesions of diabetic Akita-LDLr(-)/(-) mice compared to nondiabetic LDLr(-)/(-) mice. Exp. Diabetes Res. 2012;2012:176162. doi: 10.1155/2012/176162. - DOI - PMC - PubMed
MeSH terms
Substances
Grants and funding
LinkOut - more resources
Full Text Sources
Medical
Molecular Biology Databases
Miscellaneous
