

Development of Food Group Tree-Based Analysis and Its Association with Non-Alcoholic Fatty Liver Disease (NAFLD) and Co-Morbidities in a South Indian Population: A Large Case-Control Study
- PMID: 35889764
- PMCID: PMC9322963
- DOI: 10.3390/nu14142808
Development of Food Group Tree-Based Analysis and Its Association with Non-Alcoholic Fatty Liver Disease (NAFLD) and Co-Morbidities in a South Indian Population: A Large Case-Control Study
Abstract
Background: Non-alcoholic fatty liver disease (NAFLD) is a global problem growing in parallel to the epidemics of obesity and diabetes, with South Asians being particularly susceptible. Nutrition and behaviour are important modifiers of the disease; however, studies to date have only described dietary patterns and nutrients associated with susceptibility to NAFLD.
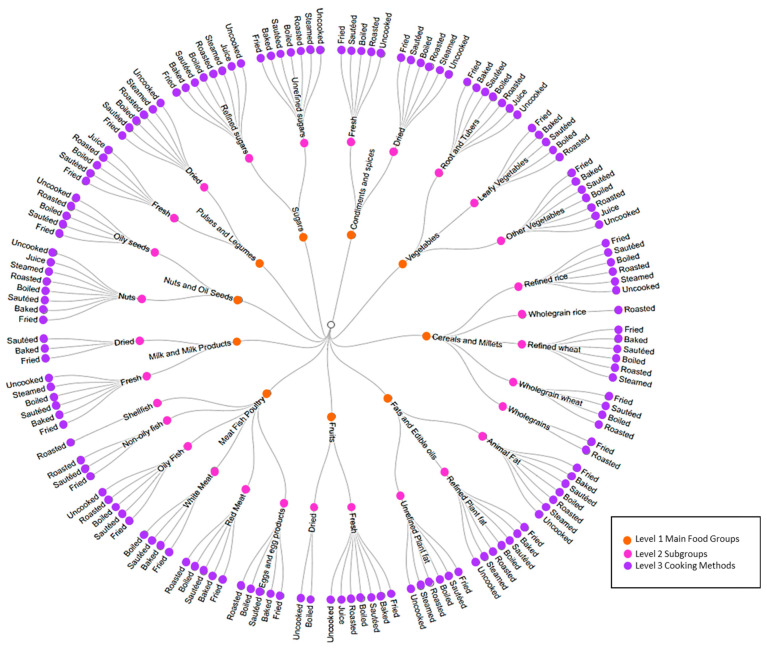
Methods: This cross-sectional case-control study included 993 NAFLD patients and 973 healthy controls from Trivandrum (India). Dietary data was collected using a locally validated food frequency questionnaire. A tree-based classification categorised 2165 ingredients into three levels (food groups, sub-types, and cooking methods) and intakes were associated with clinical outcomes.
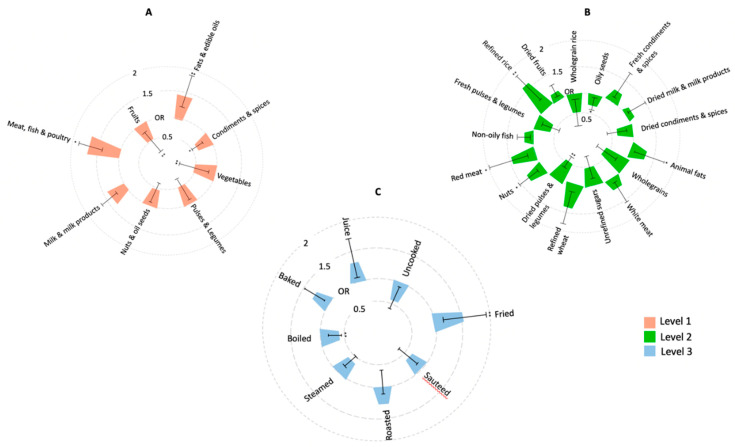
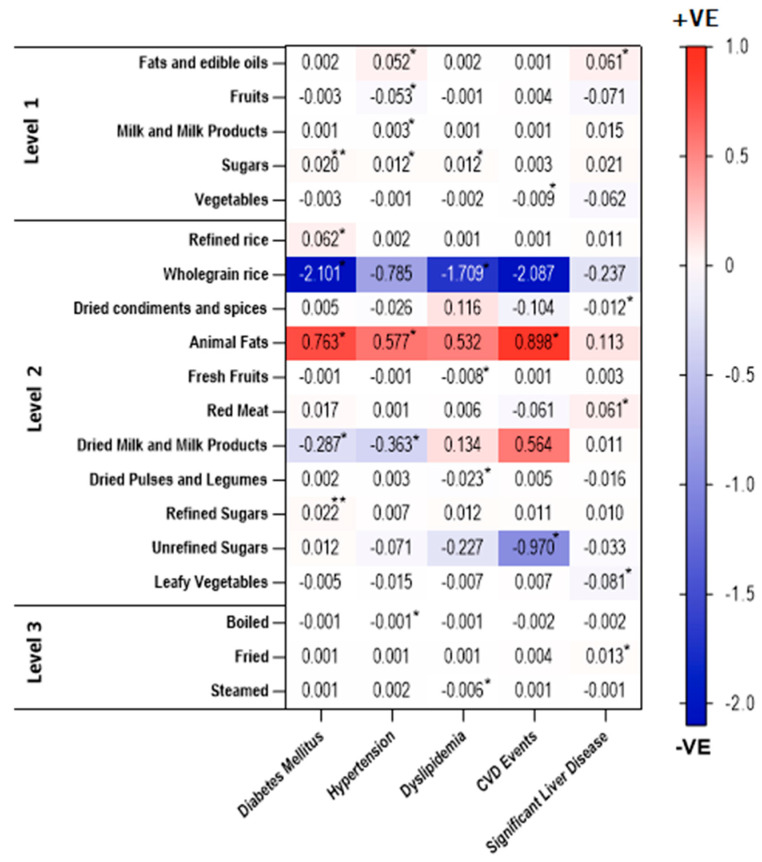
Results: NAFLD patients had significantly higher consumption of refined rice, animal fat, red meat, refined sugar, and fried foods, and had lower consumption of vegetables, pulses, nuts, seeds, and milk compared to controls. The consumption of red meat, animal fat, nuts, and refined rice was positively associated with NAFLD diagnosis and the presence of fibrosis, whereas consumption of leafy vegetables, fruits, and dried pulses was negatively associated. Fried food consumption was positively associated with NAFLD, whilst boiled food consumption had a negative association. Increased consumption of animal fats was associated with diabetes, hypertension, and cardiovascular outcomes among those with NAFLD, whereas consumption of wholegrain rice was negatively associated with these clinical-related outcomes.
Conclusions: The tree-based approach provides the first comprehensive method of classifying food intakes to enable the identification of specific dietary factors associated with NAFLD and related clinical outcomes. This could inform culturally sensitive dietary guidelines to reduce risk of NAFLD development and/or its progression.
Keywords: NAFLD; South Asians; case-control; co-morbidities; dietary factors; food groups.
Conflict of interest statement
G.P.A. is on the advisory board of GSK, Pfizer and has consulted for Astra Zeneca, Novo Nordisk, Axio, Abbott, NuCana. All other authors declare no conflict of interest.
Figures
Similar articles
-
The development of a food-group, tree classification method and its use in exploring dietary associations with metabolic dysfunction-associated Steatotic liver disease (MASLD) and other health-related outcomes in a UK population.Metabol Open. 2025 Jan 30;25:100351. doi: 10.1016/j.metop.2025.100351. eCollection 2025 Mar. Metabol Open. 2025. PMID: 39991490 Free PMC article.
-
Association of Blood Fatty Acid Composition and Dietary Pattern with the Risk of Non-Alcoholic Fatty Liver Disease in Patients Who Underwent Cholecystectomy.Ann Nutr Metab. 2017;70(4):303-311. doi: 10.1159/000475605. Epub 2017 Jun 9. Ann Nutr Metab. 2017. PMID: 28595185
-
Association between Dietary Patterns and Non-alcoholic Fatty Liver Disease: Results from a Case-Control Study.Arch Iran Med. 2021 Jan 1;24(1):35-42. doi: 10.34172/aim.2021.06. Arch Iran Med. 2021. PMID: 33588566
-
Overview of Non-Alcoholic Fatty Liver Disease (NAFLD) and the Role of Sugary Food Consumption and Other Dietary Components in Its Development.Nutrients. 2021 Apr 24;13(5):1442. doi: 10.3390/nu13051442. Nutrients. 2021. PMID: 33923255 Free PMC article. Review.
-
Relationship between Diet and Non-alcoholic Fatty Liver Disease: A Review Article.Iran J Public Health. 2017 Aug;46(8):1007-1017. Iran J Public Health. 2017. PMID: 28894701 Free PMC article. Review.
Cited by
-
The development of a food-group, tree classification method and its use in exploring dietary associations with metabolic dysfunction-associated Steatotic liver disease (MASLD) and other health-related outcomes in a UK population.Metabol Open. 2025 Jan 30;25:100351. doi: 10.1016/j.metop.2025.100351. eCollection 2025 Mar. Metabol Open. 2025. PMID: 39991490 Free PMC article.
-
Associations between dietary iron intake from different sources and non-alcoholic fatty liver disease in adults.Asia Pac J Clin Nutr. 2024 Sep;33(3):413-423. doi: 10.6133/apjcn.202409_33(3).0012. Asia Pac J Clin Nutr. 2024. PMID: 38965729 Free PMC article.
-
Effect of Nut Consumption on Nonalcoholic Fatty Liver Disease: A Systematic Review and Meta-Analysis.Nutrients. 2023 May 19;15(10):2394. doi: 10.3390/nu15102394. Nutrients. 2023. PMID: 37242277 Free PMC article.
-
Race and Ethnicity in Non-Alcoholic Fatty Liver Disease (NAFLD): A Narrative Review.Nutrients. 2022 Oct 28;14(21):4556. doi: 10.3390/nu14214556. Nutrients. 2022. PMID: 36364818 Free PMC article. Review.
-
The importance of patient engagement in the multimodal treatment of MASLD.Commun Med (Lond). 2025 May 1;5(1):148. doi: 10.1038/s43856-025-00871-1. Commun Med (Lond). 2025. PMID: 40312453 Free PMC article. Review.
References
-
- Rush E., World Health Organization (WHO) Expert Consultation Appropriate body-mass index for Asian populations and its implications for policy and intervention strategies. Lancet. 2004;363:157–163. - PubMed
MeSH terms
Grants and funding
LinkOut - more resources
Full Text Sources
Medical
