. 2022 Jul 18;14(14):2937.
doi: 10.3390/nu14142937.

The Many Ages of Microbiome-Gut-Brain Axis

Affiliations

The Many Ages of Microbiome-Gut-Brain Axis

Daniela Ratto et al. Nutrients. .

Abstract

Frailty during aging is an increasing problem associated with locomotor and cognitive decline, implicated in poor quality of life and adverse health consequences. Considering the microbiome-gut-brain axis, we investigated, in a longitudinal study, whether and how physiological aging affects gut microbiome composition in wild-type male mice, and if and how cognitive frailty is related to gut microbiome composition. To assess these points, we monitored mice during aging at five selected experimental time points, from adulthood to senescence. At all selected experimental times, we monitored cognitive performance using novel object recognition and emergence tests and measured the corresponding Cognitive Frailty Index. Parallelly, murine fecal samples were collected and analyzed to determine the respective alpha and beta diversities, as well as the relative abundance of different bacterial taxa. We demonstrated that physiological aging significantly affected the overall gut microbiome composition, as well as the relative abundance of specific bacterial taxa, including Deferribacterota, Akkermansia, Muribaculaceae, Alistipes, and Clostridia VadinBB60. We also revealed that 218 amplicon sequence variants were significantly associated to the Cognitive Frailty Index. We speculated that some of them may guide the microbiome toward maladaptive and dysbiotic conditions, while others may compensate with changes toward adaptive and eubiotic conditions.

Keywords: adaptive mechanism; aging; cognitive decline; dysbiosis; eubiosis; frailty; gut microbiome; inflammaging; maladaptive mechanism.


Conflict of interest statement

The authors declare no conflict of interest.

Figures

Figure 1
Figure 1
Flow diagram of experimental plan with the chosen time points: 11, 14, 17, 20, and 21.5 months of mice age, corresponding to T0, T1, T2, T3, and T4, respectively. It has to be noted that T0 and T1 belonged to adulthood, T2 to reproductive senescence, and T3 and T4 to senescence. At each time point, behavioral tests were performed and stool samples were collected).
Figure 2
Figure 2
Alpha diversity distribution box plots. In (A): Shannon diversity index (SDI) estimated for each time point. In (B): Faith’s phylogenetic distance (PD) estimated for each time point. (Number of mice: T1 n = 14, T2 n = 12, T3 n =14, and T4 n =13).
Figure 3
Figure 3
Non-metric multidimensional scaling (NMDS) at different time points (T0–T1–T2–T3–T4). Colors in the bidimensional NMDS plot are used according to the different sample origin as shown in the legend. The ordinate analysis is based on the Bray-Curtis distance matrix. The graphical plot and the ellipses were generated by ggplot2 R package implemented with stat ellipse function. (Number of animals: T1 n = 14, T2 n = 12, T3 n =14, and T4 n =13). Colors in the graphs are reported according to the different experimental times as shown in the figure labels.
Figure 4
Figure 4
Bar chart regarding the distribution of the most abundant phyla (A), families (B), and genera (C). The proportion of stack in bar chart corresponds to the total amount of reads of the most abundant phyla, families and genera. (Number of animals: T1 n = 14, T2 n = 12, T3 n = 14, and T4 n = 13).
Figure 5
Figure 5
Box plots representing the relative abundance of genera (A) Akkermansia, (B) Clostridia_vadinBB60_group, (C) Alistipes, (D) Muribaculaceae, (E) Colidextribacter, and (F) Clostridia UCG-014. (Number of mice: T1 n = 14, T2 n = 12, T3 n =14, and T4 n =13).
Figure 6
Figure 6
A differential heat tree based on the Wilcoxon rank-sum test, indicating which taxa were more abundant in each experimental time. Phyla, classes, orders, families, and genera are represented. Node label is the taxon name, node size is the number of ASVs, and node color is the abundances of the indicated phylum, class, order, family, or genus. A taxon colored brown was more abundant in the time points colored in brown and a taxon colored in green was more abundant in the time points colored in green, as reported in the legend. The tree differential plots were generated using the metacoder R package. (Number of animals: T1 n = 14, T2 n = 12, T3 n =14, and T4 n =13).
Figure 7
Figure 7
Mean cognitive decline, reported as Cognitive Frailty Index (FI), during physiological aging (n = 14). (A): linear least-squares regression analysis of Cognitive FI during mice lifespan. (B): median value of Cognitive FI during mice lifespan.
Figure 8
Figure 8
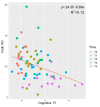
Figure plotting the correlation between Faith’s phylogenetic distance (PD) index and Cognitive FI. Reported is the linear regression equation used to fit experimental data. Colors in the graphs are reported according to the different experimental times as shown in the figure labels.
Figure 9
Figure 9
CAP analysis revealed that microbiomes varied by time, but with a slight effect on the Cognitive Frailty Index. CAP analysis was performed using the beta diversity based on Bray-Curtis distance metric constrained to time point and Cognitive FI. Each dot represents each sample’s coordinate on constrained PCoA1. Different levels of Cognitive FI are reported as a gradient scale (lower values in dark blue and higher values light blue).
Figure 10
Figure 10
The heat map shows the distribution of the abundances of 218 ASVs whose variation was statistically significant in relation to the variation of the Cognitive FI. The analysis was performed using Deseq2 R package and the heat map was generated using phetamap R package. The variations in terms of abundance are indicated using the coloring scale in the legend. A green-white color scale is used to indicate the variation of Cognitive FI.

References

    1. López-Otín C., Blasco M.A., Partridge L., Serrano M., Kroemer G. The Hallmarks of Aging. Cell. 2013;153:1194–1217. doi: 10.1016/j.cell.2013.05.039. - DOI - PMC - PubMed
    1. Bana B., Cabreiro F. The Microbiome and Aging. Annu. Rev. Genet. 2019;53:239–261. doi: 10.1146/annurev-genet-112618-043650. - DOI - PubMed
    1. Ratto D., Corana F., Mannucci B., Priori E.C., Cobelli F., Roda E., Ferrari B., Occhinegro A., Di Iorio C., De Luca F., et al. Hericium Erinaceus Improves Recognition Memory and Induces Hippocampal and Cerebellar Neurogenesis in Frail Mice during Aging. Nutrients. 2019;11:715. doi: 10.3390/nu11040715. - DOI - PMC - PubMed
    1. Burke S.N., Ryan L., Barnes C.A. Characterizing Cognitive Aging of Recognition Memory and Related Processes in Animal Models and in Humans. Front. Aging Neurosci. 2012;4:15. doi: 10.3389/fnagi.2012.00015. - DOI - PMC - PubMed
    1. Turriziani P., Serra L., Fadda L., Caltagirone C., Carlesimo G.A. Recollection and Familiarity in Hippocampal Amnesia. Hippocampus. 2008;18:469–480. doi: 10.1002/hipo.20412. - DOI - PubMed

LinkOut - more resources