. 2022 Jul 12;14(7):1451.
doi: 10.3390/pharmaceutics14071451.

Tissue Barrier-on-Chip: A Technology for Reproducible Practice in Drug Testing

Affiliations

Tissue Barrier-on-Chip: A Technology for Reproducible Practice in Drug Testing

Eugen V Koch et al. Pharmaceutics. .

Abstract

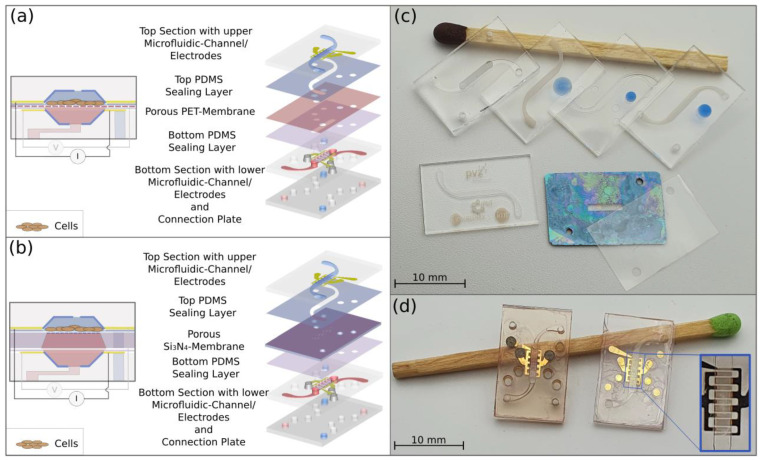
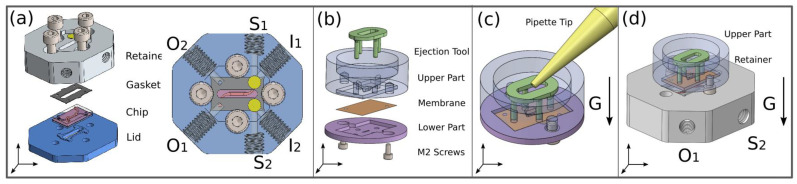
One key application of organ-on-chip systems is the examination of drug transport and absorption through native cell barriers such the blood-brain barrier. To overcome previous hurdles related to the transferability of existing static cell cultivation protocols and polydimethylsiloxane (PDMS) as the construction material, a chip platform with key innovations for practical use in drug-permeation testing is presented. First, the design allows for the transfer of barrier-forming tissue into the microfluidic system after cells have been seeded on porous polymer or Si3N4 membranes. From this, we can follow highly reproducible models and cultivation protocols established for static drug testing, from coating the membrane to seeding the cells and cell analysis. Second, the perfusion system is a microscopable glass chip with two fluid compartments with transparent embedded electrodes separated by the membrane. The reversible closure in a clamping adapter requires only a very thin PDMS sealing with negligible liquid contact, thereby eliminating well-known disadvantages of PDMS, such as its limited usability in the quantitative measurements of hydrophobic drug molecule concentrations. Equipped with tissue transfer capabilities, perfusion chamber inertness and air bubble trapping, and supplemented with automated fluid control, the presented system is a promising platform for studying established in vitro models of tissue barriers under reproducible microfluidic perfusion conditions.

Keywords: cell assay; cell seeding; glass microsystem; membrane; organ-on-chip; resealing technique; tissue barrier.


Conflict of interest statement

The authors declare no conflict of interest.

Figures

Figure 1
Figure 1
The microfluidic chip. (a) Schematic of the microfluidic chip from a cross-sectional view and an exploded view, illustrating the construction consisting of six layers: the top section, top sealing layer, porous polyethylene terephthalate (PET) membrane, bottom sealing layer and bottom section, made of two layers. (b) Schematic of the microfluidic chip with a porous Si3N4 membrane on a Si-chip from a cross-sectional view and an exploded view. (c) From upper left to right (lying on a match): bottom section with the lower microfluidic channel, the top section with the upper channel, the top section with the upper channel after annealing and placing a PDMS sealing layer according to the shift method, the top section with the upper channel with a PDMS sealing layer applied with the direct method (the hydrophobic PDMS sealing is visualized by the blue-colored water droplets in comparison to the spread droplet on the hydrophilic surface of the glass); from lower right to left: a porous PET membrane with through-holes, a Si-chip with a collagen-coated Si3N4 membrane in the center with through-holes and a glass chip after annealing, showing the S-shaped channel surrounded by the graphical feature. (d) Bottom section (left) with a lower microfluidic channel and interdigitated electrodes made of gold and ITO and the top part (right) with an upper channel covered by the sealing layer and the PET porous membrane, as well as a zoomed-in view of interdigitated electrodes.
Figure 2
Figure 2
Two approaches for the application of the PDMS sealing layer. (A) Direct method: the glass-bonded thin PDMS sealing layer is structured in a single femtosecond laser (fs-laser) ablation process. (B) Shift method: the PDMS sealing layer is contoured using the fs-laser and is manually peeled off the substrate and placed on the processed microfluidic glass chip. As a last step, all layers are stacked and compressed in a microfluidic chip holder.
Figure 3
Figure 3
Microfluidic chip and transfer holder (a) Explosive view of the system holder (left), consisting of a retainer, a gasket, the chip and a lid. On the right, the assembled microfluidic setup with the assigned ports. (b) Explosive view of the assembled transfer holder as applied for seeding cells on the membrane, consisting of an ejection tool, the upper and lower part, a pair of M2 PEEK screws and a porous membrane for cell cultivation (left). (c) Illustration of the membrane coating and cell-seeding process by cell injection through a pipette. (d) Illustration of the transfer process of the cultivated membrane from the upper part of the transfer holder to the microfluidic chip. The upper part is coupled to the retainer, which is inverted during the transfer, and the membrane is fixed on the bottom section of the chip with the inserted ejection tool. The arrow marked with “G” indicates the direction of gravity.
Figure 4
Figure 4
(a) Schematic view of the experimental setup for flow control showing the microsystem in the center of the retainer (with inlets I1 and I2, outlets O1 and O2, side ports S1 and S2 and contact pad holes C1–4), culture medium reservoirs (M1, M2), waste reservoirs (W1, W2), pneumatic controllers (P1, P2, P3), the flow-rate sensor (Q1) and sterile syringe filters connected to side ports S1 and S2, which are closed during the experiments. The main setup is positioned on top of an inverse microscope placed in a self-built incubator (red frame) using a thermocontroller coupled to a panel heater and heating foils and to a Pt-100 temperature sensor. (b) Actual image of the microsystem in the center surrounded by the peripheral flow control.
Figure 5
Figure 5
Microfluidic retainer. (a) Photograph of the complete microfluidic setup including chip and retainer elements. (b) Air bubble from the outgassing medium trapped in the center of the inlet port in the retainer, which is not equipped with a phase filter membrane. (c) Growing air bubble entering the upper microfluidic channel (highlighted by the red dashed line), 15 min after filling the chip with the culture medium. (d) Inlet port in a retainer equipped with a phase filter membrane to remove air before entering the microchannel.
Figure 6
Figure 6
(a) Dependence of the Shore durometer hardness from the mixing ratio of PDMS, measured at 37 °C. (b) Correlation of the durometer hardness with the absorption depth of rhodamine B in the sealing layer.
Figure 7
Figure 7
Fluorescence images and fluorescence intensity distributions in the sealing layer observed within the microfluidic upper channel filled with DI water and rhodamine B dissolved in DI water (R+W) at 1 bar. (a) Channel with a PDMS sealing layer filled with DI water. (b) Channel with a PDMS sealing layer (1:10) (9.09 wt%) filled with dyed liquid. (c) Channel with a PDMS sealing layer (1:20) (4.76 wt%) filled with dyed liquid. (d) Channel with a PDMS sealing layer (1:5) (16.67 wt%) filled with dyed liquid. (e) Channel with a PDMS sealing layer (1:10) (9.09 wt%) after rinsing the channel with 1 mL DI water. (f) Channel with a sealing layer (PDMS 1:10) (9.09 wt%) enclosed by a glass lid coated with PDMS (PDMS 1:10) (9.09 wt%), after rinsing the channel with 1 mL DI water. (g) Correlation of the absorbed rhodamine B with the sealing layer by applying different PDMS mixing ratios.
Figure 8
Figure 8
(a) The upper and lower section of the system coated with an intact gold layer before the leak test. (b) Microfluidic system using the shift method, after the leak test, using a potassium iodide (KI) solution. (c) Microfluidic system using the shift method with an obstacle (indicated by the red dashed line) to enforce leakage, after the leak test (negative control). Scale bar = 10 mm.
Figure 9
Figure 9
Comparison of on-chip MDCK cell distributions obtained with different seeding procedures. (a) Direct seeding by manual flow control and sedimentation inside the chip. (b) Cells after seeding for 12 h on a PET membrane in the transfer holder. Note that part of the image is shaded by the transfer holder. (c) Fluorescence image of live–dead staining and (d) bright-field images of the cell’s on PET membrane prior to the transfer into the chip. (e) Fluorescence image of the cell nucleus and dead staining and (f) bright-field image of cells on a PET membrane after on-chip cultivation. (g) Fluorescence image of cell nucleus staining and (h) a bright-field image of cells on a Si3N4 membrane prior to the transfer into the chip. In addition, small droplets underneath the highly transparent membrane became visible.
Figure 10
Figure 10
TEER values of MCDK cells obtained on-chip and off-chip at different proliferation stages. (a) After seeding with a density of 13,750 cells/mm2 on the transfer holder and various cultivation periods, the on-chip measurements were performed directly after transfer. Off-chip measurements were obtained in Transwell® inserts (n = 3) with seeding densities of 13,750 cells/mm2 (A), 4500 cells/mm2 (B) and 900 cells/mm2 (C). (b) Brightfield image of MDCK cells inside the microfluidic chip with transparent interdigitated electrodes (their edges appear as vertical shadow lines) directly after the transfer, which took place one day after seeding. (c) Brightfield image of MDCK cells inside the microfluidic chip after progressed proliferation. With a higher confluence, the cell layer can detach and roll up more easily under uncareful handling, as shown in the upper left corner.

Similar articles

Cited by

References

    1. Jin I.S., Yoon M.S., Park C.-W., Hong J.T., Chung Y.B., Kim J.-S., Shin D.H. Replacement techniques to reduce animal experiments in drug and nanoparticle development. J. Pharm. Investig. 2020;50:327–335. doi: 10.1007/s40005-020-00487-8. - DOI
    1. Esch E.W., Bahinski A., Huh D. Organs-on-chips at the frontiers of drug discovery. Nat. Rev. Drug Discov. 2015;14:248–260. doi: 10.1038/nrd4539. - DOI - PMC - PubMed
    1. Ahn S.I., Sei Y.J., Park H.-J., Kim J., Ryu Y., Choi J.J., Sung H.-J., MacDonald T.J., Levey A.I., Kim Y. Microengineered human blood-brain barrier platform for understanding nanoparticle transport mechanisms. Nat. Commun. 2020;11:175. doi: 10.1038/s41467-019-13896-7. - DOI - PMC - PubMed
    1. Lee C.S., Leong K.W. Advances in microphysiological blood-brain barrier (BBB) models towards drug delivery. Curr. Opin. Biotechnol. 2020;66:78–87. doi: 10.1016/j.copbio.2020.06.009. - DOI - PMC - PubMed
    1. Daneman R., Prat A. The blood-brain barrier. Cold Spring Harb. Perspect. Biol. 2015;7:a020412. doi: 10.1101/cshperspect.a020412. - DOI - PMC - PubMed

LinkOut - more resources