Review
. 2022 Jul 21;22(14):5443.
doi: 10.3390/s22145443.

Advanced Waveguide Based LOC Biosensors: A Minireview

Affiliations
Review

Advanced Waveguide Based LOC Biosensors: A Minireview

Muzafar A Kanjwal et al. Sensors (Basel). .

Abstract

This mini review features contemporary advances in mid-infrared (MIR) thin-film waveguide technology and on-chip photonics, promoting high-performance biosensing platforms. Supported by recent developments in MIR thin-film waveguides, it is expected that label-free assimilated MIR sensing platforms will soon supplement the current sensing technologies for biomedical diagnostics. The state-of-the-art shows that various types of waveguide material can be utilized for waveguide spectroscopic measurements in MIR. However, there are challenges to integrating these waveguide platforms with microfluidic/Lab-on-a-Chip (LOC) devices, due to poor light-material interactions. Graphene and its analogs have found many applications in microfluidic-based LOC devices, to address to this issue. Graphene-based materials possess a high conductivity, a large surface-to-volume ratio, a smaller and tunable bandgap, and allow easier sample loading; which is essential for acquiring precise electrochemical information. This work discusses advanced waveguide materials, their advantages, and disease diagnostics with MIR thin-film based waveguides. The incorporation of graphene into waveguides improves the light-graphene interaction, and photonic devices greatly benefit from graphene's strong field-controlled optical response.

Keywords: LOC devices; graphene incorporation; mid-infrared; waveguides.


Conflict of interest statement

The authors declare no conflict of interest.

Figures

Figure 1
Figure 1
Graphic presentation of (a) the establishment and alignment of a collimating lenses and radius of curvature R(1–3) developed for the utilization with fiber optics of a distinct numerical aperture, and (b) the arrangement of various micro-optic constituents to adjust the light–specimen relationship: Figure adapted from ref. [67] with permission of Nature Protocols. Copyright 2011 Nature Publishing Group.
Figure 2
Figure 2
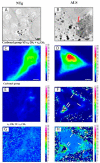
Synchrotron-FT-IR imaging of (A) Ntg and (B) ALS astrocytes, where (C,D) ν(C=O) vibrations, (E,F) ratio of ν(C=O)/(νasCH3 + νasCH2) vibrations, and (G,H) ratio of νasCH2asCH3 vibrations reveal concentrated intracellular lipid compositions and acyl chain unsaturation (white arrows) associated with lipid vesicles and lipid peroxidation. Reproduced with permission from ref. [76,77]. Copyright 2019 American Chemical Society.
Figure 3
Figure 3
Graphical illustration of light propagation in an (a) ATR crystal and (b) optical waveguide.
Figure 4
Figure 4
Illustration of common thin-film waveguide geometries: (a) slab waveguide, (b) strip waveguide, (c) rib waveguide, (d) slab waveguide, (e) ridge waveguide, and (f) embedded/buried waveguide. The same functional layers are marked with the same colors: green = waveguide layer (nc), red = optical buffer layer (nb), blue = substrate (ns). Reproduced with permission from ref. [90]. Copyright 2006 the American Chemical Society.
Figure 5
Figure 5
(top left) Cross-section of a MOVPE-grown GaAs/Al0.2Ga0.8As ridge waveguide obtained via reactive ion etching. (top right) Computed optical mode profile of the thin-film GaAs/AlGaAs waveguide structure with a layer dimension of 6 μm (left axis, mode intensity; right axis, refractive index). (bottom left) Experimental setup of a single wavelength emitting QCL pigtail-coupled to a GaAs slab waveguide. (bottom right) Analytical response to 2-nL droplets of an analyte in evanescent field absorption measurement with QCL pigtail-coupled to a structured GaAs ridge waveguide (200 μm in width). Reproduced with permission from ref. [12]. Copyright 2006 the American Chemical Society. Reproduced with permission from ref. [87]. Copyright 2012 the Royal Society of Chemistry.
Figure 6
Figure 6
(top) Scheme of an on-chip MIR Mach−Zehnder interferometer. (bottom left) Scanning electron microscopy (SEM) images of MIR-MZI waveguides show (a) a top view of GaAs/AlGaAs MZIs, and the Y-junction (b) before and (c) after using focused ion beam (FIB) microscopy for refining the structure for the joint of the waveguide arms. (bottom right) Typical interferometric signal generated by depositing, e.g., water droplets at one of the MZI arms, resulting in a phase delay and giving rise to the observed interference pattern. Reproduced with permission from ref. [91]. Copyright 2013 the American Chemical Society.
Figure 7
Figure 7
(a) SEM image of a cleaved cross-section of GeTe4 film as deposited; (b) top view of GeTe4 channels fabricated using lift-off techniques; (c) X-ray diffraction pattern and atomic force microscopy image of a ZnSe substrate and GeTe4 films. (d) Distal coupling facet of the waveguide cut by ductile dicing [109].Reproduced with permission from the Optical Society Publishing, 2015.
Figure 8
Figure 8
(top left) SEM image of a 2-μm monocrystalline germanium-on-silicon ridge waveguide. (top right) Fabrication scheme: a UV-curable adhesive (NOA81) cast onto a PDMS master and subsequently bonded onto the silicon substrate, forming a microfluidic channel, which was connected to a syringe pump. (bottom left) Optical setup: QCL radiation is coupled via lenses into the waveguide and via an off-axis parabolic mirror onto a MCT detector. (bottom right) Waveguide output during a dynamic analytical study using different cocaine concentrations present at the waveguide surface determined at a wavelength of 5.8 μm. Reproduced with permission from refs. [111] (Copyright 2012 Optical Society of America) and [112] (Copyright 2012 Royal Society of Chemistry).
Figure 9
Figure 9
Selective detection of Gram-negative bacteria (E. coli) in urine using a LRSPP straight waveguide biosensor functionalized using Protein G and antibody against Gram-negative bacteria [128,129]. Bact1202A was a positive control urine solution with a high E. coli concentration of 1010 CFU/mL. Bact1202B was a positive control urine solution with a low E. coli concentration of 106 CFU/mL. SEPI1126 was a negative control urine solution with a Gram-positive bacteria (s.epi) concentration of 1012 CFU/mL. The refractive index at 1310 nm of Urine1203 is 1.32276 and of PBSG1124 (buffer) is 1.33152. Copyright with permission from IEEE Ref. [130].
Figure 10
Figure 10
Schematic illustrating the functionalization of a waveguide surface for the detection of (a) dengue NS1 antigen and (b) dengue-specific IgM antibody. Copyright with permission from IEEE ref. [130].
Figure 11
Figure 11
Interdisciplinary field of lab-on-chip technology.
Figure 12
Figure 12
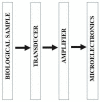
Schematic illustration of lab-on-chip technology.
Figure 13
Figure 13
Lab-on-chip themes using a wordlist cluster investigation of the bibliometric data extracted from Scopus using VOS viewer software. Wordlist cluster investigation was performed to determine the research hotspots and developments in the last two decades. Copyright with permission from ref. [153] Springer.
Figure 14
Figure 14
Electrochemical biosensor using a graphene-modified electrode for quantitative detection of folic acid protein. Reproduced with permission from [181]. Copyright 2016 Elsevier B.V.
Figure 15
Figure 15
Graphene-based electrochemical biosensor for detection of folic acid. Reproduced with permission from [182]. Copyright 2016 Springer.

References

    1. Parachalil D.R., Bruno C., Bonnier F., Blasco H., Chourpa I., Baker M.J., McIntyre J., Byrne H.J. Analysis of bodily fluids using vibrational spectroscopy: A direct comparison of Raman scattering and infrared absorption techniques for the case of glucose in blood serum. Analyst. 2019;144:3334–3346. doi: 10.1039/C9AN00125E. - DOI - PubMed
    1. Mittal V., Mashanovich G.Z., Wilkinson J.S. Perspective on Thin Film Waveguides for on-Chip Mid-Infrared Spectroscopy of Liquid Biochemical Analytes. Anal. Chem. 2020;92:10891–10901. doi: 10.1021/acs.analchem.0c01296. - DOI - PubMed
    1. Fahrenfort J. Attenuated total reflection: A new principle for the production of useful infra-red reflection spectra of organic compounds. Mol. Spectrosc. 1989;45((Suppl. S41)):251–263.
    1. Harrick N.J., Beckmann K.H. Internal Reflection Spectroscopy. In: Kane P.F., Larrabee G.B., editors. Characterization of Solid Surfaces. Springer; Boston, MA, USA: 1974. pp. 215–245.
    1. Mizaikoff B. Peer Reviewed: Mid-IR Fiber-Optic Sensors. Anal. Chem. 2003;75:258A–267A. doi: 10.1021/ac031340g. - DOI - PubMed

LinkOut - more resources