. 2022 Jul 21;14(7):1580.
doi: 10.3390/v14071580.

Histopathological and Immunological Findings in the Common Marmoset Following Exposure to Aerosolized SARS-CoV-2

Affiliations

Histopathological and Immunological Findings in the Common Marmoset Following Exposure to Aerosolized SARS-CoV-2

Rachel E Ireland et al. Viruses. .

Abstract

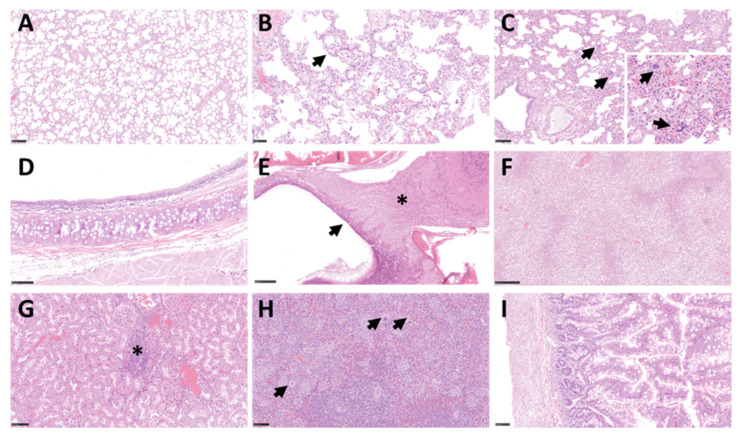
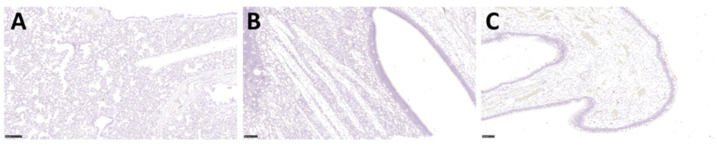
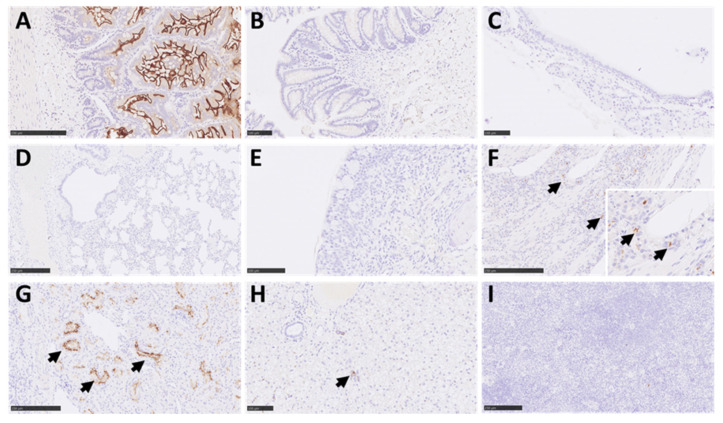
There is an enduring requirement to develop animal models of COVID-19 to assess the efficacy of vaccines and therapeutics that can be used to treat the disease in humans. In this study, six marmosets were exposed to a small particle aerosol (1-3 µm) of SARS-CoV-2 VIC01 that delivered the virus directly to the lower respiratory tract. Following the challenge, marmosets did not develop clinical signs, although a disruption to the normal diurnal temperature rhythm was observed in three out of six animals. Early weight loss and changes to respiratory pattern and activity were also observed, yet there was limited evidence of viral replication or lung pathology associated with infection. There was a robust innate immunological response to infection, which included an early increase in circulating neutrophils and monocytes and a reduction in the proportion of circulating T-cells. Expression of the ACE2 receptor in respiratory tissues was almost absent, but there was ubiquitous expression of TMPRSS2. The results of this study indicate that exposure of marmosets to high concentrations of aerosolised SARS-CoV-2 did not result in the development of clear, reproducible signs of COVID-19.

Keywords: ACE2; SARS-CoV-2; TMPRSS2; aerosol; marmoset.


Conflict of interest statement

The authors declare no conflict of interest.

Figures

Figure 1
Figure 1
Schedule of in-life and post-mortem sampling. Animals (red—female; green—male) were surgically implanted with a Remo 201 device (EMMS, Bordon, UK) and allowed 4 weeks to recover prior to challenge with SARS-CoV-2. Baseline blood samples were collected 2 weeks prior to challenge. On days 1, 2, 3, 4, 7, 14, and 21 post-challenge, groups of animals were anaesthetized and blood, throat, and nasal swabs were collected to assess viremia, immunological parameters, and virus shedding (* note that blood samples were not collected from M5 and M6 on day 3 post-challenge). Pairs of marmosets were euthanised at day 2, 4, and at the end of the study on day 21 post-challenge and blood and tissues were collected at post mortem for further analyses.
Figure 2
Figure 2
Optimization of the aerosolization of SARS-CoV-2. (A) The relative humidity conditions explored; (B) Particle size distribution at different relative humidities; (C) Mass median aerodynamic diameter (MMAD) at each relative humidity; (D) Comparison of nebuliser (Cneb) and impinger (Csamp) concentrations at low, medium, and high relative humidity. Individual data points are presented with calculated linear regression line and the 95% confidence interval; (E) Comparison of the Spray Factor and impinger (Csamp) concentration at low, medium, and high relative humidity. Individual data points are presented with calculated linear regression line for each relative humidity subgroup; (F) Comparison of the Spray Factor at low, medium, and high relative humidity. Data is presented as the mean and SD where * p = 0.0266 and ** p = 0.0022.
Figure 3
Figure 3
Clinical observations in marmosets challenged with SARS-CoV-2 by the aerosol route. Remote telemetry was used to monitor core body temperature (Tc) in marmosets. Normal diurnal temperature ranges between 38–39 °C during the day and 36–37 °C at night. The mean hourly temperature (black line), the expected temperature (using baseline data for each individual animal; dark red line), and the expected temperature ±1 SD (bright red shaded area), ±2 SD (red shaded area), and ±3 SD (pink shaded area) are shown for (A) M1, (B) M3, (C) M4, (D) M5, and (E) M6 from days 0 to 8 post-challenge. ★ Indicates Tc > 3 SD than the expected Tc (note that there is no Tc data for M2 due to failure of implant). (F) Animals were weighed prior to the challenge to determine baseline weights and daily throughout the study. Data is presented as the percentage body weight change for each animal, or the mean of all animals. A mixed-effects model was used to determine statistical difference in weight change with time where ns—not significant and ** p = 0.007.
Figure 4
Figure 4
The immunological response in marmosets following aerosol challenge with SARS-CoV-2 VIC01. (A) The proportion of neutrophils in PBMCs from blood collected prior to, and post-challenge defined by size, granularity, and expression of both CD11c and CD14. (B) HLA-DR expression in circulating neutrophils in marmosets following SARS-CoV-2 challenge. Filled red symbols denote a reduction in HLA-DR expression (defined as 10% below baseline for each individual animal determined from pre-challenge samples); pink open circle denotes a poorly stained sample on day 7 for animal M6 and this data therefore should be treated with caution. (C) The proportion of monocytes in PBMCs from blood collected prior to and post-challenge. The T:B cell ratio (D) in PBMCs from blood collected prior to challenge and on days 1, 2, 3, 4, 7, 14, and 21 post-challenge were defined by size, granularity, and expression of CD3+:CD20+. (E) Proportion of macrophages and neutrophils in marmoset lung following SARS-CoV-2 challenge (n = 2 per time point). Samples from naïve animals (n = 4) were processed during the study to provide resting levels. (F) Quantification of CRP in marmoset plasma detected by ELISA in marmoset plasma samples. Data is presented for each animal. The COVID diagnostic level is the threshold of diagnostically significant levels of CRP described in human COVID-19 cases. In all figures, data is presented for each animal and the normal ranges were defined by the pre-challenge values. Statistically significant differences from pre-challenge values were determined by one-way ANOVA where * p < 0.05, ** p < 0.01 and *** p < 0.001.
Figure 5
Figure 5
Histopathological findings in the respiratory and non-respiratory tissues following SARS-CoV-2 challenge. H&E-stained lung tissue from animal M2 (A) shows minimal changes and within normal limits; from animal M3 (Bar = 250 µm) (B) shows minimal septal inflammatory cell infiltration (arrow), and animal M5 (Bar = 250 µm) (C) shows scattered foci of extramedullary hematopoiesis within the lung parenchyma (Bar = 100 µm) (arrows and insert). No significant lesions were observed in H&E-stained trachea from animal M2 (D) and in the nasal cavity of animal M5 (Bar = 250 µm) (E) with normal histological structure in the olfactory mucosa (arrow) and the olfactory nerves and bulb (*). H&E-stained liver tissue section from animal M1 (Bar = 250 µm) (F) shows moderate vacuolation of hepatocytes; kidney tissue section from animal M1 (Bar = 100 µm) (G) shows mononuclear inflammatory infiltrates within the cortex (*); and spleen tissue section from M3 (Bar = 100 µm) (H) shows abundant megakaryocytes within the red pulp (arrows); (I) shows small intestine tissue section from M4 with no significant changes (Bar = 100 µm).
Figure 6
Figure 6
Representative images of ISH of respiratory tissues from animal M2 by RNAScope. Sections of lung (Bar = 250 µm) (A), nasal olfactory cavity (Bar = 100 µm) (B), and respiratory epithelium (Bar = 100 µm) (C) were stained for the presence of the SARS-CoV-2 S gene. No positive staining was detected within the lung, respiratory epithelium, olfactory epithelium, glands, or nerve terminations.
Figure 7
Figure 7
Representative images of IHC for ACE2 receptor in marmoset tissues. Positive staining was observed in the small intestine (Bar = 250 µm) (A), mostly in the apical border of absorptive epithelial cells and at a low level in some epithelial cells of glands. Minimal staining in epithelial cells from the large intestine (Bar = 100 µm) (B). The positive staining in the trachea (Bar = 100 µm) (C), lung (Bar = 250 µm) (D), and respiratory nasal mucosa (Bar = 100 µm) (E) was almost non-existent. However, moderate positive staining was observed in glandular epithelium within the olfactory mucosa area of the nasal cavity (arrows and insert; Bar = 250 µm) (F). To the contrary, there was no staining in the epithelium lining or nerve terminations. Intense staining was observed in the kidney in the apical border of kidney tubular epithelial cells (arrows; Bar = 250 µm) (G) and moderate reaction in immune cells within the liver (Bar = 100 µm; arrows, normally extramedullary haematopoiesis) (H). No reaction was observed in the spleen (Bar = 250 µm) (I).
Figure 8
Figure 8
Representative images of IHC for TMPRSS2 in marmoset tissues. Strong reaction was observed in the small (Bar = 250 µm) (A) and large intestine (Bar = 100 µm) (B), mostly within immune cells within the mucosa (arrows), but also absorptive epithelial cells (a), smooth muscle (m), and few blood vessels. The staining within smooth muscle (m) can also be observed within the oesophagus (Bar = 100 µm) (C). Strong positive staining was also observed in some airway epithelial cells in the lung parenchyma (Bar = 100 µm) (D) (arrows), with less intensity in the alveoli and septa. In larger airways and upper respiratory tract (bronchi (Bar = 100 µm) (E) and trachea (Bar = 250 µm) (F)), moderate positivity can also be observed within the respiratory epithelium (arrows) and lamina propria (*).

References

    1. Cascella M., Rajnik M., Aleem A., Dulebohn S.C., Di Napoli R. StatPearls. StatPearls Publishing; Treasure Island, FL, USA: 2022. Features, Evaluation, and Treatment of Coronavirus (COVID-19) - PubMed
    1. Lechien J.R., Chiesa-Estomba C.M., De Siati D.R., Horoi M., Le Bon S.D., Rodriguez A., Dequanter D., Blecic S., El Afia F., Distinguin L., et al. Olfactory and gustatory dysfunctions as a clinical presentation of mild-to-moderate forms of the coronavirus disease (COVID-19): A multicenter European study. Eur. Arch. Otorhinolaryngol. 2020;277:2251–2261. doi: 10.1007/s00405-020-05965-1. - DOI - PMC - PubMed
    1. Huang C., Wang Y., Li X., Ren L., Zhao J., Hu Y., Zhang L., Fan G., Xu J., Gu X., et al. Clinical features of patients infected with 2019 novel coronavirus in Wuhan, China. Lancet. 2020;395:497–506. doi: 10.1016/S0140-6736(20)30183-5. - DOI - PMC - PubMed
    1. Mehta P., McAuley D.F., Brown M., Sanchez E., Tattersall R.S., Manson J.J. COVID-19: Consider cytokine storm syndromes and immunosuppression. Lancet. 2020;395:1033–1034. doi: 10.1016/S0140-6736(20)30628-0. - DOI - PMC - PubMed
    1. Wu Z., McGoogan J.M. Characteristics of and Important Lessons from the Coronavirus Disease 2019 (COVID-19) Outbreak in China: Summary of a Report of 72,314 Cases from the Chinese Center for Disease Control and Prevention. JAMA. 2020;323:1239–1242. doi: 10.1001/jama.2020.2648. - DOI - PubMed

Publication types

Substances