. 2022 Oct;48(6):e12838.
doi: 10.1111/nan.12838. Epub 2022 Aug 3.

DNA methylation profiling improves routine diagnosis of paediatric central nervous system tumours: A prospective population-based study

Affiliations

DNA methylation profiling improves routine diagnosis of paediatric central nervous system tumours: A prospective population-based study

Elizabeth Schepke et al. Neuropathol Appl Neurobiol. 2022 Oct.

Abstract

Aims: Paediatric brain tumours are rare, and establishing a precise diagnosis can be challenging. Analysis of DNA methylation profiles has been shown to be a reliable method to classify central nervous system (CNS) tumours with high accuracy. We aimed to prospectively analyse CNS tumours diagnosed in Sweden, to assess the clinical impact of adding DNA methylation-based classification to standard paediatric brain tumour diagnostics in an unselected cohort.

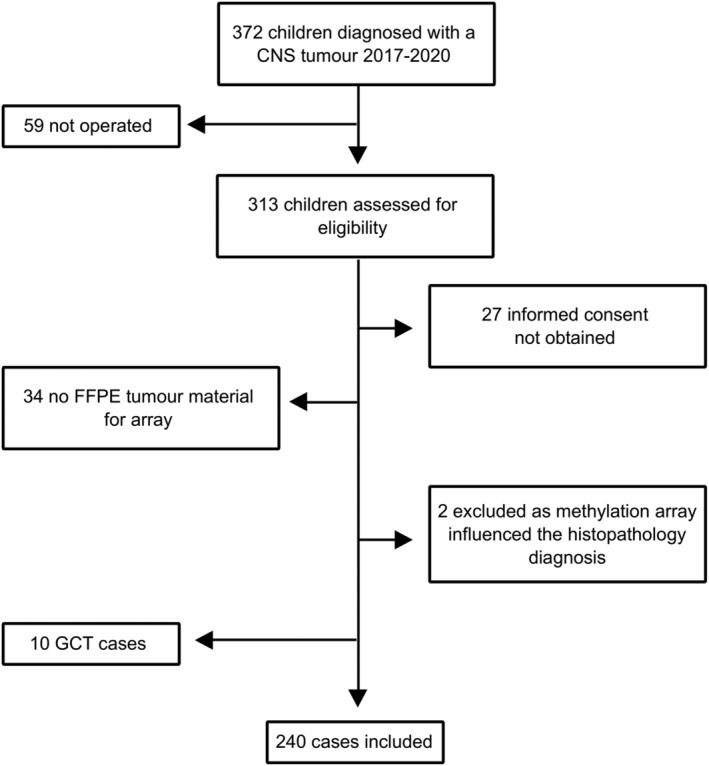
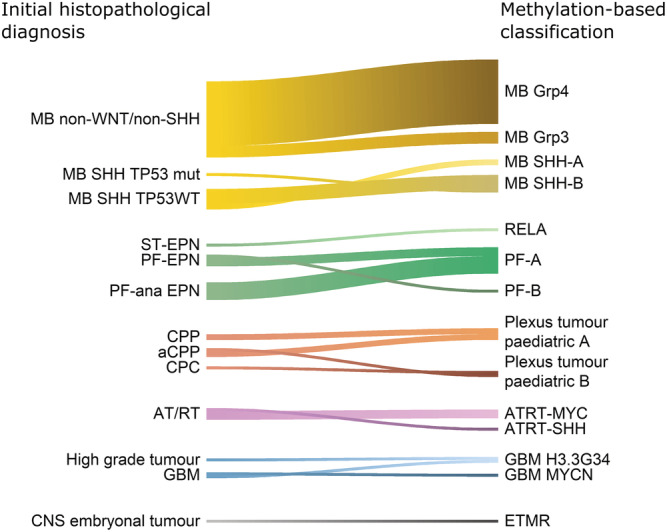
Methods: All CNS tumours diagnosed in children (0-18 years) during 2017-2020 were eligible for inclusion provided sufficient tumour material was available. Tumours were analysed using genome-wide DNA methylation profiling and classified by the MNP brain tumour classifier. The initial histopathological diagnosis was compared with the DNA methylation-based classification. For incongruent results, a blinded re-evaluation was performed by an experienced neuropathologist.

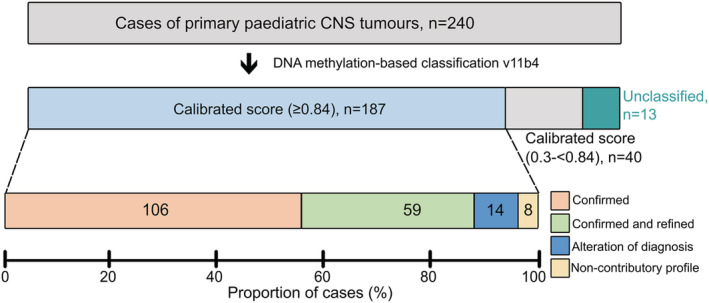
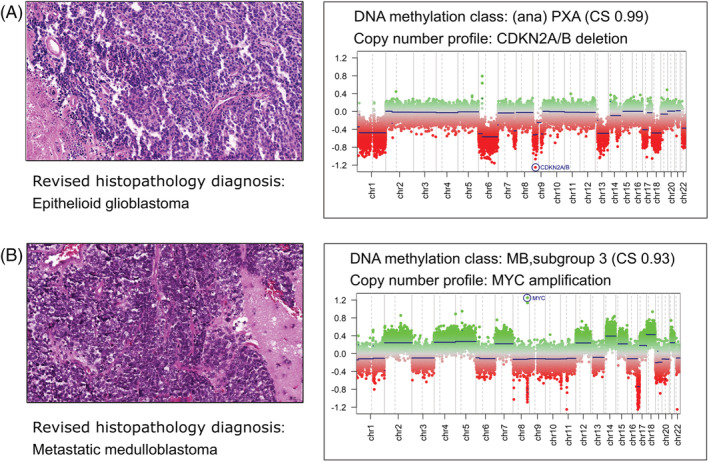
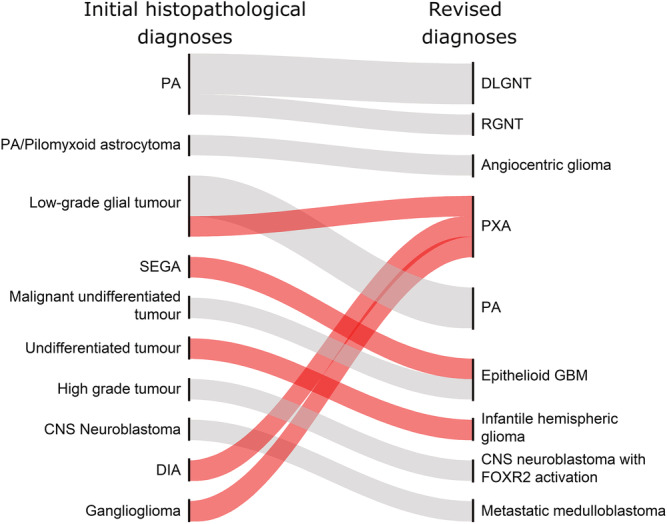
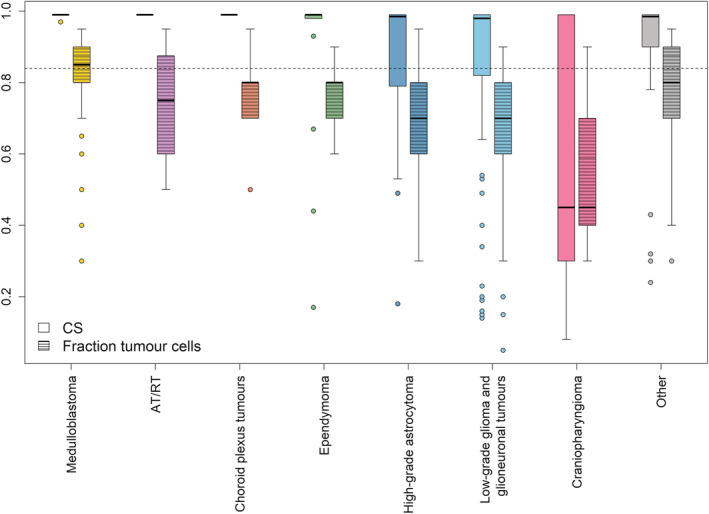
Results: Two hundred forty tumours with a histopathology-based diagnosis were profiled. A high-confidence methylation score of 0.84 or more was reached in 78% of the cases. In 69%, the histopathological diagnosis was confirmed, and for some of these also refined, 6% were incongruent, and the re-evaluation favoured the methylation-based classification. In the remaining 3% of cases, the methylation class was non-contributory. The change in diagnosis would have had a direct impact on the clinical management in 5% of all patients.

Conclusions: Integrating DNA methylation-based tumour classification into routine clinical analysis improves diagnostics and provides molecular information that is important for treatment decisions. The results from methylation profiling should be interpreted in the context of clinical and histopathological information.

Keywords: DNA methylation profiling; diagnostics; molecular classification; paediatric brain tumours.


Conflict of interest statement

SMP declare patent PCT/EP2016/055337 DNA‐methylation‐based method for classifying tumour species. All other authors have no conflicts of interest to report.

Figures

FIGURE 1
FIGURE 1
Cohort description. FFPE = formalin‐fixed paraffin‐embedded, GCT = germ cell tumour.
FIGURE 2
FIGURE 2
Result of DNA methylation classification of paediatric central nervous system (CNS) tumours. Of the 240 profiled cases, 187 tumours (78%) were classified with a high calibration score ≥0.84. The diagnostic impact of methylation profiling on the initial histopathological diagnosis was categorised into Diagnostic (I) confirmation (light pink); (II) confirmed and refined diagnosis (light green); (III) alteration of diagnosis (blue); (IV) non‐contributory profile (yellow); (V) low calibrated scores (grey); and (VI) unclassified (turquoise).
FIGURE 3
FIGURE 3
Refinement of diagnosis by methylation profiling in 59 tumours with varying initial histological diagnoses (WHO 2016) (left) and corresponding methylation classes (right). MB, medulloblastoma (n = 34); MB Grp4, subgroup 4 (n = 22); MB Grp3, subgroup 3 (n = 4); MB‐SHH‐A, medulloblastoma sonic hedgehog child and adolescent group (n = 2); MB‐SHH‐B, medulloblastoma sonic hedgehog infant group (n = 6); ST‐EPN, supratentorial ependymoma (n = 1); PF‐EPN, posterior fossa ependymoma (n = 4); PF‐ana EPN, anaplastic ependymoma in posterior fossa (n = 6); RELA, RELA‐fusion positive ependymoma (n = 1); PF‐A, posterior fossa ependymoma subgroup A (n = 9); PF‐B, posterior fossa ependymoma subgroup B (n = 1); CPP, choroid plexus papilloma (n = 2); aCPP, atypical choroid plexus papilloma (n = 3); CPC, choroid plexus carcinoma (n = 1); AT/RT, atypical teratoid/rhabdoid tumour (n = 4); AT/RT‐MYC, subclass MYC (n = 3); AT/RT‐SHH, subclass SHH (n = 1); GBM, glioblastoma (n = 2); GBM H3.3 G34, glioblastoma with H3F3A G34 mutation (n = 1); GBM MYCN, glioblastoma IDH wildtype subclass MYCN (n = 1); ETMR, embryonal tumour with multi‐layered rosettes (n = 1)
FIGURE 4
FIGURE 4
Histopathology and copy number variation (CNV) plots for two cases with revised diagnosis. (A) Case 10 (Table 2) a revised histopathology diagnosis of epithelioid glioblastoma (haematoxylin and eosin stain [H&E]) and the methylation class and CNV plot corresponding to an (anaplastic) pleomorphic xanthoastrocytoma (PXA). (B) Case 12 (Table 2) with the initial diagnosis favouring CNS neuroblastoma with the DNA methylation class medulloblastoma, group 3 and CNV plot with MYC amplification. The revised histopathology diagnosis was a metastatic medulloblastoma.
FIGURE 5
FIGURE 5
Change of World Health Organisation (WHO) grading for the 14 revised cases. Initial histopathological diagnoses (left) and the revised diagnoses (right) after blinded re‐evaluation. PA, pilocytic astrocytoma; DLGNT, diffuse leptomeningeal glioneuronal tumour; RGNT, rosette forming glioneuronal tumour; PXA, pleomorphic xanthoastrocytoma; SEGA, subependymal giant cell astrocytoma; GBM, glioblastoma; DIA, desmoplastic infantile astrocytoma and ganglioglioma. WHO grading changes are shown in red (escalated). Grey represents unchanged grading.
FIGURE 6
FIGURE 6
For each tumour type, boxplots are shown for DNA methylation calibrated score (CS) and for proportion of tumour cells in samples. The dotted line shows the 0.84 CS threshold. Upper and lower hinges of the box represent the 75th percentile and 25th percentile, respectively; whiskers indicate the highest and lowest values that are not outliers; thick horizontal line within the box, median. Open circles represent outliers. The tumour cell content was estimated based on haematoxylin and eosin‐stained slides.

References

    1. Louis DN, Ohgaki H, Wiestler OD, Cavenee WK. WHO Classification of Tumours of the Central Nervous System. 4thed. International Agency for Research on Cancer (Lyon); 2016.
    1. Ellison DW, Kocak M, Figarella‐Branger D, et al. Histopathological grading of pediatric ependymoma: reproducibility and clinical relevance in European trial cohorts. J Negat Results Biomed. May 31, 2011;10:7. doi: 10.1186/1477-5751-10-7 - DOI - PMC - PubMed
    1. van den Bent MJ. Interobserver variation of the histopathological diagnosis in clinical trials on glioma: a clinician's perspective. Acta Neuropathol. Sep 2010;120(3):297‐304. doi: 10.1007/s00401-010-0725-7 - DOI - PMC - PubMed
    1. Gustafsson G, Kogner P, Heyman M. Childhood cancer incidence and survival in Sweden 1984‐2010, Report 2013:2013.
    1. Lannering B, Sandstrom PE, Holm S, et al. Classification, incidence and survival analyses of children with CNS tumours diagnosed in Sweden 1984‐2005. Acta Paediatr. Oct 2009;98(10):1620‐1627. doi: 10.1111/j.1651-2227.2009.01417.x - DOI - PubMed

Publication types