

A Simplified Murine Model to Imitate Flexor Tendon Adhesion Formation without Suture
- PMID: 35892362
- PMCID: PMC9326731
- DOI: 10.3390/biomimetics7030092
A Simplified Murine Model to Imitate Flexor Tendon Adhesion Formation without Suture
Abstract
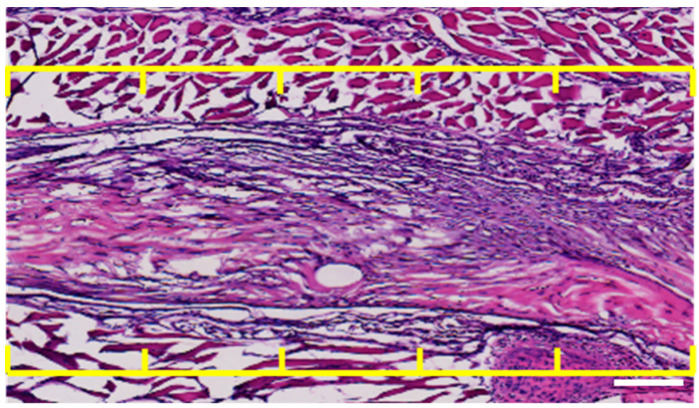
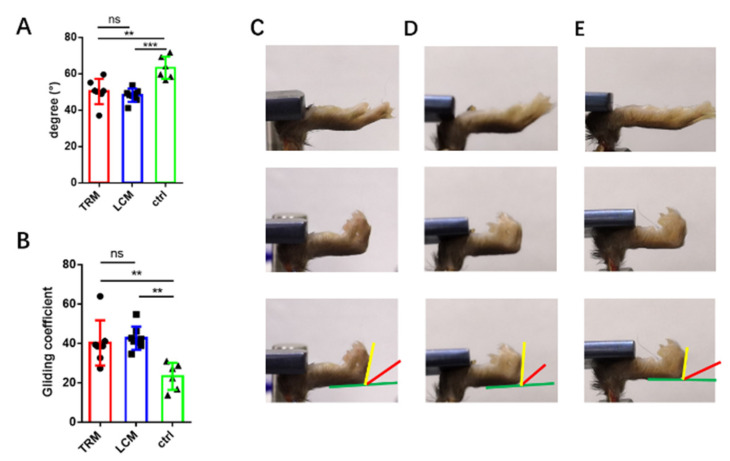
Peritendinous adhesion (PA) around tendons are daunting challenges for hand surgeons. Tenotomy with various sutures are considered classical tendon repair models (TRM) of tendon adhesion as well as tendon healing. However, potential biomimetic therapies such as anti-adhesion barriers and artificial tendon sheaths to avoid recurrence of PA are sometimes tested in these models without considering tendon healing. Thus, our aim is to create a simplified model without sutures in this study by using three 6 mm longitudinal and parallel incisions called the longitudinal incision model (LCM) in the murine flexor tendon. We found that the adhesion score of LCM has no significant difference to that in TRM. The range of motion (ROM) reveals similar adhesion formation in both TRM and LCM groups. Moreover, mRNA expression levels of collagen I and III in LCM shows no significant difference to that in TRM. The breaking force and stiffness of LCM were significantly higher than that of TRM. Therefore, LCM can imitate flexor tendon adhesion formation without sutures compared to TRM, without significant side effects on biomechanics with an easy operation.
Keywords: biomechanics; collagen deposition; flexor tendon; tendon adhesion.
Conflict of interest statement
The authors declare no conflict of interest.
Figures


Similar articles
-
The effect of a collagen-elastin matrix on adhesion formation after flexor tendon repair in a rabbit model.Arch Orthop Trauma Surg. 2016 Jul;136(7):1021-9. doi: 10.1007/s00402-016-2472-2. Epub 2016 May 9. Arch Orthop Trauma Surg. 2016. PMID: 27161378
-
Effects of PDGF-BB delivery from heparinized collagen sutures on the healing of lacerated chicken flexor tendon in vivo.Acta Biomater. 2017 Nov;63:200-209. doi: 10.1016/j.actbio.2017.09.006. Epub 2017 Sep 7. Acta Biomater. 2017. PMID: 28890257 Free PMC article.
-
Four-Strand Core Suture Improves Flexor Tendon Repair Compared to Two-Strand Technique in a Rabbit Model.Biomed Res Int. 2016;2016:4063137. doi: 10.1155/2016/4063137. Epub 2016 Jun 30. Biomed Res Int. 2016. PMID: 27446949 Free PMC article.
-
[Current techniques for primary flexor tendon repair].Chir Main. 2002 Jul;21(4):218-24. doi: 10.1016/s1297-3203(02)00116-6. Chir Main. 2002. PMID: 12357687 Review. French.
-
Flexor Tendon Repair: Healing, Biomechanics, and Suture Configurations.Orthop Clin North Am. 2016 Jan;47(1):219-26. doi: 10.1016/j.ocl.2015.08.019. Orthop Clin North Am. 2016. PMID: 26614935 Review.
References
-
- Hasslund S., Jacobson J.A., Dadali T., Basile P., Ulrich-Vinther M., Søballe K., Schwarz E.M., O’Keefe R.J., Mitten D.J., Awad H.A. Adhesions in a murine flexor tendon graft model: Autograft versus allograft reconstruction. J. Orthop. Res. 2008;26:824–833. doi: 10.1002/jor.20531. - DOI - PMC - PubMed
-
- Loiselle A.E., Frisch B.J., Wolenski M., Jacobson J.A., Calvi L.M., Schwarz E.M., Awad H.A., O’Keefe R.J. Bone Marrow-Derived Matrix Metalloproteinase-9 Is Associated with Fibrous Adhesion Formation after Murine Flexor Tendon Injury. PLoS ONE. 2012;7:e40602. doi: 10.1371/journal.pone.0040602. - DOI - PMC - PubMed
Grants and funding
- 82172408/National Natural Science Foundation of China
- 81772314/National Natural Science Foundation of China
- 81922045/National Natural Science Foundation of China
- 22ZR1480300/Original Exploration project
- 21XD1422900/Outstanding Academic Leaders (Youth) project
- No.20191829/Principle Investigator Innovation Team of Both Shanghai Sixth People's Hospital and Shanghai Institute of Nutrition and Health, Shanghai Jiao Tong University Medical College "Two-hundred Talent" Program
- No.SHDC2020CR4032/The Second Three-Year Action Plan for Promoting Clinical Skills and Clinical Innovation in Municipal Hospitals of Shanghai Shenkang
- No.20DZ2254100/Shanghai Excellent Academic Leader Program; and Shanghai Engineering Research Center for Orthopaedic Material Innovation and Tissue Regeneration
- QF 1918/"Qingfeng Scholar" for student Scientific Research Program of Shanghai Medical College, Fudan University
LinkOut - more resources
Full Text Sources
