

Blood Culture Headspace Gas Analysis Enables Early Detection of Escherichia coli Bacteremia in an Animal Model of Sepsis
- PMID: 35892382
- PMCID: PMC9331843
- DOI: 10.3390/antibiotics11080992
Blood Culture Headspace Gas Analysis Enables Early Detection of Escherichia coli Bacteremia in an Animal Model of Sepsis
Abstract
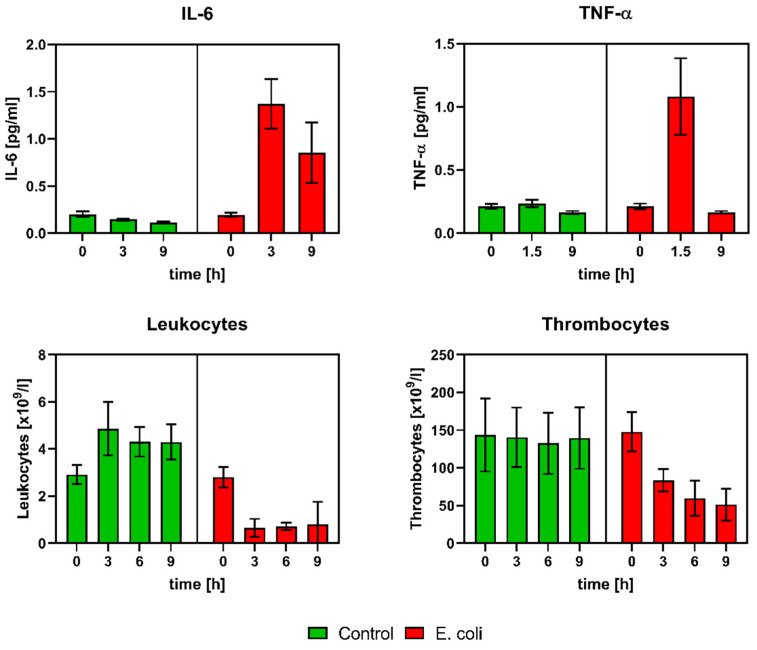
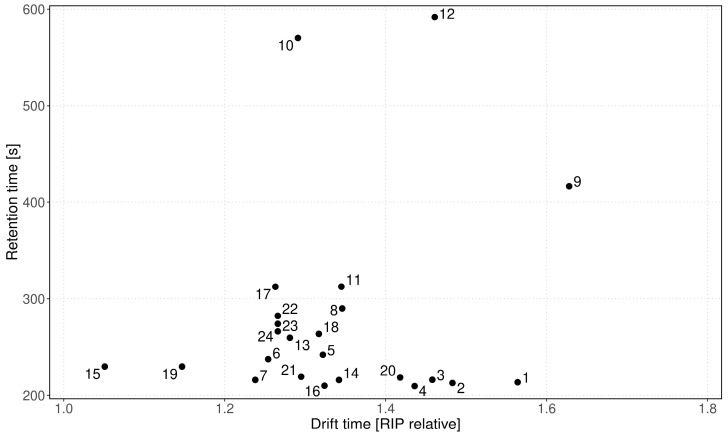
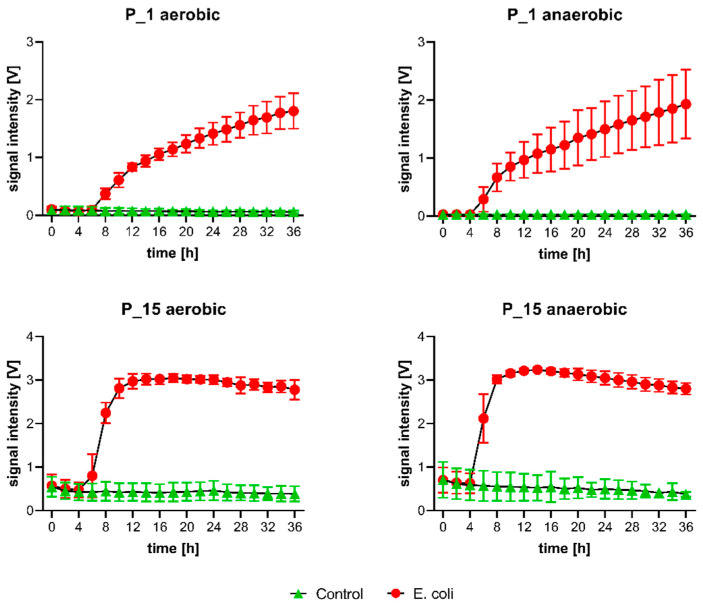
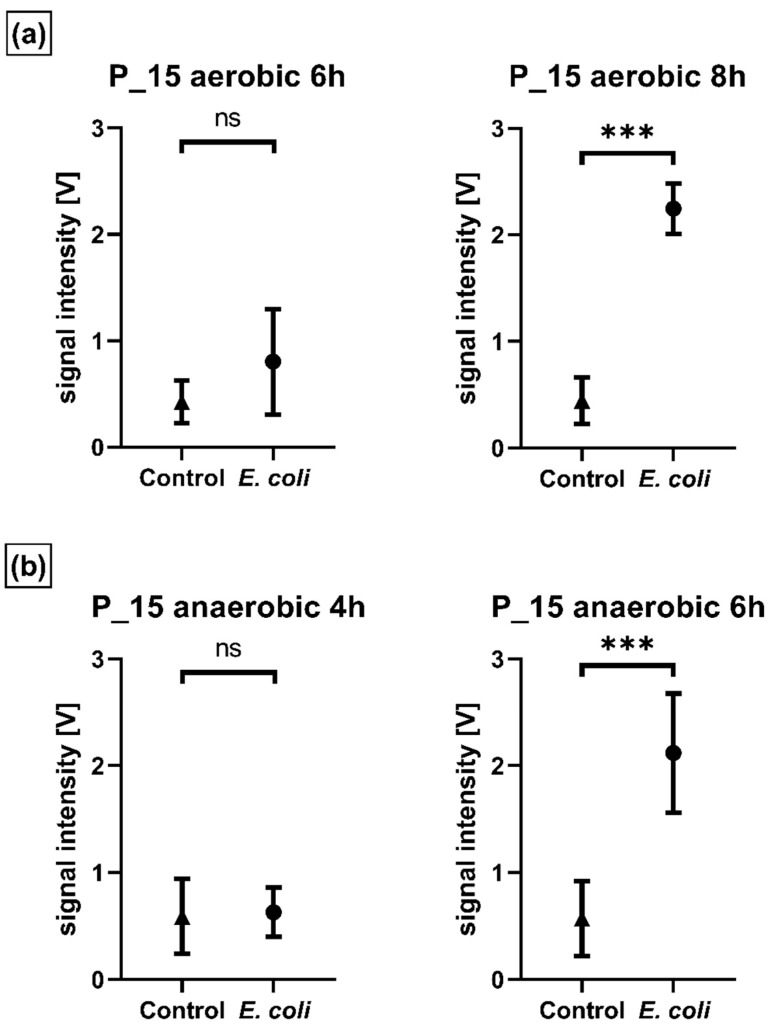
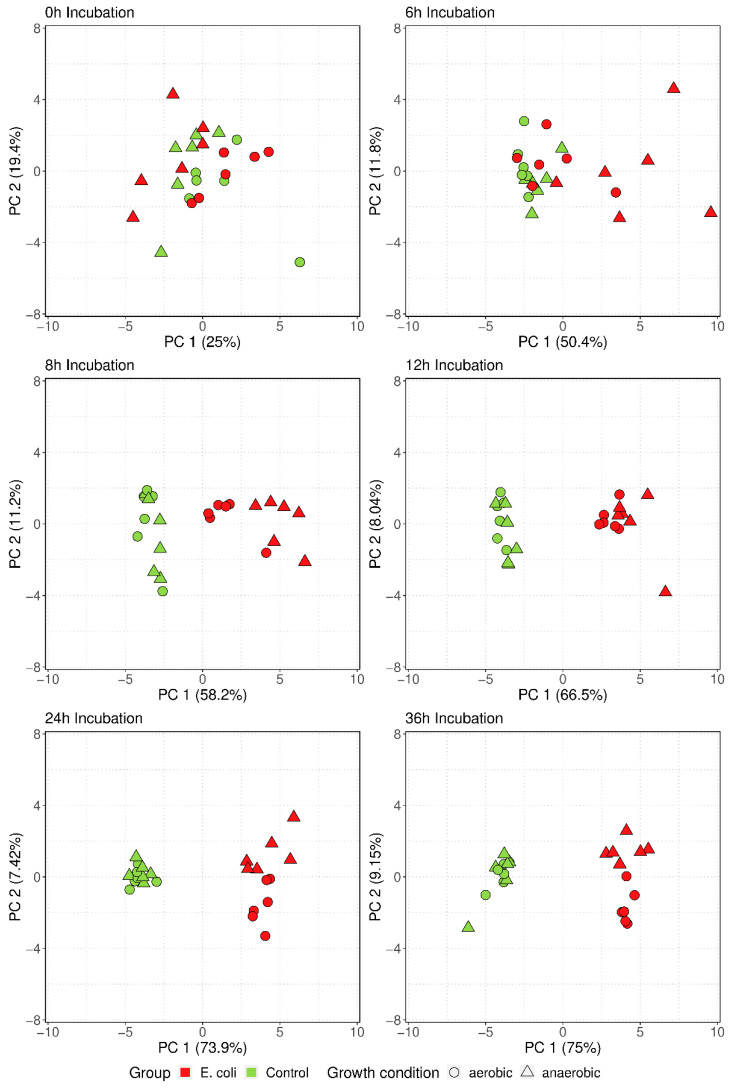
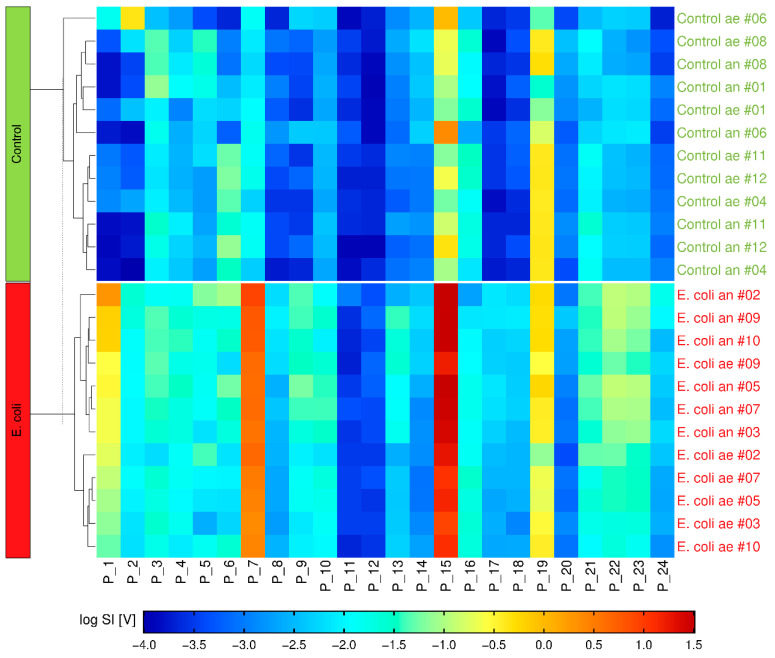
(1) Background: Automated blood culture headspace analysis for the detection of volatile organic compounds of microbial origin (mVOC) could be a non-invasive method for bedside rapid pathogen identification. We investigated whether analyzing the gaseous headspace of blood culture (BC) bottles through gas chromatography-ion mobility spectrometry (GC-IMS) enables differentiation of infected and non-infected; (2) Methods: BC were gained out of a rabbit model, with sepsis induced by intravenous administration of E. coli (EC group; n = 6) and control group (n = 6) receiving sterile LB medium intravenously. After 10 h, a pair of blood cultures was obtained and incubated for 36 h. The headspace from aerobic and anaerobic BC was sampled every two hours using an autosampler and analyzed using a GC-IMS device. MALDI-TOF MS was performed to confirm or exclude microbial growth in BCs; (3) Results: Signal intensities (SI) of 113 mVOC peak regions were statistically analyzed. In 24 regions, the SI trends differed between the groups and were considered to be useful for differentiation. The principal component analysis showed differentiation between EC and control group after 6 h, with 62.2% of the data variance described by the principal components 1 and 2. Single peak regions, for example peak region P_15, show significant SI differences after 6 h in the anaerobic environment (p < 0.001) and after 8 h in the aerobic environment (p < 0.001); (4) Conclusions: The results are promising and warrant further evaluation in studies with an extended microbial panel and indications concerning its transferability to human samples.
Keywords: bacteremia; bloodstream infections; gas chromatography-ion mobility spectrometry (GC-IMS); microbial diagnostics; rapid pathogen identification; volatile organic compounds (VOCs).
Conflict of interest statement
The authors declare no conflict of interest.
Figures
References
-
- Singer M., Deutschman C.S., Seymour C.W., Shankar-Hari M., Annane D., Bauer M., Bellomo R., Bernard G.R., Chiche J.-D., Coopersmith C.M., et al. The Third International Consensus Definitions for Sepsis and Septic Shock (Sepsis-3) JAMA. 2016;315:801–810. doi: 10.1001/jama.2016.0287. - DOI - PMC - PubMed
-
- Kumar A., Roberts D., Wood K.E., Light B., Parrillo J.E., Sharma S., Suppes R., Feinstein D., Zanotti S., Taiberg L., et al. Duration of hypotension before initiation of effective antimicrobial therapy is the critical determinant of survival in human septic shock. Crit. Care Med. 2006;34:1589–1596. doi: 10.1097/01.CCM.0000217961.75225.E9. - DOI - PubMed
Grants and funding
LinkOut - more resources
Full Text Sources
Molecular Biology Databases
Miscellaneous
