. 2022 Jul 24;12(8):1792.
doi: 10.3390/diagnostics12081792.

A Criterion of Colorectal Cancer Diagnosis Using Exosome Fluorescence-Lifetime Imaging

Affiliations

A Criterion of Colorectal Cancer Diagnosis Using Exosome Fluorescence-Lifetime Imaging

Alexey V Borisov et al. Diagnostics (Basel). .

Abstract

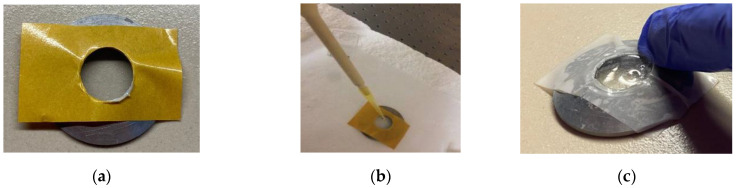
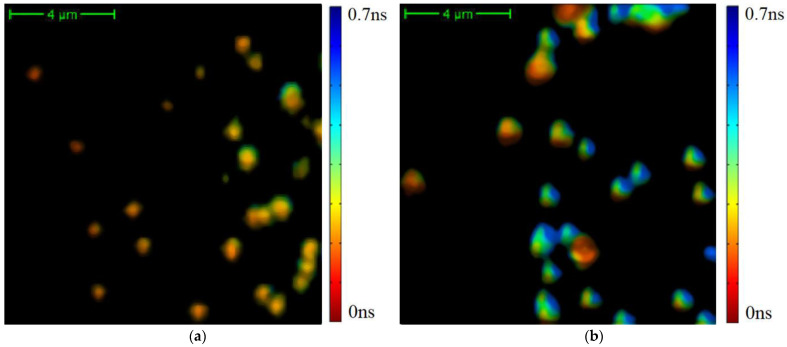
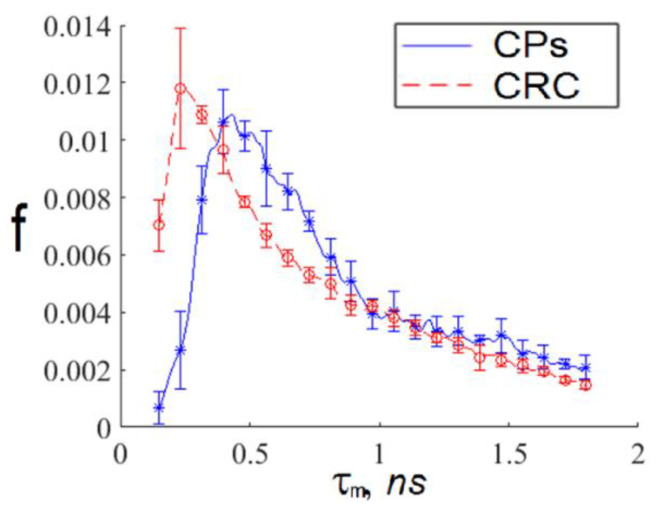
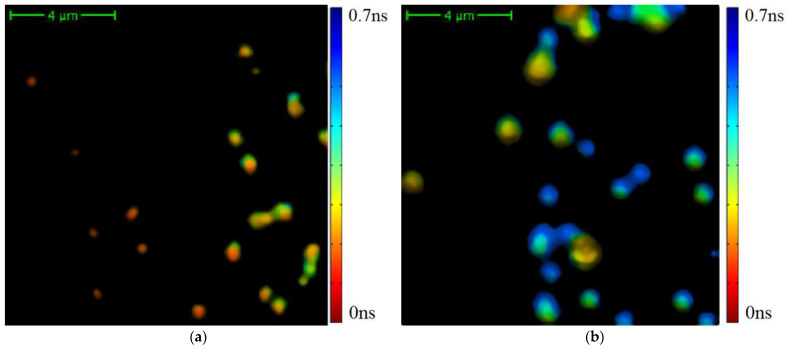
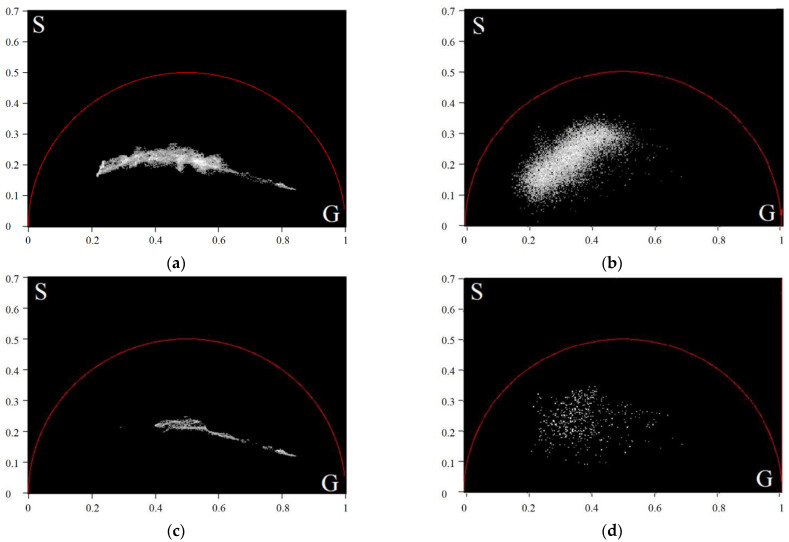
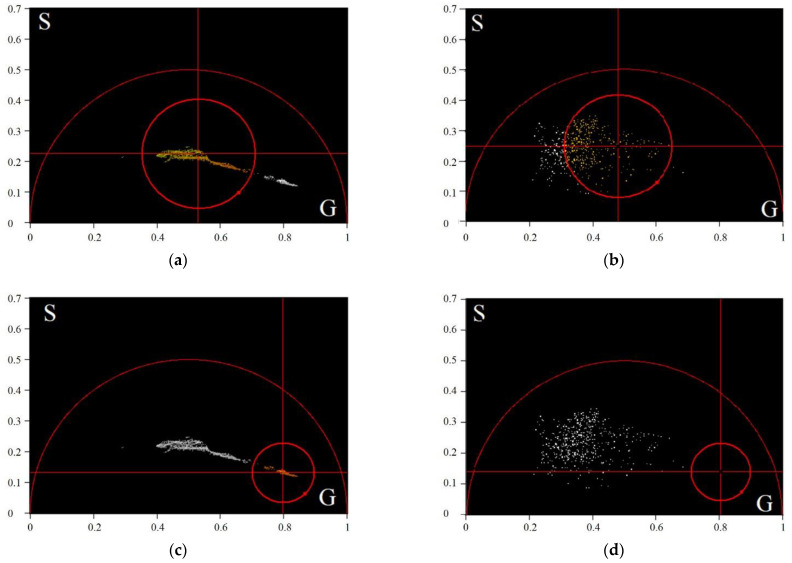
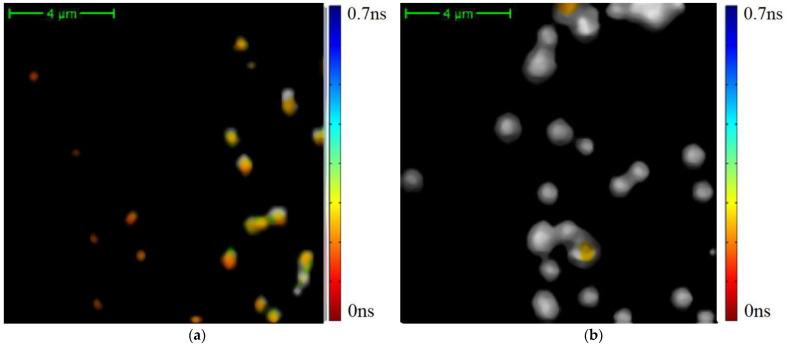
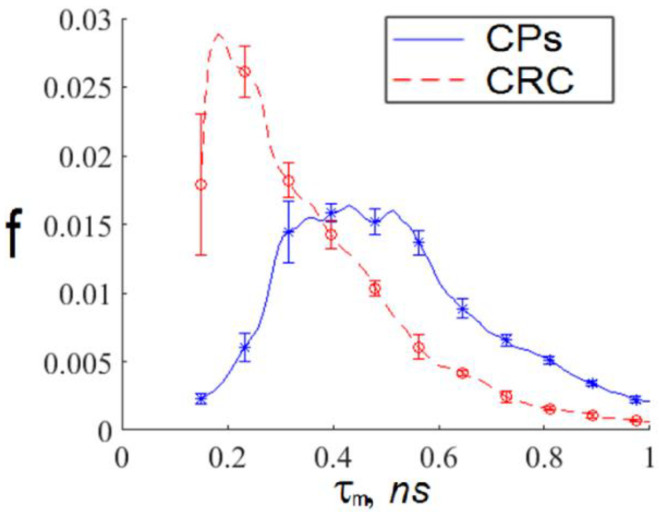
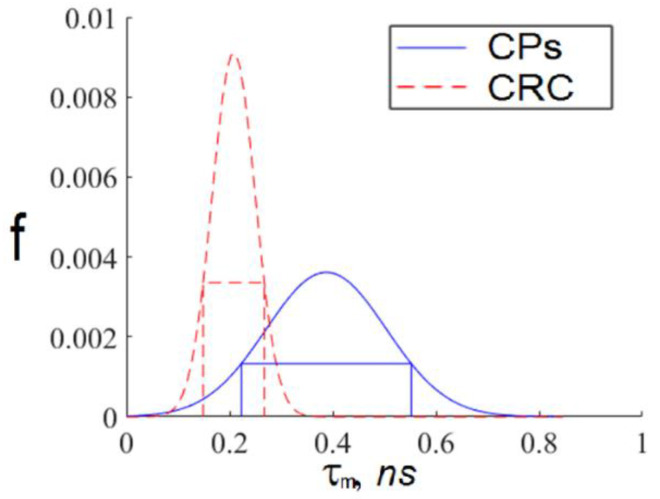
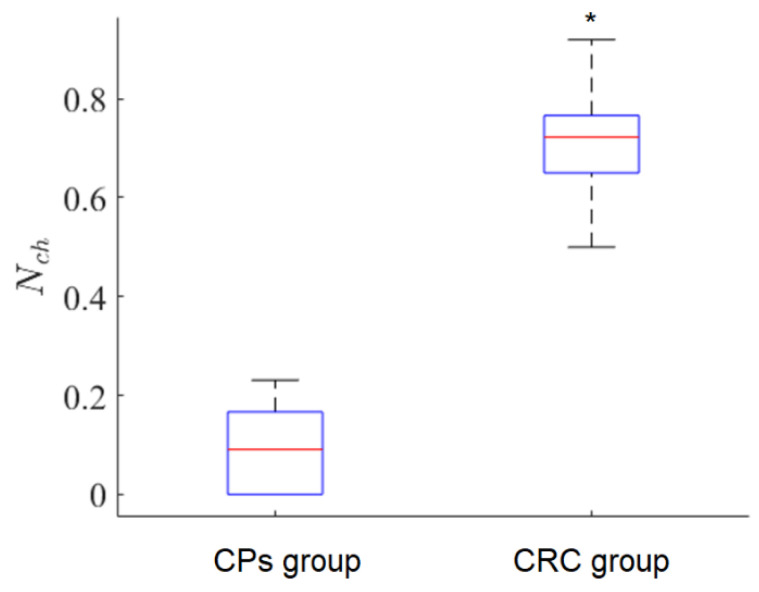
This study was aimed to investigate the applicability of the exosome fluorescence-lifetime imaging microscopy (FLIM) for colorectal cancer (CRC) diagnosis. Differential ultra-centrifugation was used to extract exosomes from the blood plasma of 11 patients with colon polyps (CPs) and 13 patients with CRC at the T2-4, N0-3, and M0-1 stages. Analysis was performed using a two-photon FLIM device. In total, 165 and 195 FLIM images were recorded for the CP and CCR patient groups, respectively. Two classes of exosomes differentiated by autofluorescence average lifetime tm were discovered in the samples. The first class of exosomes with tm = (0.21 ± 0.06) ns was mostly found in samples from CRC patients. The second class with tm = (0.43 ± 0.19) ns was mostly found in samples from CP patients. The relative number of “CRC-associated” exosomes Nch in the FLIM dataset was shown to be very small for the CP patient group and large for the CRC patient group. This difference was statistically significant. Therefore, the suggested CRS diagnostics criterion can be as follows. If Nch > 0.5, the probability of CRC is high. If Nch < 0.3, the probability of CRC is low.

Keywords: colorectal cancer; exosomes; fluorescence-lifetime imaging microscopy; two-photon exited autofluorescence.


Conflict of interest statement

The authors declare no conflict of interest.

Figures

Figure 1
Figure 1
An illustration of an exosome sample process prepared for MPTflex microscope analysis: photographs of a glass plate with adhesive tape (a), the process of the exosome sample’s positioning on the glass plate (b), and this construction being covered from above with another glass plate (c).
Figure 2
Figure 2
Examples of average TPAF lifetime tm images of an exosome sample registered by MPTflex microscope for randomly selected CRC (a) and CP patients (b). The color characterizes tm values according to the presented legend.
Figure 3
Figure 3
The average TPAF lifetime tm distributions, normalized on an area under the curve, for images of the exosome samples presented in Figure 2. Notations on the legend: CPs—the exosome sample from the randomly selected CRC patient; CRC—the exosome sample from the randomly selected CP patient. The tm  distribution mean values and standard deviations were calculated by tm value-averaging over images presented in Figure 2a,b.
Figure 4
Figure 4
The results of the average TPAF lifetime tm image of exosome samples processed by a cutting filter: the image for the CRC patient (a) and the image the CP patient (b). The cutting filter had a threshold of 800 photons per pixel. The corresponding unprocessed images are presented in Figure 2.
Figure 5
Figure 5
The phasor plots of the average TPAF lifetime tm images of the exosome samples for a CRC patient before (a) and after (b) the cutting filter processing; (cd)—The same for a CP patient. The cutting filter had a threshold of 800 photons per pixel.
Figure 6
Figure 6
The class areas on phasor plots of the average TPAF lifetime tm images of the exosome samples presented in Figure 5: the first class position on the phasor plot for the CRC patient (a) and the CP patient (b), the second class position on the phasor plot for the CRC patient (c) and the CP patient (d). The first class parameters: gc,1= 0.80, sc,1= 0.14, and R1= 0.51; the second class parameters: gc,2= 0.53, sc,2= 0.23, and R2= 0.71. Here, gc,j, sc,j, and Rj are coordinates of the center and radius of the jth class.
Figure 7
Figure 7
The differentiation of exosomes on the classes described by Formulas (6) and (7). Here, color data points correspond to the exosomes with short average TPAF lifetimes and gray data points correspond to the exosomes with long average TPAF lifetimes. These images are presented unprocessed in Figure 4.
Figure 8
Figure 8
The average TPAF lifetime tm distributions for of the exosome samples, normalized on an area under the curve, for the whole dataset processed by the cutting filter with a threshold of 800 photons per pixel and the circle masks described by Formulas (6) and (7) in a phasor plane. Notations on the legend: CPs—the exosome samples from the whole CRC patient group; CRC—the exosome samples from the whole CP patient group. The tm  distribution mean values and standard deviations were calculated by tm value-averaging over images presented in Figure 7a,b.
Figure 9
Figure 9
Interval approximations of the distribution functions of the short and long average TPAF lifetimes presented in Figure 8. These curves were calculated using Gaussian approximation of the data presented in Table 1. Notations on the legend: CPs—the exosome samples from the whole CRC patient group; CRC—the exosome samples from the whole CP patient group.
Figure 10
Figure 10
A box diagram for Nch values for CP and CRC patient groups, * p-value is 3.35·105. Here, Nch is the relative number of CRC-associated exosomes in the FLIM dataset calculated according to Formula (8).

Similar articles

Cited by

References

    1. Sung H., Ferlay J., Siegel R.L., Laversanne M., Soerjomataram I., Jemal A., Bray F. Global Cancer Statistics 2020: GLOBOCAN Estimates of Incidence and Mortality Worldwide for 36 Cancers in 185 Countries. CA Cancer J. Clin. 2021;71:209–249. doi: 10.3322/caac.21660. - DOI - PubMed
    1. Hossain M.S., Karuniawati H., Jairoun A.A., Urbi Z., Ooi J., John A., Lim Y.C., Kibria K.M.K., Mohiuddin A.K.M., Ming L.C., et al. Colorectal Cancer: A Review of Carcinogenesis, Global Epidemiology, Current Challenges, Risk Factors, Preventive and Treatment Strategies. Cancers. 2022;14:1732. doi: 10.3390/cancers14071732. - DOI - PMC - PubMed
    1. Rawla P., Sunkara T., Barsouk A. Epidemiology of colorectal cancer: Incidence, mortality, survival, and risk factors. Gastroenterology. 2019;14:89–103. doi: 10.5114/pg.2018.81072. - DOI - PMC - PubMed
    1. Haggar F.A., Boushey R.P. Colorectal Cancer Epidemiology: Incidence, Mortality, Survival, and Risk Factors. Clin. Colon Rectal Surg. 2009;22:191–197. doi: 10.1055/s-0029-1242458. - DOI - PMC - PubMed
    1. Ebell M.H., Thai T.N., Royalty K.J. Cancer screening recommendations: An international comparison of high income countries. Public Health Rev. 2018;39:7. doi: 10.1186/s40985-018-0080-0. - DOI - PMC - PubMed

LinkOut - more resources