. 2022 Jul 22;11(15):2269.
doi: 10.3390/cells11152269.

A 3D In Vivo Model for Studying Human Renal Cystic Tissue and Mouse Kidney Slices

Affiliations

A 3D In Vivo Model for Studying Human Renal Cystic Tissue and Mouse Kidney Slices

Eva-Marie Bichlmayer et al. Cells. .

Abstract

(1) Background: Autosomal dominant polycystic kidney disease (ADPKD) is a frequent monogenic disorder that leads to progressive renal cyst growth and renal failure. Strategies to inhibit cyst growth in non-human cyst models have often failed in clinical trials. There is a significant need for models that enable studies of human cyst growth and drug trials. (2) Methods: Renal tissue from ADPKD patients who received a nephrectomy as well as adult mouse kidney slices were cultured on a chorioallantoic membrane (CAM) for one week. The cyst volume was monitored by microscopic and CT-based applications. The weight and angiogenesis were quantified. Morphometric and histological analyses were performed after the removal of the tissues from the CAM. (3) Results: The mouse and human renal tissue mostly remained vital for about one week on the CAM. The growth of cystic tissue was evaluated using microscopic and CT-based volume measurements, which correlated with weight and an increase in angiogenesis, and was accompanied by cyst cell proliferation. (4) Conclusions: The CAM model might bridge the gap between animal studies and clinical trials of human cyst growth, and provide a drug-testing platform for the inhibition of cyst enlargement. Real-time analyses of mouse kidney tissue may provide insights into renal physiology and reduce the need for animal experiments.

Keywords: 3D in vivo model; ADPKD; chorioallantoic membrane (CAM) model; human renal cystic tissue; mouse kidney slices; polycystic kidney disease.


Conflict of interest statement

The authors declare no conflict of interest.

Figures

Figure 1
Figure 1
Schematic depiction of the chorioallantoic membrane (CAM) model protocol for the investigation of human renal cystic tissue and mouse kidney slices.
Figure 2
Figure 2
Workflow from the nephrectomy to the engraftment on the 3D in vivo model; (a) entire human kidney from a patient suffering from ADPKD; (b) dissection of capsula adiposa; (c,d) dissected cystic tissue; and (e) renal cystic tissue implanted on the CAM.
Figure 3
Figure 3
Definition of regions of interest (ROIs) in the CAM assay application. The first ROI (ROI 1) was defined as the total CAM with the engrafted cystic tissue samples. The second ROI (ROI 2) only contained the cystic tissue. The values of ROI 2 were subtracted from the results of ROI 1 to ensure that false positive vessel detections in the cystic tissue were excluded from the analysis.
Figure 4
Figure 4
Mouse renal tissue on the CAM; (a) kidney slice after engraftment; (b) covering of the tissue with a piece of fleece; (c) kidney slice covered with fleece; and (d) kidney slice with surrounding CAM and distinct blood vessels after removal. (▲: CAM with blood vessels; ★: kidney slice; ●: fleece).
Figure 5
Figure 5
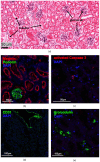
Histological and immunofluorescence analyses of kidney slices after removal from the CAM; (a) H&E staining; (b) proximal tubules and podocytes stained with megalin (red) and podocin (green), respectively; (c) only single apoptotic-activated caspase 3-positive cells could be detected; (d) detection of CD31 in renal vessels; (e) uromodulin- and (f) Na/Ca exchanger-positive cells showed damage, while (g) aquaporin 2-positive cells were preserved. Nuclei were stained with DAPI (blue).
Figure 5
Figure 5
Histological and immunofluorescence analyses of kidney slices after removal from the CAM; (a) H&E staining; (b) proximal tubules and podocytes stained with megalin (red) and podocin (green), respectively; (c) only single apoptotic-activated caspase 3-positive cells could be detected; (d) detection of CD31 in renal vessels; (e) uromodulin- and (f) Na/Ca exchanger-positive cells showed damage, while (g) aquaporin 2-positive cells were preserved. Nuclei were stained with DAPI (blue).
Figure 6
Figure 6
Angiogenesis measurements. Microscopic pictures of the CAM with renal cystic tissue after engraftment (a) and before removal (b). Monochrome intensity images of the same tissue (c,d) and LSCI perfusion images (e,f) (a color bar illustrates the perfusion scale) five days after engraftment (c,e) and on the day of removal (d,f). The diagram (g) shows an increase in the perfusion of three different cystic tissues between the two measurement days (n = 3).
Figure 7
Figure 7
Analysis of the angiogenesis induced by renal cystic tissue on the CAM using the CAM assay application v3.0.0 and microscopic images taken with the Leica M205A microscope after the engraftment of the renal cystic tissue ((a), left) and prior to the removal ((b), left). Blood vessels which are marked blue in the microscopic images were recognized by the algorithm ((a,b), right). Analysis of the blood vessels of the CAM (c) showed an increase in the total vessel length during the experiments (n = 4). Quantification of the number of branching points (d) showed an increase in vessel ramification after one week of growth on the CAM (n = 4).
Figure 8
Figure 8
Three-dimensional volume measurements. Measurement of cystic tissue before engraftment (a) and after removal from the CAM (b) using a Keyence VHX-7000 microscope, including 2D and 3D images of the cystic tissue with volume measurements of the manually defined structure of interest. Linear regression analysis of weight (mg) obtained with a precision balance and volume (mm3) obtained with 3D microscopy of the cystic tissues before engraftment and after removal (c,d). Each point represents a single measurement of weight and volume obtained from three nephrectomies (n = 66). The calculated linear regression is depicted by the continuous line. Microscopic image of the bottom of a cystic tissue (f) with visible newly formed cysts magnified in (g,e) and marked with yellow color.
Figure 8
Figure 8
Three-dimensional volume measurements. Measurement of cystic tissue before engraftment (a) and after removal from the CAM (b) using a Keyence VHX-7000 microscope, including 2D and 3D images of the cystic tissue with volume measurements of the manually defined structure of interest. Linear regression analysis of weight (mg) obtained with a precision balance and volume (mm3) obtained with 3D microscopy of the cystic tissues before engraftment and after removal (c,d). Each point represents a single measurement of weight and volume obtained from three nephrectomies (n = 66). The calculated linear regression is depicted by the continuous line. Microscopic image of the bottom of a cystic tissue (f) with visible newly formed cysts magnified in (g,e) and marked with yellow color.
Figure 9
Figure 9
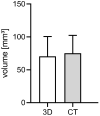
Comparison of ex ovo and in ovo measured volumetric data after engraftment. For a comparison of the CT-based volume measurement method (grey bar) to the three-dimensional microscopic measurement method (white bar), data from three nephrectomies were evaluated (n = 36).
Figure 10
Figure 10
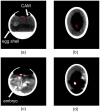
CT-based volume measurement of a cystic tissue depicted in the cyst window (n = 36). The cystic tissue is marked by the red border in each image. The chicken egg with engrafted cystic tissue is shown one day after engraftment in the transverse (a) and coronal (b) planes without any signs of calcifications. A significant increase in hyperdense structures in the cystic tissue was visible in the transverse (c) and coronal (d) planes of the second measurement, which took place hours before removal of the cystic tissue.
Figure 11
Figure 11
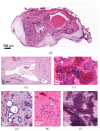
Representative H&E staining of human cystic tissue after removal from the CAM; (a) overview showing cystic tissue with two bigger cysts within the renal tissue surrounded by the CAM; (b) cyst with a typically flat epithelium and intraluminal debris; (c) accumulation of erythrocytes in a cyst; (d) vital parts of the tubule system; (e) vital glomerulus; and (f) bradytrophic calcifications.
Figure 12
Figure 12
Representative histological and immunohistological staining of human cystic tissue after removal from the CAM; (a) overview of hematoxylin/eosin-stained cystic tissue, showing a big cyst within the renal tissue that is surrounded by the CAM; (b) vital parts of the cysts stained positive for E-cadherin; (c) Dolichos biflorus agglutinin (DBA) and (d) acetylated tubulin; (e) some of the vimentin-positive cells were also positive for the proliferating cell antigen (PCNA, red arrowheads); (f) CD68-positive macrophages and numerous PCNA-positive cells were observed within the cysts; (g) phosphorylated S6 kinase 1 (pS6k1) and (h) HIF-1α were detected in cyst-lining cells; (i) CD31-positive capillaries originating from human cysts (huCD31, red arrowheads) were clearly separated from chicken-derived CD31-positive capillaries (chCD31, green arrowheads) (j) or detected in close proximity. Nuclei were stained with DAPI (blue).
Figure 12
Figure 12
Representative histological and immunohistological staining of human cystic tissue after removal from the CAM; (a) overview of hematoxylin/eosin-stained cystic tissue, showing a big cyst within the renal tissue that is surrounded by the CAM; (b) vital parts of the cysts stained positive for E-cadherin; (c) Dolichos biflorus agglutinin (DBA) and (d) acetylated tubulin; (e) some of the vimentin-positive cells were also positive for the proliferating cell antigen (PCNA, red arrowheads); (f) CD68-positive macrophages and numerous PCNA-positive cells were observed within the cysts; (g) phosphorylated S6 kinase 1 (pS6k1) and (h) HIF-1α were detected in cyst-lining cells; (i) CD31-positive capillaries originating from human cysts (huCD31, red arrowheads) were clearly separated from chicken-derived CD31-positive capillaries (chCD31, green arrowheads) (j) or detected in close proximity. Nuclei were stained with DAPI (blue).

References

    1. Harris P.C., Torres V.E. Polycystic kidney disease. Annu. Rev. Med. 2009;60:321–337. doi: 10.1146/annurev.med.60.101707.125712. - DOI - PMC - PubMed
    1. Bergmann C., Guay-Woodford L.M., Harris P.C., Horie S., Peters D.J.M., Torres V.E. Polycystic kidney disease. Nat. Rev. Dis. Primers. 2018;4:50. doi: 10.1038/s41572-018-0047-y. - DOI - PMC - PubMed
    1. Grantham J.J., Mulamalla S., Swenson-Fields K.I. Why kidneys fail in autosomal dominant polycystic kidney disease. Nat. Rev. Nephrol. 2011;7:556–566. doi: 10.1038/nrneph.2011.109. - DOI - PubMed
    1. Blair H.A. Tolvaptan: A Review in Autosomal Dominant Polycystic Kidney Disease. Drugs. 2019;79:303–313. doi: 10.1007/s40265-019-1056-1. - DOI - PubMed
    1. Torres V.E., Harris P.C., Pirson Y. Autosomal dominant polycystic kidney disease. Lancet. 2007;369:1287–1301. doi: 10.1016/S0140-6736(07)60601-1. - DOI - PubMed

Publication types

LinkOut - more resources