. 2022 Jul 26;13(8):1335.
doi: 10.3390/genes13081335.

Visual Clustering of Transcriptomic Data from Primary and Metastatic Tumors-Dependencies and Novel Pitfalls

Affiliations

Visual Clustering of Transcriptomic Data from Primary and Metastatic Tumors-Dependencies and Novel Pitfalls

André Marquardt et al. Genes (Basel). .

Abstract

Personalized oncology is a rapidly evolving area and offers cancer patients therapy options that are more specific than ever. However, there is still a lack of understanding regarding transcriptomic similarities or differences of metastases and corresponding primary sites. Applying two unsupervised dimension reduction methods (t-Distributed Stochastic Neighbor Embedding (t-SNE) and Uniform Manifold Approximation and Projection (UMAP)) on three datasets of metastases (n =682 samples) with three different data transformations (unprocessed, log10 as well as log10 + 1 transformed values), we visualized potential underlying clusters. Additionally, we analyzed two datasets (n =616 samples) containing metastases and primary tumors of one entity, to point out potential familiarities. Using these methods, no tight link between the site of resection and cluster formation outcome could be demonstrated, or for datasets consisting of solely metastasis or mixed datasets. Instead, dimension reduction methods and data transformation significantly impacted visual clustering results. Our findings strongly suggest data transformation to be considered as another key element in the interpretation of visual clustering approaches along with initialization and different parameters. Furthermore, the results highlight the need for a more thorough examination of parameters used in the analysis of clusters.

Keywords: UMAP; cancer; metastasis; t-SNE; transcriptomic analysis; visual clustering.


Conflict of interest statement

The authors declare no conflict of interest. The funders had no role in the design of the study; in the collection, analyses, or interpretation of data; in the writing of the manuscript, or in the decision to publish the results.

Figures
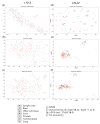
Figure 1
Figure 1
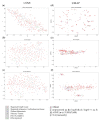
Visual clustering of the Dream Team dataset consisting of metastatic prostate cancer (with respective resection sites) by applying different data dimension reduction methods. t-SNE plot approach for (a) unprocessed, (b) log10 transformed, and (c) log10 + 1 transformed FPKM values and UMAP approach using (d) unprocessed, (e) log10 transformed, and (f) log10 + 1 transformed FPKM values. FPKM: Fragments Per Kilobase Million; U: unit, T: transformation, M: data dimension reduction method, C: clustering method, NA: not applicable.
Figure 2
Figure 2
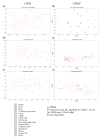
Visual clustering of the NEPC WCM dataset consisting of neuroendocrine metastatic prostate cancer (with respective resection sites) by applying different data dimension reduction methods. t-SNE plot approach for (a) unprocessed, (b) log10 transformed, and (c) log10 + 1 transformed FPKM values and UMAP approach using (d) unprocessed, (e) log10 transformed, and (f) log10 + 1 transformed FPKM values. FPKM: Fragments Per Kilobase Million; U: unit, T: transformation, M: data dimension reduction method, C: clustering method, NA: not applicable.
Figure 3
Figure 3
Visual clustering of the metastatic TCGA-SKCM dataset consisting of melanoma metastases (with respective resection sites) by applying different data dimension reduction methods. t-SNE plot approach for (a) unprocessed, (b) log10 transformed, and (c) log10 + 1 transformed FPKM values and UMAP approach using (d) unprocessed, (e) log10 transformed, and (f) log10 + 1 transformed FPKM values. FPKM: Fragments Per Kilobase Million; U: unit, T: transformation, M: data dimension reduction method, C: clustering method, NA: not applicable.
Figure 4
Figure 4
Visual clustering of the TCGA-KIPAN dataset consisting of the three major histopathologic subgroups of renal cell carcinoma (RCC)—clear cell RCC (KIRC), papillary RCC (KIRP), and chromophobe RCC (KICH)—by applying different data dimension reduction methods. t-SNE plot approach for (a) unprocessed, (b) log10 transformed, and (c) log10 + 1 transformed FPKM values and UMAP approach using (d) unprocessed, (e) log10 transformed, and (f) log10 + 1 transformed FPKM values. FPKM: Fragments Per Kilobase Million; U: unit, T: transformation, M: data dimension reduction method, C: clustering method, NA: not applicable.
Figure 5
Figure 5
Visual clustering of the complete TCGA-SKCM dataset consisting of primary tumors (red) and metastases (green) by applying different data dimension reduction methods. t-SNE plot approach for (a) unprocessed, (b) log10 transformed, and (c) log10 + 1 transformed FPKM values and UMAP approach using (d) unprocessed, (e) log10 transformed, and (f) log10 + 1 transformed FPKM values. FPKM: Fragments Per Kilobase Million; U: unit, T: transformation, M: data dimension reduction method, C: clustering method, NA: not applicable.
Figure 6
Figure 6
Visual clustering of the MBC Project dataset consisting of primary and metastatic breast cancer (with respective resection sites) by applying different data dimension reduction methods. t-SNE plot approach for (a) unprocessed, (b) log10 transformed, and (c) log10 + 1 transformed FPKM values and UMAP approach using (d) unprocessed, (e) log10 transformed, and (f) log10 + 1 transformed FPKM values. FPKM: Fragments Per Kilobase Million; U: unit, T: transformation, M: data dimension reduction method, C: clustering method, NA: not applicable.

Similar articles

References

    1. Wu Q., Li J., Zhu S., Wu J., Chen C., Liu Q., Wei W., Zhang Y., Sun S. Breast cancer subtypes predict the preferential site of distant metastases: A SEER based study. Oncotarget. 2017;8:27990–27996. doi: 10.18632/oncotarget.15856. - DOI - PMC - PubMed
    1. Liu Q., Zhang R., Michalski C.W., Liu B., Liao Q., Kleeff J. Surgery for synchronous and metachronous single-organ metastasis of pancreatic cancer: A SEER database analysis and systematic literature review. Sci. Rep. 2020;10:4444. doi: 10.1038/s41598-020-61487-0. - DOI - PMC - PubMed
    1. Thomas R.M., Truty M.J., Nogueras-Gonzalez G.M., Fleming J.B., Vauthey J.-N., Pisters P.W.T., Lee J.E., Rice D.C., Hofstetter W.L., Wolff R.A., et al. Selective reoperation for locally recurrent or metastatic pancreatic ductal adenocarcinoma following primary pancreatic resection. J. Gastrointest. Surg. 2012;16:1696–1704. doi: 10.1007/s11605-012-1912-8. - DOI - PMC - PubMed
    1. Nishizaki T., DeVries S., Chew K., Goodson W.H., Ljung B.-M., Thor A., Waldman F.M. Genetic alterations in primary breast cancers and their metastases: Direct comparison using modified comparative genomic hybridization. Genes Chromosom. Cancer. 1997;19:267–272. doi: 10.1002/(SICI)1098-2264(199708)19:43.0.CO;2-V. - DOI - PubMed
    1. Yachida S., Jones S., Bozic I., Antal T., Leary R., Fu B., Kamiyama M., Hruban R.H., Eshleman J.R., Nowak M.A., et al. Distant metastasis occurs late during the genetic evolution of pancreatic cancer. Nature. 2010;467:1114–1117. doi: 10.1038/nature09515. - DOI - PMC - PubMed

Publication types