. 2022 Jul 22;14(15):3020.
doi: 10.3390/nu14153020.

Synergistic Effect of β-Lapachone and Aminooxyacetic Acid on Central Metabolism in Breast Cancer

Affiliations

Synergistic Effect of β-Lapachone and Aminooxyacetic Acid on Central Metabolism in Breast Cancer

Mario C Chang et al. Nutrients. .

Abstract

The compound β-lapachone, a naturally derived naphthoquinone, has been utilized as a potent medicinal nutrient to improve health. Over the last twelve years, numerous reports have demonstrated distinct associations of β-lapachone and NAD(P)H: quinone oxidoreductase 1 (NQO1) protein in the amelioration of various diseases. Comprehensive research of NQO1 bioactivity has clearly confirmed the tumoricidal effects of β-lapachone action through NAD+-keresis, in which severe DNA damage from reactive oxygen species (ROS) production triggers a poly-ADP-ribose polymerase-I (PARP1) hyperactivation cascade, culminating in NAD+/ATP depletion. Here, we report a novel combination strategy with aminooxyacetic acid (AOA), an aspartate aminotransferase inhibitor that blocks the malate-aspartate shuttle (MAS) and synergistically enhances the efficacy of β-lapachone metabolic perturbation in NQO1+ breast cancer. We evaluated metabolic turnover in MDA-MB-231 NQO1+, MDA-MB-231 NQO1-, MDA-MB-468, and T47D cancer cells by measuring the isotopic labeling of metabolites from a [U-13C]glucose tracer. We show that β-lapachone treatment significantly hampers lactate secretion by ~85% in NQO1+ cells. Our data demonstrate that combinatorial treatment decreases citrate, glutamate, and succinate enrichment by ~14%, ~50%, and ~65%, respectively. Differences in citrate, glutamate, and succinate fractional enrichments indicate synergistic effects on central metabolism based on the coefficient of drug interaction. Metabolic modeling suggests that increased glutamine anaplerosis is protective in the case of MAS inhibition.

Keywords: GC-MS; biogenic; cancer; isotopologue; metabolism; synergy.


Conflict of interest statement

The authors declare no conflict of interest.

Figures

Figure 1
Figure 1
PCA analysis of GC-MS global metabolic profiles of four different breast cancer cell lines treated with either 6 µM β-lap, 100 µM AOA, or a combination of both drugs. Metabolites were analyzed based on internal standard normalized intensity. Panel (A) shows clear separation in MDA-MB-231 NQO1+ cells driven by β-lap treatment. Panel (B) shows much-reduced clustering in β-lap and β-lap+AOA treatment due to lack of NQO1 in MDA-MB-231 NQO1 cells. Panel (C) shows some separation among control, β-lap, and β-lap+AOA groups in T47D cells. Panel (D) shows limited effects in MDA-MB-468 cells, which have almost no NQO1 expression. PCA, principal component analysis; GC-MS, gas chromatography–mass spectrometry; β-lap, β-lapachone; AOA, aminooxyacetic acid; NQO1, quinone oxidoreductase 1.
Figure 2
Figure 2
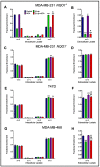
Evaluating glycolytic output by analyzing the intracellular and extracellular isotopologues of lactate in MDA-MB-231 NQO1+ (Panels (A,B)) and MDA-MB-231 NQO1 cells (Panels (C,D)). β-lap action drives glycolytic slowdown in NQO1+ cells as evidenced by significantly lower lactate secretion supported by higher intracellular enrichment of m+3 lactate in β-lap and combined treatment compared to control, and significantly lower extracellular enrichment of m+3 lactate in the same groups. Conversely, treatment was inconsequential across groups in NQO1 cells. Intracellular and extracellular lactate isotopologue distribution in T47D are shown in (Panels (E,F)) and MDA-MB-468 in (Panels (G,H)) breast cancer cells. (Note: n = 3, biological replicate data are represented as mean ± SEM. Statistical significance was determined by ANOVA and student’s t-test post hoc analysis and is presented as: (**) if p ≤ 0.01 and (***) if p ≤ 0.001 compared to control. (α) if p ≤ 0.05, (β) if p ≤ 0.01, and (γ) if p ≤ 0.001 compared to β-lap treatment. (a) if p ≤ 0.05 and (c) if p ≤ 0.001 compared to AOA treatment). SEM, standard error of the mean.
Figure 3
Figure 3
Kinetic analysis of extracellular lactate m+3 labeling over the course of 2 h after treatment. Panel (A) shows highly differential lactate production rates for MDA-MB-231 NQO1+ cells. In panel (B), MDA-MB-231 NQO1 showed no drastic differences across treatment groups. T47D showed slight differences among treatment groups (Panel (C)). MDA-MB-468 cells demonstrated lower production rates for β-lap and β-lap+AOA treatments (Panel (D)). (Note: n = 3, biological replicate data are represented as mean ± SEM. Statistical significance was determined by ANOVA and student’s t-test post hoc analysis and is presented as: (*) if p ≤ 0.05 and (***) if p ≤ 0.001 compared to control. (α) if p ≤ 0.05 and (β) if p ≤ 0.01 compared to β-lap treatment. (a) if p ≤ 0.05 and (c) if p ≤ 0.001 compared to AOA treatment).
Figure 4
Figure 4
Intracellular alanine isotopologue distribution in MDA-MB-231 NQO1+ (Panel (A)), MDA-MB-231 NQO1 (Panel (B)), T47D (Panel (C)), and MDA-MB-468 (Panel (D)). Alanine MID reflects treatment effects on a branching pathway of glycolysis. (Note: n = 3, biological replicate data are represented as mean ± SEM. Statistical significance was determined by ANOVA and student’s t-test post hoc analysis and is presented as: (*) if p ≤ 0.05, (**) if p ≤ 0.01, and (***) if p ≤ 0.001 compared to control. (γ) if p ≤ 0.001 compared to β-lap treatment. (c) if p ≤ 0.001 compared to AOA treatment).
Figure 5
Figure 5
Assessment of TCA cycle activity by measuring isotopologue labeling in TCA cycle metabolites revealed differences in the fractional enrichment of the m+2 isotopologues of citrate, glutamate, succinate, and malate in MDA-MB-231 NQO1+ (Panel (A)), MDA-MB-231 NQO1 (Panel (B)), T47D (Panel (C)), and MDA-MB-468 (Panel (D)). Results were calculated from intracellular GC-MS data and corrected for natural isotope abundance using the Isotopomer Network Compartmental Analysis (INCA 2.0) software. (Note: n = 3, biological replicate data are represented as mean ± SD. Statistical significance was determined by ANOVA and student’s t-test post hoc analysis and is presented as: (*) if p ≤ 0.05, (**) if p ≤ 0.01, and (***) if p ≤ 0.001 compared to control. (α) if p ≤ 0.05, (β) if p ≤ 0.01, and (γ) if p ≤ 0.001 compared to β-lap treatment. (a) if p ≤ 0.05 and (c) if p ≤ 0.001 compared to AOA treatment. Significance marks were color-coded by treatment). TCA, tricarboxylic acid; SD, standard deviation.
Figure 6
Figure 6
Citrate isotopologue distribution of breast cancer cells treated with β-lap and AOA. MDA-MB-231 NQO1+ (Panel (A)) and MDA-MB-231 NQO1 (Panel (B)) cells show that AOA enhances β-lap drug action in downregulating the TCA cycle. T47D (Panel (C)) cells showed no significant differences in isotopologue fractional enrichments across treatments. MDA-MB-468 (Panel (D)) cells showed a significant decrease in citrate m+2 labeling in combinatorial treatment compared to all other groups. (Note: n = 3, biological replicate data are represented as mean ± SEM. Statistical significance was determined by ANOVA and student’s t-test post hoc analysis and is presented as: (*) if p ≤ 0.05, (**) if p ≤ 0.01, and (***) if p ≤ 0.001 compared to control. (β) if p ≤ 0.01 and (γ) if p ≤ 0.001 compared to β-lap treatment. (c) if p ≤ 0.001 compared to AOA treatment).
Figure 7
Figure 7
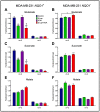
Analysis of TCA cycle activity across treatment groups by assessing the fractional enrichment of glutamate, succinate, and malate m+2 and m+3 isotopologues in MDA-MB-231 NQO1+ (Panels (A,C,E)) and MDA-MB-231 NQO1 cells (Panels (B,D,F)). Differential labeling in intermediates demonstrates a significant reduction in TCA cycle turnover induced by β-lap and AOA combinatorial treatment. (Note: n = 3, biological replicate data are represented as mean ± SEM. Statistical significance was determined by ANOVA and student’s t-test post hoc analysis and is presented as: (*) if p ≤ 0.05 and (***) if p ≤ 0.001 compared to control. (c) if p ≤ 0.001 compared to AOA treatment).
Figure 8
Figure 8
Analysis of metabolic flux in MDA-MB-231 NQO1+ cells. The relative net flux, as well as relative flux ratios, was assessed in two isotopomer network models. Model 1, mult-ox, (Panels (A,B)) addresses central metabolic pathways and reactions, as well as branching pathways relevant to the mechanism of action. Model 2, glu-ox, (Panels (C,D)) is a modified version of the first model that excludes fatty acid import and oxidation, which limits the contribution of unlabeled acetyl-CoA in the model. This alternative analysis infers greater GLS and GDH flux in β-lap-treated NQO1+ cells. Both models indicate β-lap treatment reroutes citrate out of the mitochondria to supply acetyl-CoA units. Differences in relative net flux values indicate a significant downregulation in glycolysis caused by β-lap as well as TCA cycle proper induced by both β-lap and AOA treatment in MDA-MB-231 NQO1+ cells. The relative flux ratios highlight significant decrements in glycolysis as well as the breakdown of the forward TCA cycle flux caused by β-lap action in NQO1+ cells. Abbreviation of metabolic reactions: lactate dehydrogenase (LDH), lactate export (Export), glyceraldehyde-3-phosohate dehydrogenase (GAPDH), pyruvate carboxylase (PC), pyruvate dehydrogenase (PDH), citrate synthase (CS), mitochondrial citrate carrier (CIC), citrate dehydrogenase (CDH), α-ketoglutarate dehydrogenase (AKGDH), succinate dehydrogenase (SDH), aspartate aminotransferase (AST), malate dehydrogenase (MDH), glutaminase (GLS), glutamate dehydrogenase (GDH), and fatty acid oxidation (FO). (Note: n = 3, biological replicate data are represented as mean ± SEM. Statistical significance was determined by ANOVA and student’s t-test post hoc analysis and is presented as: (**) if p ≤ 0.01 and (***) if p ≤ 0.001 compared to control. (α) if p ≤ 0.05 and (γ) if p ≤ 0.001 compared to β-lap treatment. (a) if p ≤ 0.05 and (c) if p ≤ 0.001 compared to AOA treatment). CoA, coenzyme A.

References

    1. Kim J.H., Lee S.M., Myung C.H., Lee K.R., Hyun S.M., Lee J.E., Park Y.S., Jeon S.R., Park J.I., Chang S.E., et al. Melanogenesis Inhibition of β-Lapachone, a Natural Product from Tabebuia Avellanedae, with Effective in Vivo Lightening Potency. Arch. Dermatol. Res. 2015;307:229–238. doi: 10.1007/s00403-015-1543-5. - DOI - PubMed
    1. Gómez Castellanos J.R., Prieto J.M., Heinrich M. Red Lapacho (Tabebuia Impetiginosa)—A Global Ethnopharmacological Commodity? J. Ethnopharmacol. 2009;121:1–13. doi: 10.1016/j.jep.2008.10.004. - DOI - PubMed
    1. Guiraud P., Steiman R., Campos-Takaki G.-M., Seigle-Murandi F., de Buochberg M. Comparison of Antibacterial and Antifungal Activities of Lapachol and β-Lapachone. Planta Med. 1994;60:373–374. doi: 10.1055/s-2006-959504. - DOI - PubMed
    1. Mokarizadeh N., Karimi P., Kazemzadeh H., Fathi Maroufi N., Sadigh-Eteghad S., Nikanfar S., Rashtchizadeh N. An Evaluation on Potential Anti-Inflammatory Effects of β-Lapachone. Int. Immunopharmacol. 2020;87:106810. doi: 10.1016/j.intimp.2020.106810. - DOI - PubMed
    1. de M.H., Choi H.M., Hahm D.-H., Her E., Yang H.-I., Yoo M.C., Kim K.S. Analgesic and Anti-Inflammatory Effects in Animal Models of an Ethanolic Extract of Taheebo, the Inner Bark of Tabebuia Avellanedae. Mol. Med. Rep. 2012;6:791–796. doi: 10.3892/mmr.2012.989. - DOI - PubMed