

Radio-Absorbing Materials Based on Polymer Composites and Their Application to Solving the Problems of Electromagnetic Compatibility
- PMID: 35893990
- PMCID: PMC9331814
- DOI: 10.3390/polym14153026
Radio-Absorbing Materials Based on Polymer Composites and Their Application to Solving the Problems of Electromagnetic Compatibility
Abstract
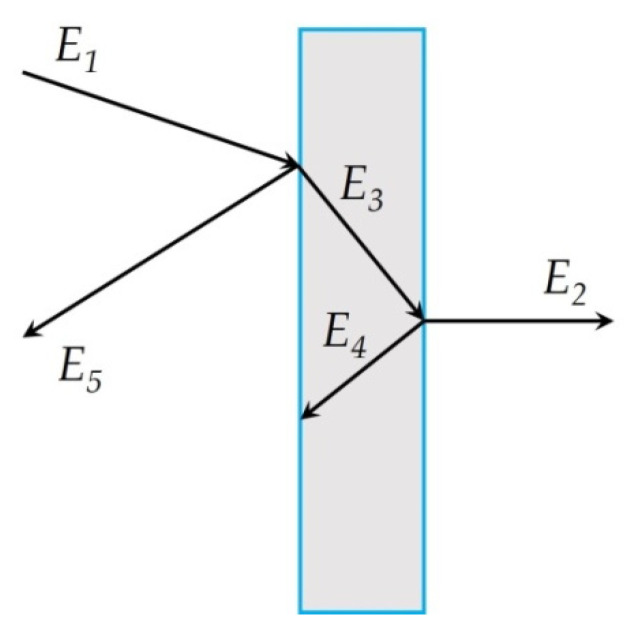
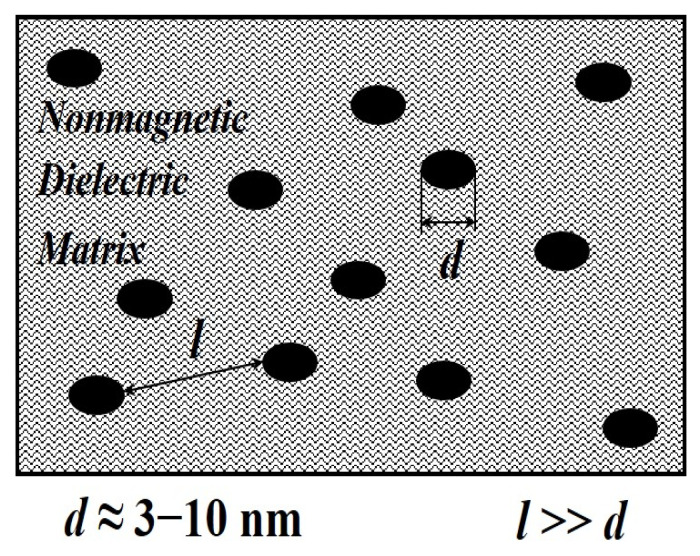
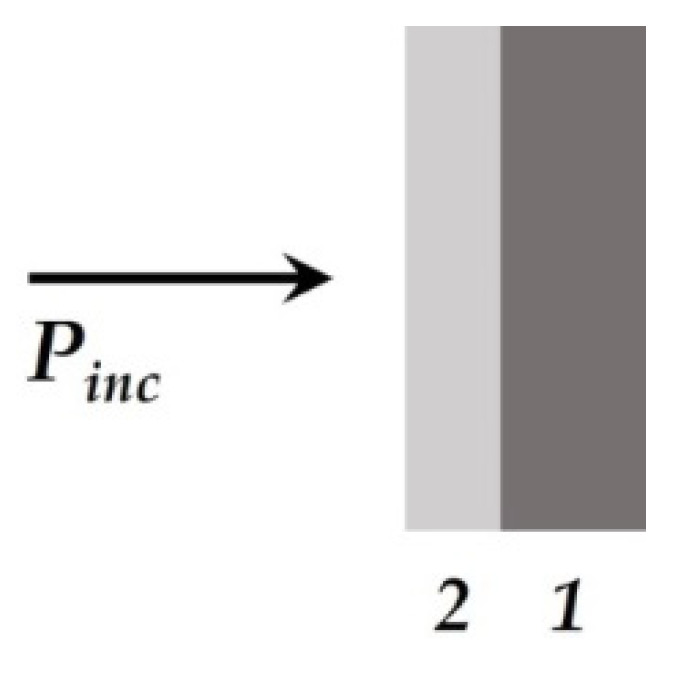
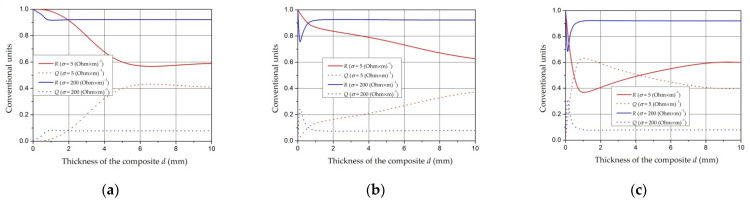
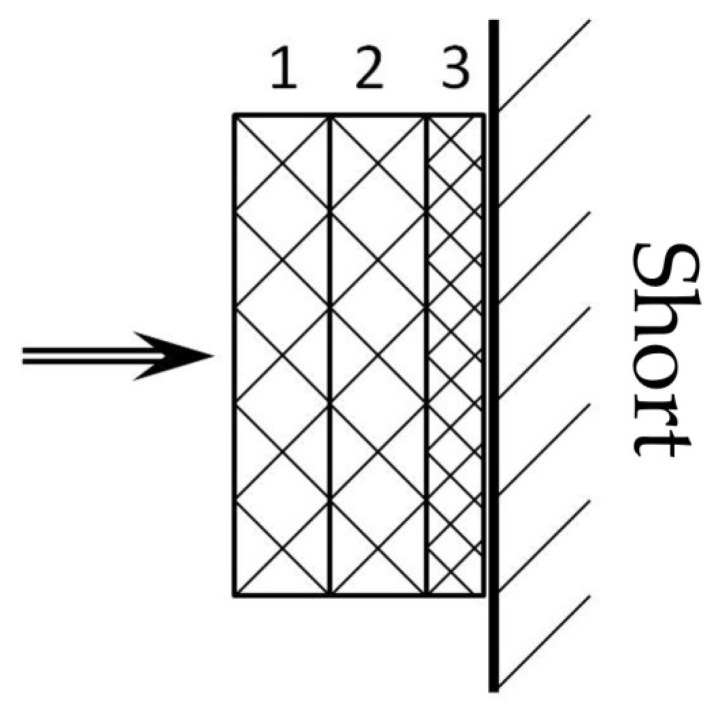
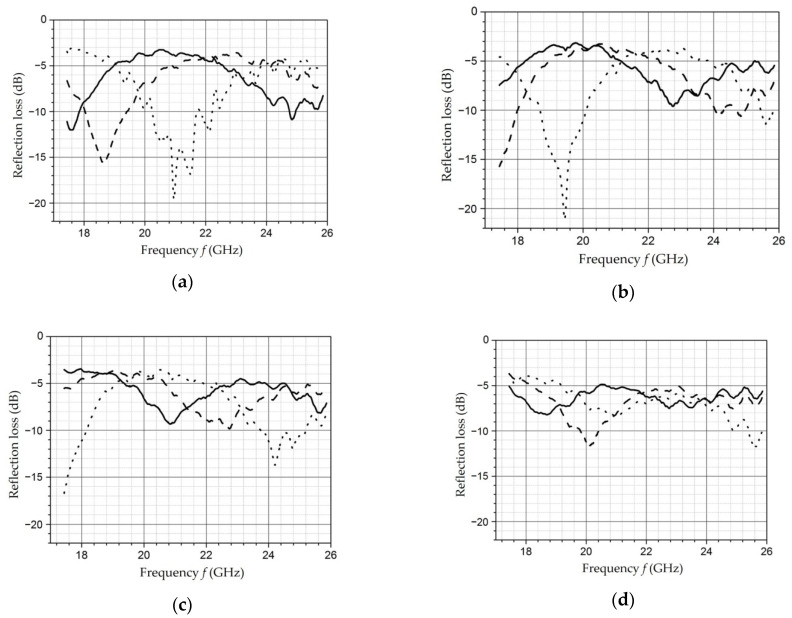
Recently, designers of electronic equipment have paid special attention to the issue of electromagnetic compatibility (EMC) of devices with their own components and assemblies. This is due to the high sensitivity of semiconductor microcircuits to electromagnetic interference. This interference can be caused either by natural phenomena, such as lightning strikes, or by technical processes, such as transients in circuits during fast periodic or random switching. Either way, interference implies a sudden change in voltage or current in a circuit, which is undesirable, whether it propagates along a cable or is transmitted as an electromagnetic wave. The purpose of this article is to review the works devoted to the development, creation, and investigation of modern polymeric nanocomposite materials used for shielding electromagnetic radiation and their effective application for solving problems of electromagnetic compatibility. Additionally, the approach to design EMI shielding complex media with predetermined parameters based on investigation of various properties of possible components is shown. In the review, all polymer composites are classified according to the type of filler. The issues of the interaction of a polymer with conductive fillers, the influence of the concentration of fillers and their location inside the matrix, and the structure of the nanocomposite on the mechanisms of electromagnetic interaction are considered. Particular attention is paid to a new generation of nanocomposite materials with widely adjustable electrical and magnetic properties. A wide class of modern filled polymeric materials with dielectric and magneto-dielectric losses is considered. These materials make it possible to create effective absorbers of electromagnetic waves that provide a low level of reflection coefficient in the microwave range. The model mechanisms for shielding electromagnetic radiation are considered in the paper. A detailed review of the electro-physical properties of polymer nanocomposites is provided. Multilayer electrodynamic media containing combinations of layers of filled polymer composite materials with nanoparticles of different compositions and manufactured using a single technology will make it possible to create electrodynamic media and coatings with the required electro-physical characteristics of absorption, transmission, and reflection. Within the framework of the two-layer coating model, the difference in the effects of the interaction of electromagnetic radiation with conductive layers located on a dielectric and metal substrate is demonstrated. It is shown that in order to achieve optimal (maximum) values of reflection and absorption of electromagnetic radiation in the appropriate frequency range, it is necessary to fit the appropriate layer thicknesses, specific conductivity, and permittivity. Such approach allows designers to create new shielding materials that can effectively vary the shielding, absorbing, and matching characteristics of coatings over a wide frequency band. In general, it can be said that the development of innovative polymer composite materials for shielding electronic devices from electromagnetic interference and excessive electromagnetic background is still an important task. Its solution will ensure the safe and uninterrupted operation of modern digital electronics and can be used for other applications.
Keywords: electromagnetic compatibility; materials with controlled electro-physical characteristics; nanoparticles; polymer nanocomposites; radio-absorbing materials and coatings.
Conflict of interest statement
The authors declare no conflict of interest.
Figures
Similar articles
-
Structural design and preparation of Ti3C2Tx MXene/polymer composites for absorption-dominated electromagnetic interference shielding.Nanoscale Adv. 2023 Jun 20;5(14):3549-3574. doi: 10.1039/d3na00130j. eCollection 2023 Jul 11. Nanoscale Adv. 2023. PMID: 37441247 Free PMC article. Review.
-
Research Progress on Intrinsically Conductive Polymers and Conductive Polymer-Based Composites for Electromagnetic Shielding.Molecules. 2023 Nov 17;28(22):7647. doi: 10.3390/molecules28227647. Molecules. 2023. PMID: 38005369 Free PMC article. Review.
-
Recent Advances in Polymer Nanocomposites for Electromagnetic Interference Shielding: A Review.ACS Omega. 2022 Jul 18;7(30):25921-25947. doi: 10.1021/acsomega.2c02504. eCollection 2022 Aug 2. ACS Omega. 2022. PMID: 35936479 Free PMC article. Review.
-
Future advances and challenges of nanomaterial-based technologies for electromagnetic interference-based technologies: A review.Environ Res. 2022 Apr 1;205:112402. doi: 10.1016/j.envres.2021.112402. Epub 2021 Nov 25. Environ Res. 2022. PMID: 34838569
-
Recent advances on outstanding microwave absorption and electromagnetic interference shielding nanocomposites of ZnO semiconductor.Adv Colloid Interface Sci. 2024 Apr;326:103137. doi: 10.1016/j.cis.2024.103137. Epub 2024 Mar 21. Adv Colloid Interface Sci. 2024. PMID: 38555833 Review.
Cited by
-
Comparison of Carbon-Nanoparticle-Filled Poly(Butylene Succinate-co-Adipate) Nanocomposites for Electromagnetic Applications.Nanomaterials (Basel). 2022 Oct 19;12(20):3671. doi: 10.3390/nano12203671. Nanomaterials (Basel). 2022. PMID: 36296860 Free PMC article.
-
Design and Analysis of Ultra-Thin Broadband Transparent Absorber Based on ITO Film.Micromachines (Basel). 2025 May 29;16(6):653. doi: 10.3390/mi16060653. Micromachines (Basel). 2025. PMID: 40572373 Free PMC article.
-
Temperature responsive aluminum manganese doped carbon dot sensors for enhanced electrical conductivity with DFT calculations.Sci Rep. 2025 Jun 5;15(1):19754. doi: 10.1038/s41598-025-04531-1. Sci Rep. 2025. PMID: 40473774 Free PMC article.
-
Theoretical Analysis of a Magnetic Shielding System Combining Active and Passive Modes.Nanomaterials (Basel). 2024 Mar 19;14(6):538. doi: 10.3390/nano14060538. Nanomaterials (Basel). 2024. PMID: 38535686 Free PMC article.
References
-
- Geetha S., Satheesh Kumar K.K., Rao C.R.K., Vijayan M., Trivedi D.C. EMI shielding: Methods and materials. J. Appl. Polym. Sci. 2009;112:2073–2086. doi: 10.1002/app.29812. - DOI
-
- Chung D.D.L. Materials for electromagnetic interference shielding. J. Mater. Eng. Perform. 2000;9:350–354. doi: 10.1361/105994900770346042. - DOI
-
- Chung D.D.L. Electromagnetic interference shielding effectiveness of carbon materials. Carbon. 2001;39:279–285. doi: 10.1016/S0008-6223(00)00184-6. - DOI
-
- Udmale V., Mishra D., Gadhave R., Pinjare D., Yamgar R. Development trends in conductive nano-composites for radiation shielding. Orient. J. Chem. 2013;29:927–936. doi: 10.13005/ojc/290310. - DOI
-
- Ismibeyli E. Electrodynamics and Propagation of Radio Waves: Workbook for Universities. LAP LAMBERT Academic Publishing; Chisinau, Moldova: 2014.
Publication types
LinkOut - more resources
Full Text Sources
