. 2022 Jul 27;8(4):1928-1946.
doi: 10.3390/tomography8040162.

A Novel Method for Lung Image Processing Using Complex Networks

Affiliations

A Novel Method for Lung Image Processing Using Complex Networks

Laura Broască et al. Tomography. .

Abstract

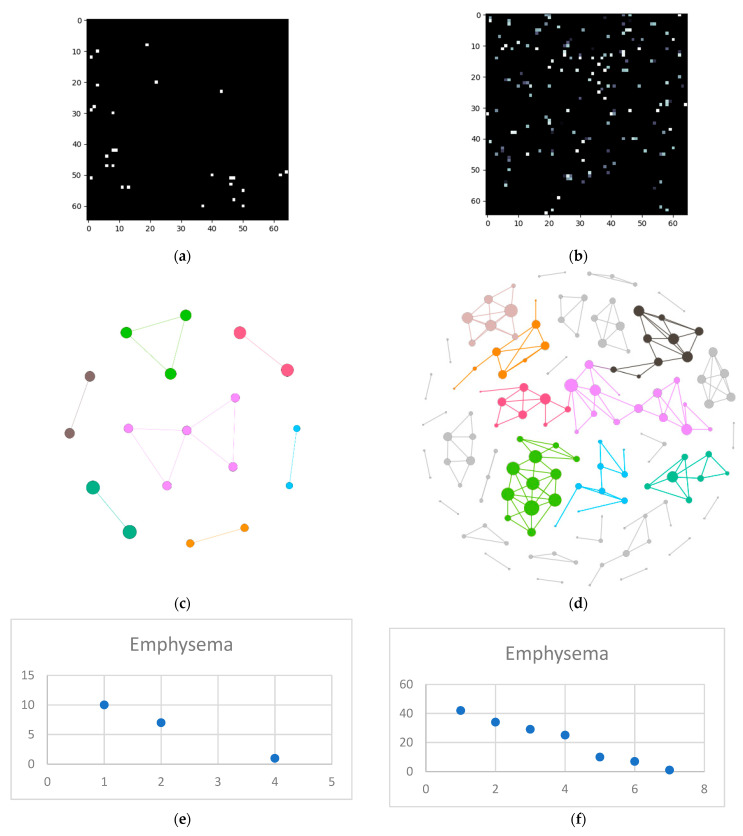
The High-Resolution Computed Tomography (HRCT) detection and diagnosis of diffuse lung disease is primarily based on the recognition of a limited number of specific abnormal findings, pattern combinations or their distributions, as well as anamnesis and clinical information. Since texture recognition has a very high accuracy percentage if a complex network approach is used, this paper aims to implement such a technique customized for diffuse interstitial lung diseases (DILD). The proposed procedure translates HRCT lung imaging into complex networks by taking samples containing a secondary lobule, converting them into complex networks and analyzing them in three dimensions: emphysema, ground glass opacity, and consolidation. This method was evaluated on a 60-patient lot and the results showed a clear, quantifiable difference between healthy and affected lungs. By deconstructing the image on three pathological axes, the method offers an objective way to quantify DILD details which, so far, have only been analyzed subjectively.

Keywords: HRCT; complex networks; diffuse interstitial lung disease; model.


Conflict of interest statement

The authors declare no conflict of interest.

Figures

Figure 1
Figure 1
Axial thin-section CT scans, injury patterns: high density (1, 2, 3), low density (4, 5, 6), reticular (7, 8), nodular pattern (9, 10), and overlapping (11, 12, 13, 14). Scans belong to the ‘Dr. Victor Babes’ Infectious Diseases and Pneumoftiziology Clinical Hospital Timisoara database.
Figure 2
Figure 2
Splitting CT sample into layers (a) original CT, (b) sample crop, (c) combined Emphysema, GGO, and Consolidation layers, (d) Emphysema layer, (e) GGO layer, (f) Consolidation layer.
Figure 3
Figure 3
Degree distributions for various Rd.
Figure 4
Figure 4
Algorithm step 1—sample selection (a) Normal sample (b) DILD (IFP) sample.
Figure 5
Figure 5
Emphysema processing (a) HU filtered layer for the normal sample; (b) HU filtered layer for the DILD sample (c) Complex network built according to the proposed algorithm corresponding to the normal sample, Fruchterman–Reingold render layout, node sizes proportional to node degrees, edge width invariant (1.5 pixels). (d) Complex network built according to the proposed algorithm corresponding to the DILD sample, Fruchterman–Reingold render layout, node sizes proportional to node degrees, edge width invariant (1.5 pixels). (e) Degree distribution of the normal sample network (f) Degree distribution of the DILD sample network.
Figure 6
Figure 6
GGO processing (a) HU filtered layer for the normal sample; (b) HU filtered layer for the DILD sample (c) Complex network built according to the proposed algorithm corresponding to the normal sample, Fruchterman–Reingold render layout, node sizes proportional to node degrees, edge width invariant (1.5 pixels). (d) Complex network built according to the proposed algorithm corresponding to the DILD sample, Fruchterman–Reingold render layout, node sizes proportional to node degrees, edge width invariant (1.5 pixels). (e) Degree distribution of the normal sample network (f) Degree distribution of the DILD sample network. Equations for curve fit and R2 are also presented for the relevant distributions.
Figure 7
Figure 7
Consolidation processing (a) HU filtered layer for the normal sample; (b) HU filtered layer for the DILD sample (c) Complex network built according to the proposed algorithm corresponding to the normal sample, Fruchterman–Reingold render layout, node sizes proportional to node degrees, edge width invariant (1.5 pixels). (d) Complex network built according to the proposed algorithm corresponding to the DILD sample, Fruchterman–Reingold render layout, node sizes proportional to node degrees, edge width invariant (1.5 pixels). (e) Degree distribution of the normal sample network (f) Degree distribution of the DILD sample network. Equations for curve fit and R2 are also presented for the relevant distributions.
Figure 8
Figure 8
Population distribution comparisons according to specific complex network parameters: (a) Total count (b) Average count (c) Maximum degree Class 0 (fuchsia) represents normal lungs, while class 1 (yellow) is formed of DILD affected lungs.
Figure 9
Figure 9
(a) Normal population plotted based on the average degree. Class 0 is the normal population investigated prior COVID-19, class 1 are cases diagnosed as normal in the pandemic era (b) DILD population plotted based on the average degree. Class 2 is UIP, 3 probable UIP, 4 UIP and emphysema, 5 organizing pneumonitis (OP), 6 hypersensitivity pneumonitis (HP), and 7 sarcoidosis.
Figure 10
Figure 10
Average coefficient of determination (R2) for logarithmic and power distributions, relative to radial distance (Rd).
Figure 11
Figure 11
Relative percentage of standard deviation for DILD vs. normal lungs on all the pathological HU bands, taking into account maximum degree, total count, and average degree. Absolute values are also given for each data point.
Figure 12
Figure 12
(a) HRCT slice under analysis (b) Sample 1 (c) Sample 2 (d) Degree distribution for sample 1 on the emphysema layer (e) Degree distribution for sample 2 on the emphysema layer (f) Degree distribution for sample 1 on the GGO layer (g) Degree distribution for sample 2 on the GGO layer.
Figure 13
Figure 13
Box plot for DILD (left) vs. normal (right) for complex network parameters of (a) maximum degree (b) total count (c) average degree.

References

    1. Ryu J.H., Daniels C.E., Hartman T.E., Yi E.S. Diagnosis of Interstitial Lung Diseases. Mayo Clin. Proc. 2007;82:976–986. doi: 10.4065/82.8.976. - DOI - PubMed
    1. Guler S.A., Corte T.J. Interstitial Lung Disease in 2020: A History of Progress. Clin. Chest Med. 2021;42:229–239. doi: 10.1016/j.ccm.2021.03.001. - DOI - PubMed
    1. Molina-Molina M., Aburto M., Acosta O., Ancochea J., Rodríguez-Portal J.A., Sauleda J., Lines C., Xaubet A. Importance of early diagnosis and treatment in idiopathic pulmonary fibrosis. Expert Rev. Respir. Med. 2018;12:537–539. doi: 10.1080/17476348.2018.1472580. - DOI - PubMed
    1. Kolb M., Richeldi L., Behr J., Maher T.M., Tang W., Stowasser S., Hallmann C., du Bois R.M. Nintedanib in patients with idiopathic pulmonary fibrosis and preserved lung volume. Thorax. 2017;72:340–346. doi: 10.1136/thoraxjnl-2016-208710. - DOI - PMC - PubMed
    1. Meyer K.C. Diagnosis and management of interstitial lung disease. Transl. Respir. Med. 2014;2:4. doi: 10.1186/2213-0802-2-4. - DOI - PMC - PubMed

MeSH terms