

SARS-CoV-2 spike protein enhances MAP4K3/GLK-induced ACE2 stability in COVID-19
- PMID: 35894122
- PMCID: PMC9353388
- DOI: 10.15252/emmm.202215904
SARS-CoV-2 spike protein enhances MAP4K3/GLK-induced ACE2 stability in COVID-19
Abstract
ACE2 on epithelial cells is the SARS-CoV-2 entry receptor. Single-cell RNA-sequencing data derived from two COVID-19 cohorts revealed that MAP4K3/GLK-positive epithelial cells were increased in patients. SARS-CoV-2-induced GLK overexpression in epithelial cells was correlated with COVID-19 severity and vesicle secretion. GLK overexpression induced the epithelial cell-derived exosomes containing ACE2; the GLK-induced exosomes transported ACE2 proteins to recipient cells, facilitating pseudovirus infection. Consistently, ACE2 proteins were increased in the serum exosomes from another COVID-19 cohort. Remarkably, SARS-CoV-2 spike protein-stimulated GLK, and GLK stabilized ACE2 in epithelial cells. Mechanistically, GLK phosphorylated ACE2 at two serine residues (Ser776, Ser783), leading to the dissociation of ACE2 from its E3 ligase UBR4. Reduction in UBR4-induced Lys48-linked ubiquitination at three lysine residues (Lys26, Lys112, Lys114) of ACE2 prevented its degradation. Furthermore, SARS-CoV-2 pseudovirus or live virus infection in humanized ACE2 mice induced GLK and ACE2 protein levels, and ACE2-containing exosomes. Collectively, ACE2 stabilization by SARS-CoV-2-induced MAP4K3/GLK may contribute to the pathogenesis of COVID-19.
Keywords: ACE2; COVID-19; MAP4K3/GLK; SARS-CoV-2; UBR4.
© 2022 The Authors. Published under the terms of the CC BY 4.0 license.
Figures
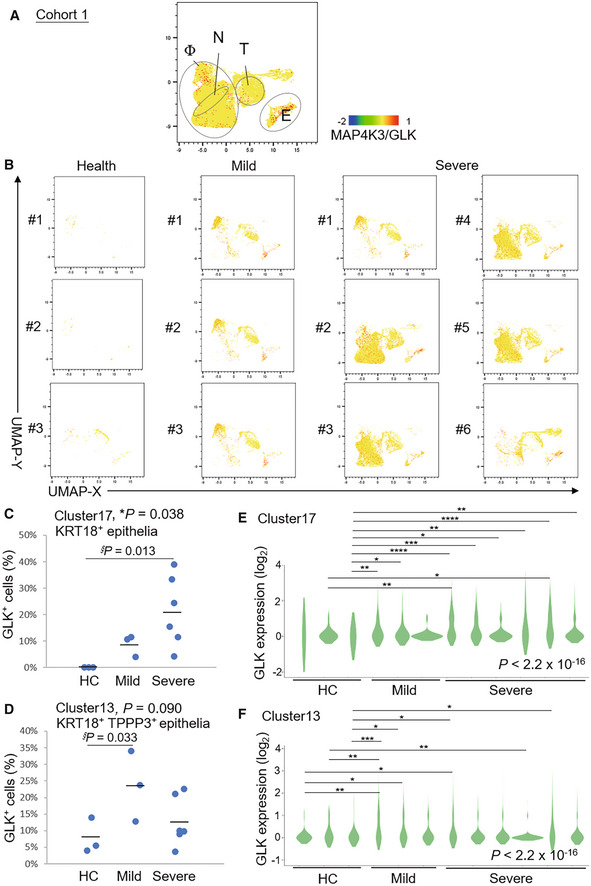
- A, B
Distribution and classification of MAP4K3/GLK‐positive cells in 20 ml BALFs of all 12 individuals (A), three healthy controls (HC, #1–#3), three mild COVID‐19 patients (#1–#3), and six severe COVID‐19 patients (#1–#6) (B) from Cohort #1. Data were shown in UMAP. Single‐cell gene expression of MAP4K3 (GLK) in individual cells was shown in color scale. Φ denotes macrophages; N denotes neutrophils; T denotes T cells; E denotes epithelial cells.
- C, D
The percentages of MAP4K3/GLK‐positive KRT18+ epithelial (C) or KRT18+ TPPP3+‐ciliated epithelial cells (D) in BALFs from Cohort #1.
- E, F
GLK mRNA levels in KRT18+ epithelial (E) or KRT18+ TPPP3+‐ciliated epithelial cells (F) of Cohort #1. n (cell number) = 3, 14, 33 for HC; n = 65, 43, 74 for mild COVID‐19 patients; n = 164, 62, 10, 4, 74, 66 for severe COVID‐19 patients (E). n = 25, 43, 36 for HC; n = 209, 244, 141 for mild COVID‐19 patients; n = 189, 223, 330, 792, 80, 243 for severe COVID‐19 patients (F).
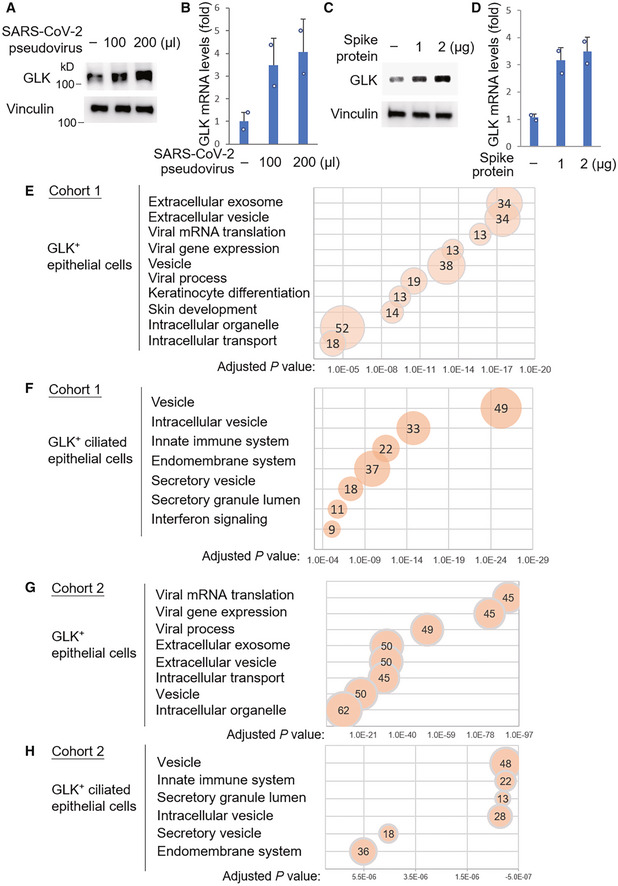
- A–D
Endogenous GLK levels were increased by the SARS‐CoV‐2 spike protein. Immunoblotting analysis of the endogenous GLK and vinculin proteins from the lysates of HCC827 lung epithelial cells either infected with SARS‐CoV‐2 pseudovirus (A) or treated with the SARS‐CoV‐2 spike protein (C). Real‐time PCR analysis of mouse GLK mRNA levels in HCC827 lung epithelial cells either infected with SARS‐CoV‐2 pseudovirus (B) or treated with the SARS‐CoV‐2 spike protein (D). The mRNA levels of GLK were normalized to GAPDH mRNA levels. n = 2 (technical replicates) per group.
- E–H
KEGG (Kyoto Encyclopedia of Genes and Genomes)‐enriched pathways of the upregulated genes in GLK‐positive KRT18+ epithelial cells or KRT18+ TPPP3+‐ciliated epithelial cells from Cohort #1 (E and F) and Cohort #2 (G and H). Pathways belonging to different classifications are listed on the left side of the plot. Varied numbers of genes enriched in individual pathways are presented by different diameter sizes and numbers for individual dots. Adjusted P‐value is ranging from 0 ~ 1; less P‐value means greater intensiveness.
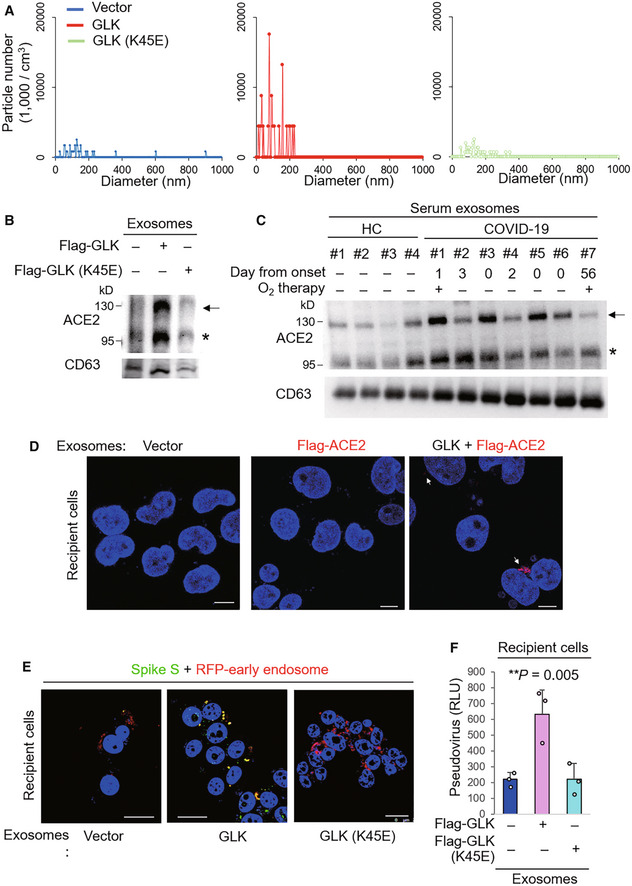
- A
ZetaView nanoparticle tracking analysis of particle numbers and sizes of CD63+ extracellular vesicles (EVs) isolated from the supernatants of HCC827 lung epithelial cancer cells, which were transfected with GLK wild‐type or GLK kinase‐dead (K45E) mutant. EVs were isolated sequentially using ExoQuick kits and then ExoQuick ULTRA columns.
- B
Immunoblotting of ACE2 and CD63 proteins in exosomes isolated from GLK wild‐type‐ or GLK (K45E) kinase‐dead‐overexpressing HCC827 cells. Exosomes were isolated sequentially using ExoQuick kits and then ExoQuick ULTRA columns. Arrowhead denotes glycosylated ACE2 proteins; asterisk denotes nonglycosylated ACE2 proteins.
- C
Immunoblotting of ACE2 and CD63 proteins in serum exosomes isolated from the sera of four healthy controls (HC) and seven COVID‐19 patients from NHRI Biobank for COVID‐19 patients in Taiwan (Cohort #3). Serum collection days from the onset are shown; treatment of oxygen therapy on the patient is also indicated. Exosomes were isolated sequentially using ExoQuick kits and then ExoQuick ULTRA columns. Arrowhead denotes glycosylated ACE2 proteins; asterisk denotes nonglycosylated ACE2 proteins.
- D
Confocal microscopy analysis of Flag‐tagged ACE2 proteins (red) in recipient cells after incubation with exosomes for 72 h. Exosomes were isolated sequentially from the supernatants of Flag‐ACE2‐overexpressing or GFP‐GLK plus Flag‐ACE2‐coexpressing HCC827 cells using ExoQuick kits and then ExoQuick ULTRA columns. Arrows denote Flag‐tagged ACE2 proteins. Original magnification, ×630; scale bars, 10 μm.
- E
Confocal microscopy analysis of SARS‐CoV‐2 spike (S) protein (green) and RFP‐labeled early endosomes (red) in exosome‐recipient HCC827 epithelial cells. After incubation with exosomes for 72 h, recipient cells were treated with the spike protein (S) for another 24 h. Yellow color suggests the localization of S protein in early endosomes. Original magnification, ×630; scale bars, 25 μm.
- F
Cell entry efficiencies of SARS‐CoV‐2 pseudovirus into exosome‐recipient HCC827 epithelial cells were measured by luciferase activity and presented as relative light units (RLU) at 24 h postinfection. n = 3 (biological replicates).
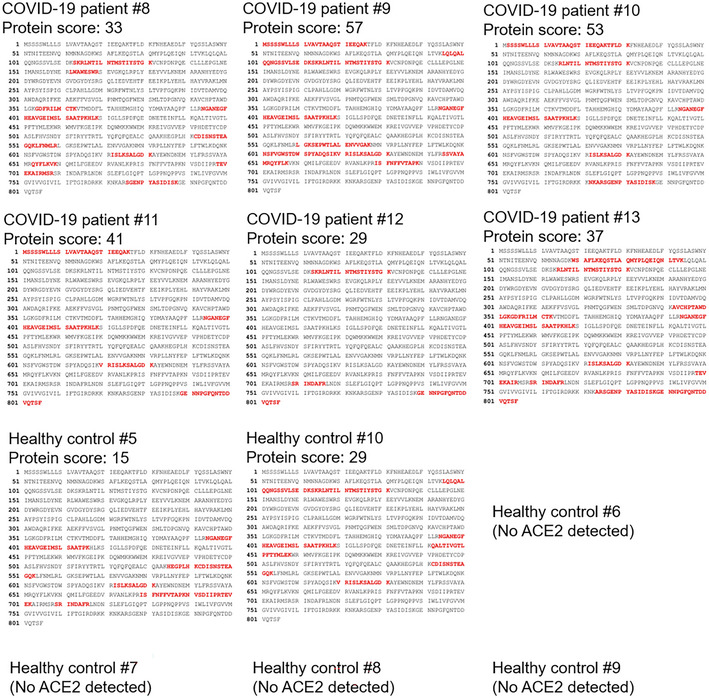
- A
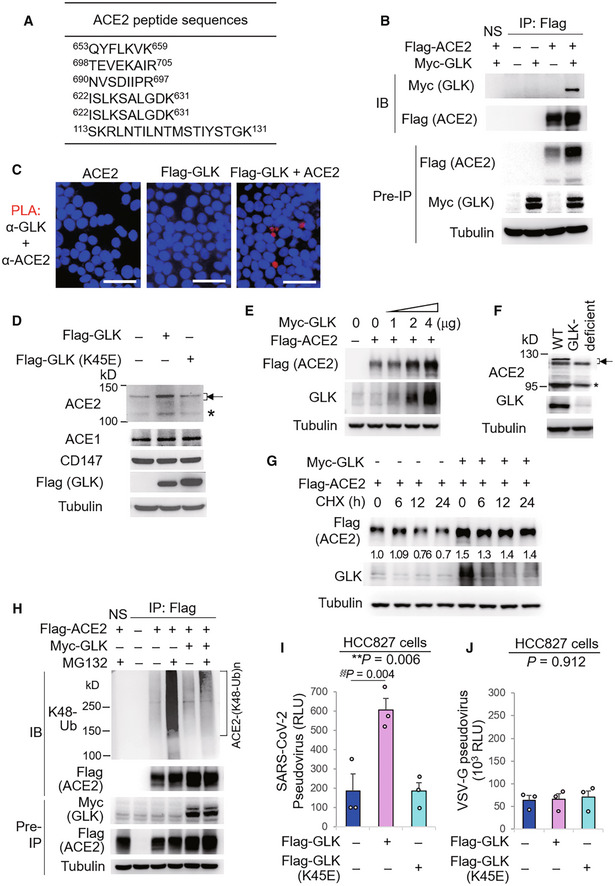
The identified peptide sequences of the endogenous ACE2 proteins by mass spectrometry analyses using GLK immunocomplexes.
- B
Co‐immunoprecipitation of Flag‐tagged ACE2 with Myc‐tagged GLK proteins from lysates of HEK293T transfectants. NS, normal serum.
- C
In situ PLA assays of the interaction between ACE2 and Flag‐tagged GLK proteins in HEK293T cells. Nuclei were stained with DAPI. Red dots represent direct interaction signals. Original magnification, ×200. Scale bars, 50 μm.
- D
Immunoblotting analyses of the endogenous ACE2, ACE1, CD147, and tubulin proteins, and the transfected Flag‐GLK proteins in HCC827 lung epithelial cells, which were transfected with either GLK wild‐type or kinase‐dead (K45E) mutant. Arrowhead denotes glycosylated ACE2 proteins; asterisk denotes nonglycosylated ACE2 proteins.
- E
Immunoblotting of Flag‐tagged ACE2 (anti‐Flag), Myc‐tagged GLK (anti‐GLK), and tubulin proteins from HEK293T cells co‐transfected with Flag‐ACE2 plus increasing amounts of Myc‐GLK plasmids.
- F
Immunoblotting of ACE2, GLK, and tubulin proteins in the lung tissues of wild‐type or GLK‐deficient mice. Arrowhead denotes glycosylated ACE2 proteins; asterisk denotes nonglycosylated ACE2 proteins.
- G
Cycloheximide pulse‐chase experiments in HEK293T cells. Immunoblotting of Flag‐tagged ACE2 (anti‐Flag), Myc‐tagged GLK (anti‐GLK), and tubulin proteins from HEK293T cells co‐transfected with Flag‐ACE2 and Myc‐GLK. Transfected cells were treated with 100 μg/ml cycloheximide (CHX) for up to 24 h.
- H
Flag‐tagged ACE2 proteins were immunoprecipitated from lysates of HEK293T cells co‐transfected with Flag‐ACE2 and Myc‐GLK, followed by immunoblotting with anti‐Lys48‐linked ubiquitination or anti‐Flag antibody. Cells were treated with 25 μM MG132 for 2 h before being harvested. NS, normal serum.
- I, J
Cell entry efficiencies of SARS‐CoV‐2 pseudovirus (I) or VSV‐G pseudovirus (J) into GLK wild‐type‐ or GLK (K45E)‐overexpressing HCC827 epithelial cells were measured by luciferase activity and presented as relative light units (RLU) at 24 h postinfection. n = 3 (biological replicates).
- A
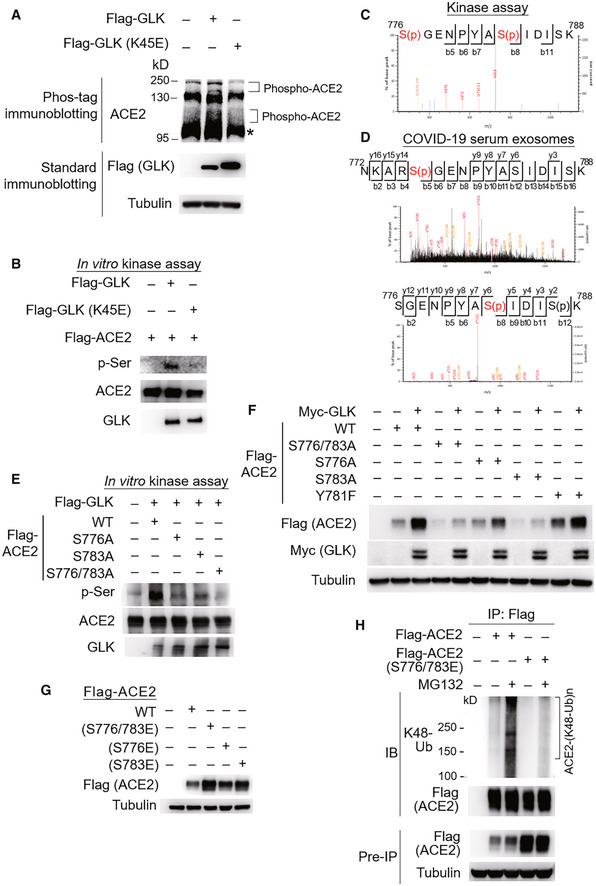
Immunoblotting analyses of ACE2 and Flag‐tagged GLK in HCC827 cells transfected with either Flag‐GLK or Flag‐GLK (K45E) kinase‐dead mutant. For immunoblotting of phosphorylated ACE2, Phos‐tagged SDS–PAGE gel (Phos‐tag™) was used, followed by immunoblotting with anti‐ACE2 antibody. Asterisk denotes unglycosylated ACE2 proteins.
- B
In vitro kinase assays using purified proteins. ACE2 serine phosphorylation, Flag‐tagged GLK (anti‐GLK), Flag‐tagged GLK (K45E) kinase‐dead mutant (anti‐GLK), and Flag‐tagged ACE2 proteins (anti‐ACE2) were detected by immunoblotting.
- C
Mass spectrometry analysis of GLK‐phosphorylated ACE2 proteins after in vitro kinase assays. ACE2 Ser776 and Ser783 residues were phosphorylated by GLK wild‐type but not GLK (K45E) kinase‐dead mutant.
- D
Mass spectrometry analysis of the ACE2 peptides from the serum exosomes of COVID‐19 patients. The ACE2 protein peptide sequences containing phospho‐Ser776 or phospho‐Ser783 residue of ACE2 proteins detected in the serum exosomes of COVID‐19 patients (Cohort #3) are shown. Exosomes were isolated using ExoQuick kits, and soluble proteins were removed by ExoQuick ULTRA columns. Exosomes were further purified by immunoprecipitation using a combination of anti‐CD9, anti‐CD63, and CD81 magnetic beads.
- E
In vitro kinase assays using immunoprecipitated Flag‐tagged ACE2 or Flag‐tagged GLK immunocomplexes. ACE2 serine phosphorylation, ACE2, and GLK were detected by immunoblotting using anti‐phospho‐serine, anti‐ACE2, and anti‐GLK antibodies, respectively.
- F
Immunoblotting analyses of Myc‐tagged GLK, Flag‐tagged ACE2, and tubulin proteins in HEK293T cells co‐transfected with Flag‐ACE2 wild‐type or individual ACE2 (S776/783A, S776A, or S783A) mutants plus either empty vector or Myc‐GLK.
- G
Immunoblotting analyses of Flag‐tagged ACE2 and tubulin proteins in HEK293T cells transfected with Flag‐ACE2 wild‐type or individual phosphomimetic ACE2 (S776/783E, S776E, or S783E) mutants.
- H
Flag‐tagged ACE2 proteins were immunoprecipitated from lysates of HEK293T cells transfected with Flag‐ACE2 wild‐type or a phosphomimetic ACE2 (S776/783E) mutant, followed by immunoblotting with anti‐Lys48‐linked ubiquitination or anti‐Flag antibody. Cells were treated with 25 μM MG132 for 2 h before being harvested.
- A
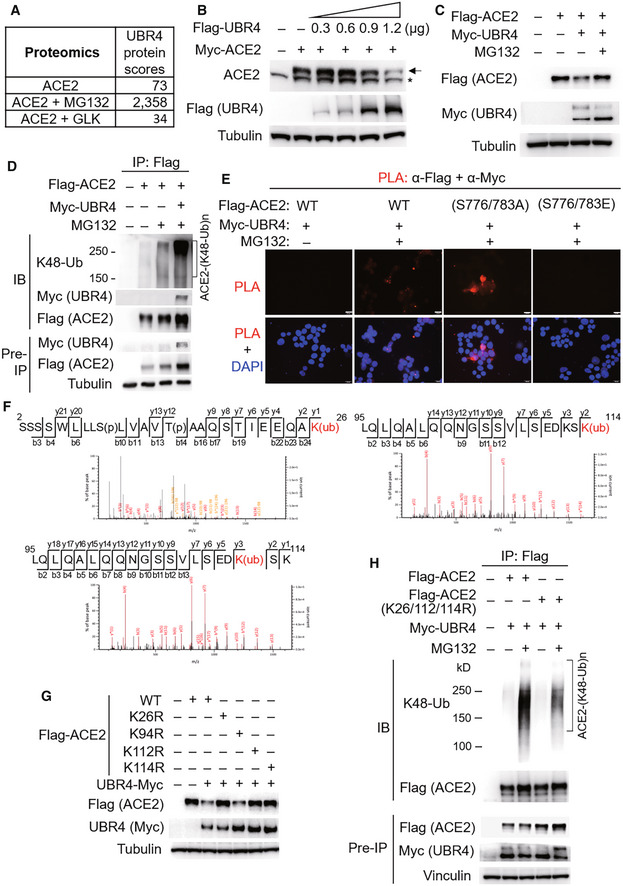
The protein scores of UBR4 by mass spectrometry analyses using Flag‐tagged ACE2 immunocomplexes from cells either treated with MG132 or co‐transfected with Flag‐ACE2 and Myc‐GLK plasmids. The protein score is the sum of the highest ions score of MS/MS search for each distinct peptide.
- B
Immunoblotting of Myc‐tagged ACE2 (anti‐ACE2), Flag‐tagged UBR4 (anti‐Flag), and tubulin proteins from HEK293T cells co‐transfected with Myc‐ACE2 and Flag‐UBR4. Arrowhead denotes Myc‐tagged ACE2 proteins; asterisk denotes endogenous ACE2 proteins.
- C
Immunoblotting of Flag‐tagged ACE2 (anti‐Flag), Myc‐tagged UBR4 (anti‐Myc), and tubulin proteins from HEK293T cells co‐transfected with Flag‐ACE2 and Myc‐UBR4. The co‐transfected cells were treated with 25 μM MG132 for 2 h before being harvested.
- D
Flag‐tagged ACE2 proteins were immunoprecipitated from lysates of HEK293T cells co‐transfected with Flag‐ACE2 and Myc‐UBR4, followed by immunoblotting with anti‐Lys48‐linked ubiquitination, anti‐Myc, or anti‐Flag antibody. Cells were treated with 25 μM MG132 for 2 h before being harvested.
- E
In situ PLA assays of the interaction between Flag‐tagged ACE2 (wild‐type or mutant) and Myc‐tagged UBR4 proteins in HEK293T cells treated with 25 μM MG132 for 2 h. Nuclei were stained with DAPI. Red dots represent direct interaction signals. Original magnification, ×200. Scale bars, 20 μm.
- F
Mass spectrometry analysis of the ACE2 peptides containing ubiquitination residues from Flag‐ACE2‐transfected HEK293T cells treated with 25 μM MG132 for 2 h.
- G
Immunoblotting analyses of Flag‐tagged ACE2, Myc‐tagged UBR4, and tubulin proteins in HEK293T cells co‐transfected with Flag‐ACE2 wild‐type or individual (K26R, K94R, K112R, or K114R) mutants plus either empty vector or Myc‐UBR4.
- H
Flag‐tagged ACE2 proteins were immunoprecipitated from lysates of HEK293T cells co‐transfected with Flag‐ACE2 wild‐type or Flag‐ACE2 (K26/112/114R) mutant plus Myc‐UBR4 plasmids, followed by immunoblotting with anti‐Lys48‐linked ubiquitination or anti‐Flag antibody. Cells were treated with 25 μM MG132 for 2 h before being harvested.
- A
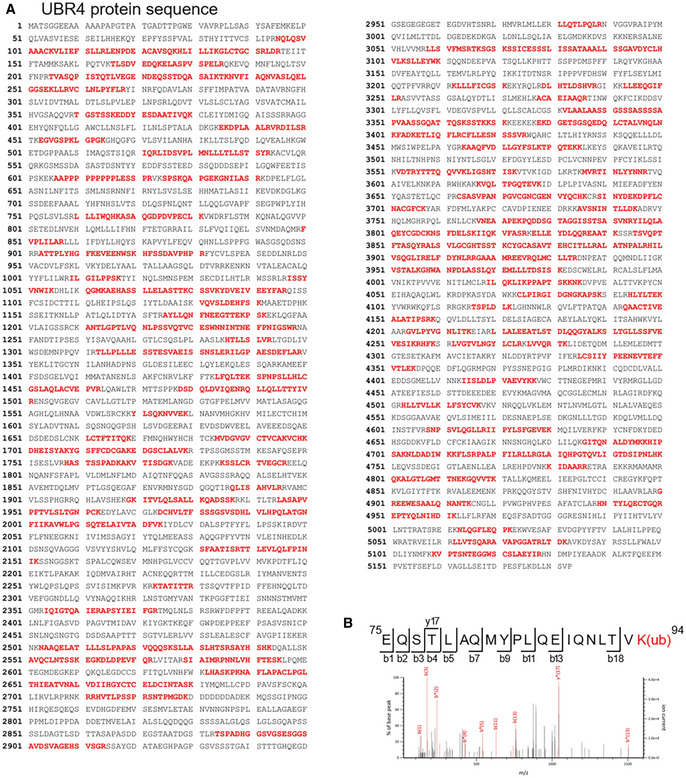
The identified peptide sequences (red color) of endogenous UBR4 by mass spectrometry analyses using ACE2 immunocomplexes. ACE2‐overexpressing HEK293T cells were treated with the proteasome inhibitor MG132 (25 μM) for 2 h.
- B
Besides Lys26, Lys112, and Lys114 residues, Lys94 residue was also identified as an ACE2 ubiquitination site. Mass spectrometry analysis of the ACE2 peptide containing the ubiquitination residue Lys94 from ACE2‐transfected HEK293T cells treated with MG132.
- A
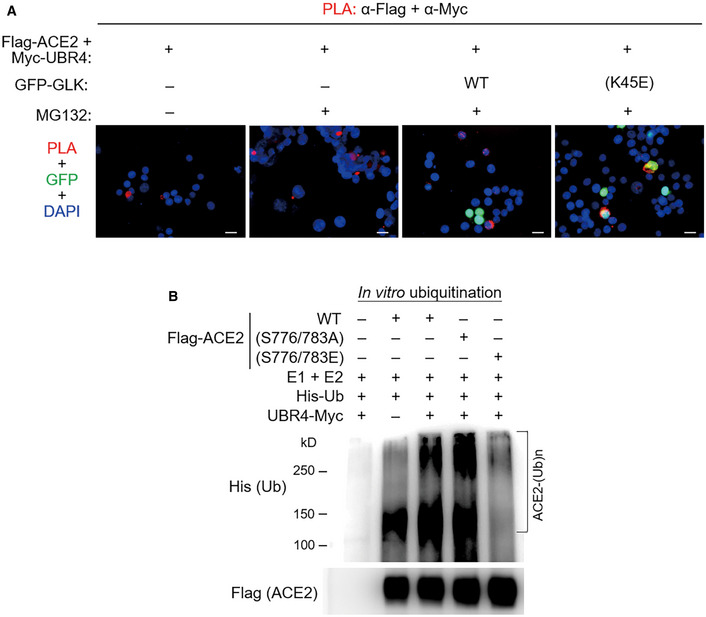
In situ PLA assays of the interaction between Flag‐tagged ACE2 and Myc‐tagged UBR4 proteins in HEK293T cells. Cells were co‐transfected with Flag‐ACE2 and Myc‐UBR2 plus either GFP‐GLK (green) or GFP‐GLK (K45E) kinase‐dead mutant (green) plasmids. Nuclei were stained with DAPI. Red dots represent direct interaction signals. Yellow color represents the co‐existence of PLA signal (red) and GLK (K45E) mutant protein (green). Original magnification, ×200. Scale bars, 20 μm.
- B
In vitro ubiquitination assays using Myc‐tagged UBR4 and Flag‐tagged ACE2 proteins with E1 ubiquitin‐activating enzyme, E2 ubiquitin‐conjugating enzyme, and His‐tagged ubiquitin. ACE2 ubiquitination and ACE2 were detected by immunoblotting with anti‐His and anti‐Flag antibodies, respectively. Data shown are representative results of three independent experiments.
- A
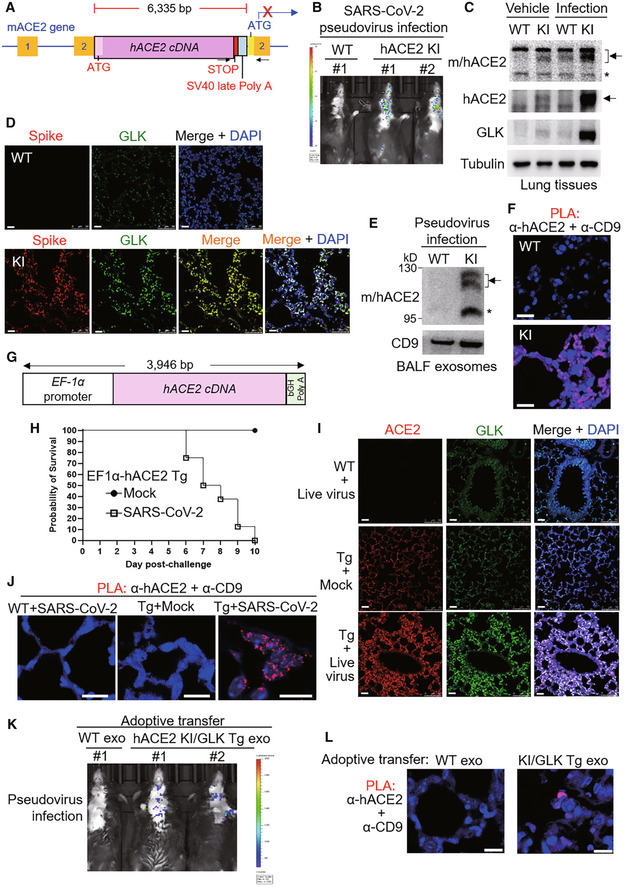
Schematic diagram of the human ACE2 knockin (hACE2 KI) mutant allele. The knockin with hACE2 cDNA plus SV40 late poly A signal results in blocking the transcription of mouse ACE2 (mACE2). The box with numbers, the exons of mACE2; arrowheads, the primers for genotyping PCR.
- B–F
Wild‐type and hACE2 KI mice were intranasally infected with SARS‐CoV‐2 pseudovirus. Infection efficiencies of SARS‐CoV‐2 pseudovirus into mouse tissues were measured by IVIS and presented as luminescence counts at 4 days postinfection (B). Immunoblotting of ACE2, GLK, and tubulin proteins in the lung tissues of infected or noninfected mice (C). Representative immunohistochemistry of the SARS‐CoV‐2 spike protein (in red) and GLK protein (in green) in the lung tissues of the infected hACE2 KI and wild‐type mice (D). Scale bars, 20 μm (D). Immunoblotting of CD9 and mouse/human ACE2 in the exosomes isolated from the BALFs (E) of the infected mice. Exosomes were isolated sequentially using ExoQuick kits and then ExoQuick ULTRA columns. The hACE2‐containing exosomes in the lung tissues of wild‐type and hACE2 KI mice were determined by in situ proximity ligation assays (PLA) of close proximity (< 40 nm) between hACE2 and the exosome marker CD9 using anti‐human ACE2 antibody plus anti‐CD9 antibody (F). Scale bars, 20 μm (F).
- G
Schematic depiction of the construction of the EF‐1α promoter‐driven, murine codon‐optimized human ACE2 (hACE2) cDNA with bovine growth hormone (bGH) poly A signal.
- H–J
Human ACE2 transgenic (EF1α‐hACE2 Tg) mice were intranasally infected with 2 × 10⁵ pfu of live SARS‐CoV‐2. The survival rates in EF1α‐hACE2 Tg mice challenged with/without SARS‐CoV‐2 were monitored (H). The lung tissues of infected miceon day 3 postinfection were collected and then analyzed by immunohistochemistry (IHC) and PLA assays. Representative IHC data of hACE2 (in red) and GLK (in green) in the lung tissues of the infected wild‐type and EF1α‐hACE2 Tg mice were shown (I). The hACE2‐containing exosomes in the lung tissues of infected wild‐type and EF1α‐hACE2 Tg mice were determined by PLA (J). Cell nuclei were stained with DAPI. Original magnification, 630. Scale bars, 10 μm.
- K, L
Adoptive transfer of ACE2‐containing exosomes facilitates SARS‐CoV‐2 pseudovirus infection. Serum exosomes (exo) isolated from wild‐type (WT) mice and hACE2 KI/activated GLK transgenic (PolII‐GLK E351K Tg) mice were adoptively transferred into wild‐type recipient mice every 3 days for 12 days, followed by SARS‐CoV‐2 pseudovirus infection. Infection efficiencies in mouse tissues were measured by IVIS and presented as luminescence counts at 3 days postinfection (K). hACE2‐containing exosomes in the lung tissues of exosome‐recipient wild‐type mice were determined by PLA using anti‐human ACE2 antibody plus anti‐CD9 antibody (L). Scale bars, 10 μm (L).
- A
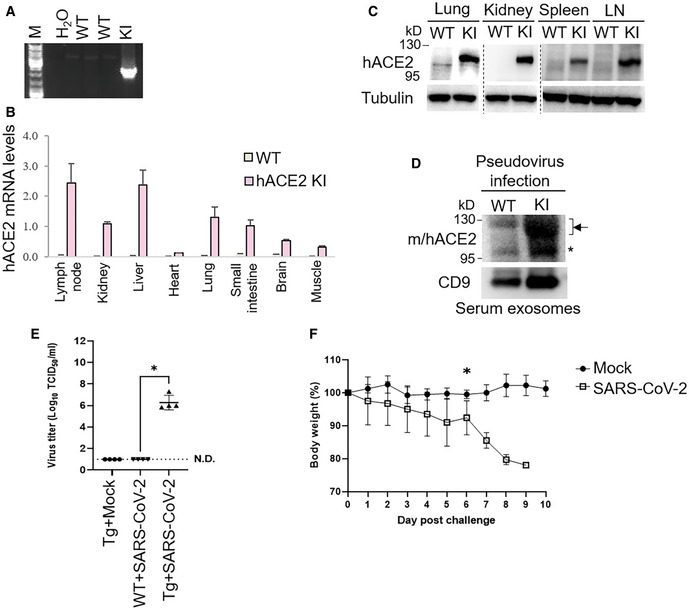
PCR analyses of hACE2 knockin allele in the genomic DNA from mouse tails. The PCR product of the 2,379‐bp band indicates the hACE2 knockin allele.
- B
Real‐time PCR analyses of knockin human ACE2 (hACE2) mRNA levels in the lymph nodes, kidneys, liver, heart, lungs, small intestine, brain, and muscle from wild‐type or hACE2 KI mice. The human ACE2 mRNA levels were normalized to mouse GAPDH mRNA levels. n = 2 (technical replicates) per group.
- C
Immunoblotting analyses of GLK, tubulin, and human ACE2 proteins in the lungs, kidneys, spleen, and lymph nodes of wild‐type and hACE2 KI mice.
- D
Immunoblotting of ACE2, GLK, and CD9 proteins in the exosomes isolated from the sera of the SARS‐CoV‐2 pseudovirus‐infected mice. Exosomes were isolated sequentially using ExoQuick kits and then ExoQuick ULTRA columns. Arrowheads denote glycosylated ACE2 proteins; asterisk denotes unglycosylated ACE2 proteins.
- E, F
EF1α‐hACE2 Tg and wild‐type mice were infected intranasally with 2 × 10⁵ pfu of live SARS‐CoV‐2. n = 4 (biological replicates) per group. EF1α‐hACE Tg mice were treated intranasally with PBS (Mock) as controls. On day 3 postinfection, the mice were sacrificed, and the lung tissues were homogenized for the TCID50 assay (E). The survival rate of EF1α‐hACE2 Tg mice challenged with live SARS‐CoV2 was monitored (F). WT, wild‐type mice; KI, hACE2 knockin mice; Tg, EF1α‐hACE2 transgenic mice. The number of infected mice was less than 3 from day 7 due to deaths; thus, the statistical analysis of panel F was only performed on data up to day 6 postinfection.
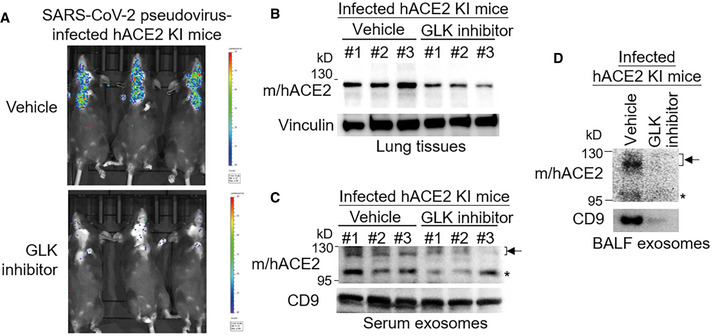
- A–D
Human ACE2 KI mice were intranasally infected with SARS‐CoV‐2 pseudovirus on Day 0 and Day 1. Mice were also treated with the GLK inhibitor verteporfin on Day 0 after infection. n = 3 (biological replicates) per group. Infection efficiencies of SARS‐CoV‐2 pseudovirus in mouse tissues were measured by IVIS and presented as luminescence counts on Day 2 (A). Immunoblotting of ACE2 and vinculin in the lung tissues of the infected hACE2 KI mice with/without the GLK inhibitor verteporfin (10 μM in 100 μl) treatment (B). Immunoblotting of ACE2 and CD9 in exosomes isolated from the sera (C) and BALF (D) of the infected mice with/without the GLK inhibitor verteporfin (10 μM in 100 μl) treatment. Arrowhead denotes glycosylated ACE2 proteins; asterisk denotes unglycosylated ACE2 proteins.
References
-
- Chen YM, Chuang HC, Lin WC, Tsai CY, Wu CW, Gong NR, Hung WT, Lan TH, Lan JL, Tan TH et al (2013) Germinal center kinase‐like kinase overexpression in T cells as a novel biomarker in rheumatoid arthritis. Arthritis Rheum 65: 2573–2582 - PubMed
-
- Chua RL, Lukassen S, Trump S, Hennig BP, Wendisch D, Pott F, Debnath O, Thurmann L, Kurth F, Volker MT et al (2020) COVID‐19 severity correlates with airway epithelium‐immune cell interactions identified by single‐cell analysis. Nat Biotechnol 38: 970–979 - PubMed
-
- Chuang HC, Chang CC, Teng CF, Hsueh CH, Chiu LL, Hsu PM, Lee MC, Hsu CP, Chen YR, Liu YC et al (2019a) MAP4K3/GLK promotes lung cancer metastasis by phosphorylating and activating IQGAP1. Cancer Res 79: 4978–4993 - PubMed
Publication types
MeSH terms
Substances
Associated data
- Actions
- Actions
LinkOut - more resources
Full Text Sources
Medical
Molecular Biology Databases
Research Materials
Miscellaneous
