

A Chromosome-Length Reference Genome for the Endangered Pacific Pocket Mouse Reveals Recent Inbreeding in a Historically Large Population
- PMID: 35894178
- PMCID: PMC9348616
- DOI: 10.1093/gbe/evac122
A Chromosome-Length Reference Genome for the Endangered Pacific Pocket Mouse Reveals Recent Inbreeding in a Historically Large Population
Abstract
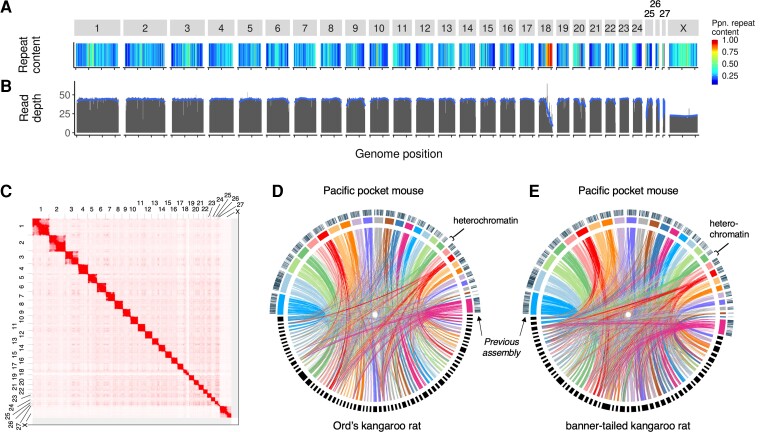
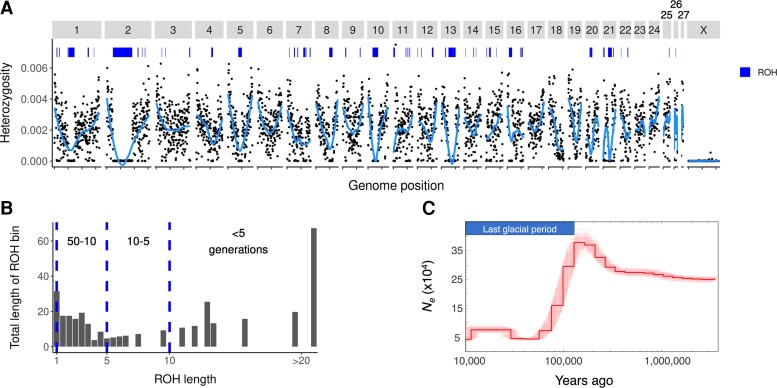
High-quality reference genomes are fundamental tools for understanding population history, and can provide estimates of genetic and demographic parameters relevant to the conservation of biodiversity. The federally endangered Pacific pocket mouse (PPM), which persists in three small, isolated populations in southern California, is a promising model for studying how demographic history shapes genetic diversity, and how diversity in turn may influence extinction risk. To facilitate these studies in PPM, we combined PacBio HiFi long reads with Omni-C and Hi-C data to generate a de novo genome assembly, and annotated the genome using RNAseq. The assembly comprised 28 chromosome-length scaffolds (N50 = 72.6 MB) and the complete mitochondrial genome, and included a long heterochromatic region on chromosome 18 not represented in the previously available short-read assembly. Heterozygosity was highly variable across the genome of the reference individual, with 18% of windows falling in runs of homozygosity (ROH) >1 MB, and nearly 9% in tracts spanning >5 MB. Yet outside of ROH, heterozygosity was relatively high (0.0027), and historical Ne estimates were large. These patterns of genetic variation suggest recent inbreeding in a formerly large population. Currently the most contiguous assembly for a heteromyid rodent, this reference genome provides insight into the past and recent demographic history of the population, and will be a critical tool for management and future studies of outbreeding depression, inbreeding depression, and genetic load.
Keywords: HiFi; chromosome conformation capture; effective population size; mitochondrial genome; runs of homozygosity.
© The Author(s) 2022. Published by Oxford University Press on behalf of Society for Molecular Biology and Evolution.
Figures
References
-
- Bernt M, et al. . 2013. MITOS: improved de novo metazoan mitochondrial genome annotation. Mol Phylogenet Evol. 69:313–319. - PubMed
Publication types
MeSH terms
Grants and funding
LinkOut - more resources
Full Text Sources
Miscellaneous
