

Rewiring of liver diurnal transcriptome rhythms by triiodothyronine (T3) supplementation
- PMID: 35894384
- PMCID: PMC9391036
- DOI: 10.7554/eLife.79405
Rewiring of liver diurnal transcriptome rhythms by triiodothyronine (T3) supplementation
Abstract
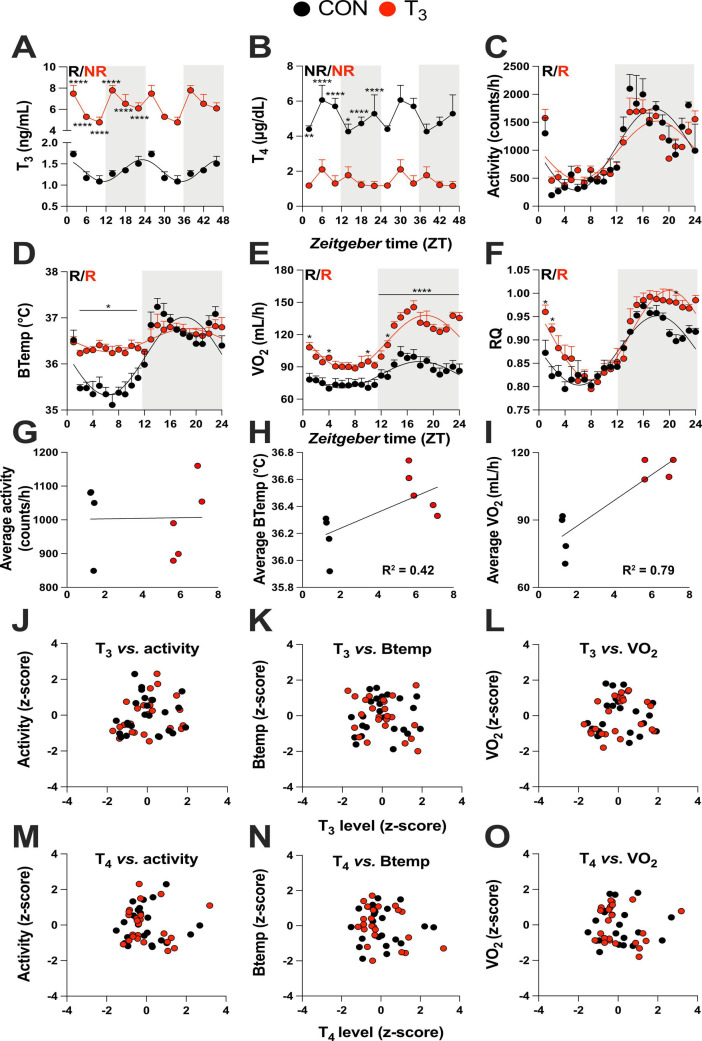
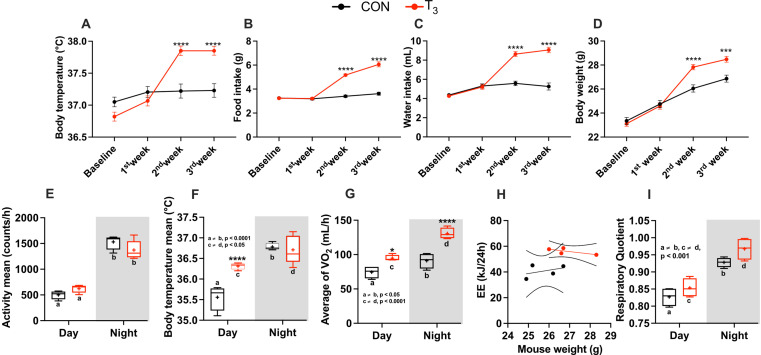
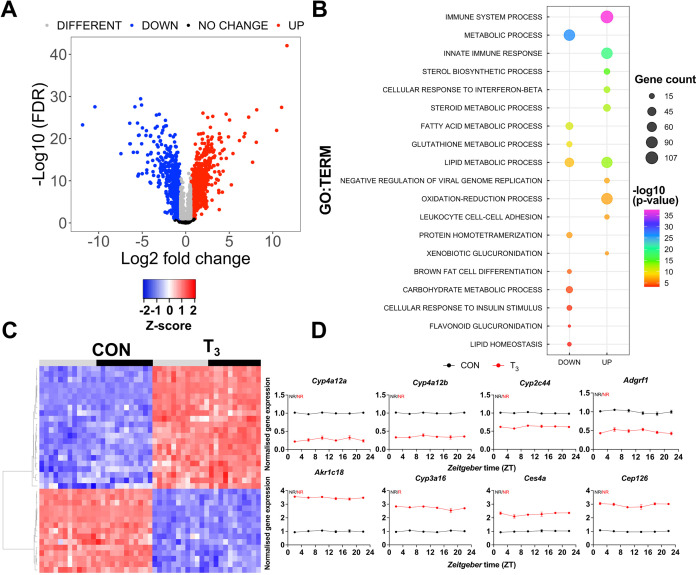
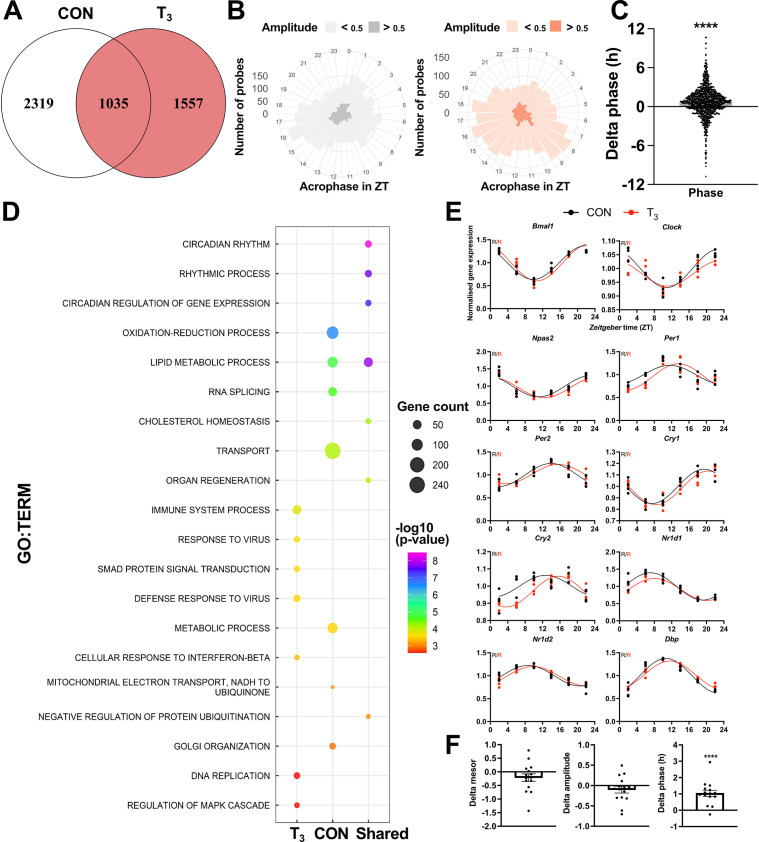
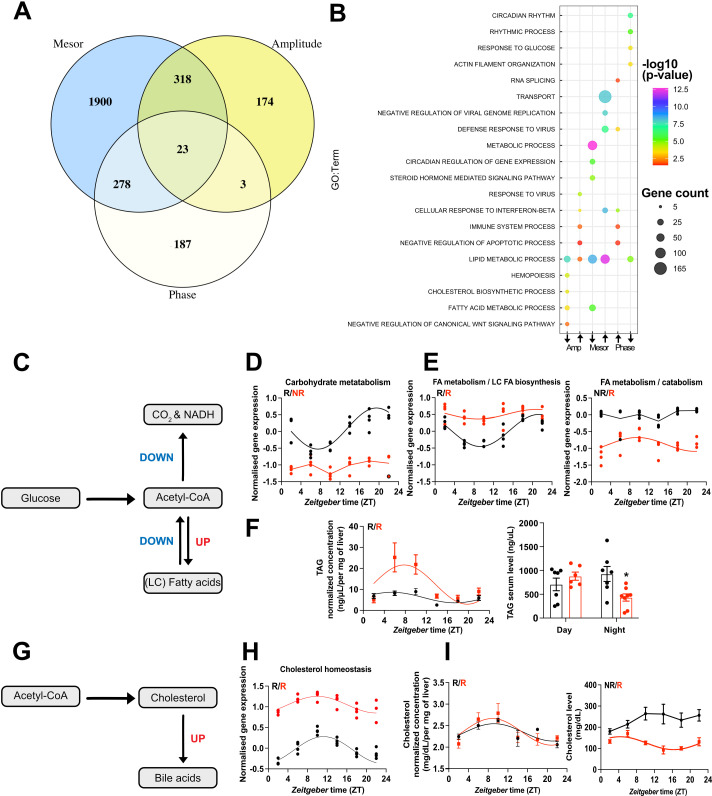
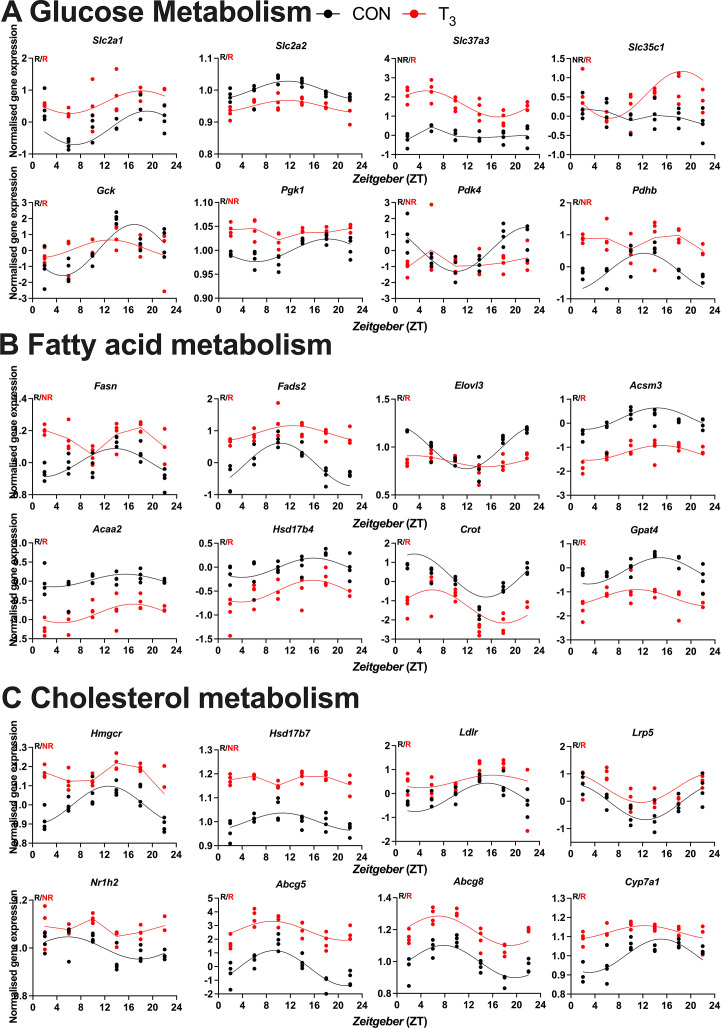
Diurnal (i.e., 24 hr) physiological rhythms depend on transcriptional programs controlled by a set of circadian clock genes/proteins. Systemic factors like humoral and neuronal signals, oscillations in body temperature, and food intake align physiological circadian rhythms with external time. Thyroid hormones (THs) are major regulators of circadian clock target processes such as energy metabolism, but little is known about how fluctuations in TH levels affect the circadian coordination of tissue physiology. In this study, a high triiodothyronine (T3) state was induced in mice by supplementing T3 in the drinking water, which affected body temperature, and oxygen consumption in a time-of-day-dependent manner. A 24-hr transcriptome profiling of liver tissue identified 37 robustly and time independently T3-associated transcripts as potential TH state markers in the liver. Such genes participated in xenobiotic transport, lipid and xenobiotic metabolism. We also identified 10-15% of the liver transcriptome as rhythmic in control and T3 groups, but only 4% of the liver transcriptome (1033 genes) were rhythmic across both conditions - amongst these, several core clock genes. In-depth rhythm analyses showed that most changes in transcript rhythms were related to mesor (50%), followed by amplitude (10%), and phase (10%). Gene set enrichment analysis revealed TH state-dependent reorganization of metabolic processes such as lipid and glucose metabolism. At high T3 levels, we observed weakening or loss of rhythmicity for transcripts associated with glucose and fatty acid metabolism, suggesting increased hepatic energy turnover. In summary, we provide evidence that tonic changes in T3 levels restructure the diurnal liver metabolic transcriptome independent of local molecular circadian clocks.
Keywords: circadian clock; computational biology; hyperthyroidism; liver; mouse; systems biology; thyroid hormones; transcriptome.
Plain language summary
Many environmental conditions, including light and temperature, vary with a daily rhythm that affects how animals interact with their surroundings. Indeed, most species have developed so-called circadian clocks: internal molecular timers that cycle approximately every 24 hours and regulate many bodily functions, including digestion, energy metabolism and sleep. The energy metabolism of the liver – the chemical reactions that occur in the organ to produce energy from nutrients – is controlled both by the circadian clock system, and by the hormones produced by a gland in the neck called the thyroid. However, the interaction between these two regulators is poorly understood. To address this question, de Assis, Harder et al. elevated the levels of thyroid hormones in mice by adding these hormones to their drinking water. Studying these mice showed that, although thyroid hormone levels were good indicators of how much energy mice burn in a day, they do not reflect daily fluctuations in metabolic rate faithfully. Additionally, de Assis, Harder et al. showed that elevating T3, the active form of thyroid hormone, led to a rewiring of the daily rhythms at which genes were turned on and off in the liver, affecting the daily timing of processes including fat and cholesterol metabolism. This occurred without changing the circadian clock of the liver directly. De Assis, Harder et al.’s results indicate that time-of-day critically affects the action of thyroid hormones in the liver. This suggests that patients with hypothyroidism, who produce low levels of thyroid hormones, may benefit from considering time-of-day as a factor in disease diagnosis, therapy and, potentially, prevention. Further data on the rhythmic regulation of thyroid action in humans, including in patients with hypothyroidism, are needed to further develop this approach.
© 2022, de Assis et al.
Conflict of interest statement
Ld, LH, JL, RP, MK, IC, IN, OR, JM, HO No competing interests declared
Figures
Update of
- doi: 10.1101/2022.04.28.489909
Similar articles
-
Hypothyroidism alters the rhythmicity of the central clock, body temperature and metabolism: evidence of Bmal1 transcriptional regulation by T3.J Physiol. 2024 Oct;602(19):4865-4887. doi: 10.1113/JP286449. Epub 2024 Sep 15. J Physiol. 2024. PMID: 39277824
-
Tuning of liver circadian transcriptome rhythms by thyroid hormone state in male mice.Sci Rep. 2024 Jan 5;14(1):640. doi: 10.1038/s41598-023-50374-z. Sci Rep. 2024. PMID: 38182610 Free PMC article.
-
Sensory conflict disrupts circadian rhythms in the sea anemone Nematostella vectensis.Elife. 2023 Apr 6;12:e81084. doi: 10.7554/eLife.81084. Elife. 2023. PMID: 37022138 Free PMC article.
-
Non-rhythmic modulators of the circadian system: A new class of circadian modulators.Int Rev Cell Mol Biol. 2025;393:141-162. doi: 10.1016/bs.ircmb.2024.04.003. Epub 2024 May 9. Int Rev Cell Mol Biol. 2025. PMID: 40390461 Review.
-
Chronopharmacological strategies focused on chrono-drug discovery.Pharmacol Ther. 2019 Oct;202:72-90. doi: 10.1016/j.pharmthera.2019.05.018. Epub 2019 Jun 5. Pharmacol Ther. 2019. PMID: 31173839 Review.
Cited by
-
Mice lacking DIO3 exhibit sex-specific alterations in circadian patterns of corticosterone and gene expression in metabolic tissues.BMC Mol Cell Biol. 2024 Mar 29;25(1):11. doi: 10.1186/s12860-024-00508-6. BMC Mol Cell Biol. 2024. PMID: 38553695 Free PMC article.
-
Grape-Seed Proanthocyanidin Extract (GSPE) Modulates Diurnal Rhythms of Hepatic Metabolic Genes and Metabolites, and Reduces Lipid Deposition in Cafeteria-Fed Rats in a Time-of-Day-Dependent Manner.Mol Nutr Food Res. 2024 Dec;68(23):e2400554. doi: 10.1002/mnfr.202400554. Epub 2024 Nov 11. Mol Nutr Food Res. 2024. PMID: 39523911 Free PMC article.
-
Epigenetic regulation of thyroid hormone action in human metabolic dysfunction-associated steatohepatitis.Eur Thyroid J. 2024 Sep 21;13(5):e240080. doi: 10.1530/ETJ-24-0080. Print 2024 Oct 1. Eur Thyroid J. 2024. PMID: 39312733 Free PMC article.
-
Transcriptomic landscape of hyperthyroidism in mice overexpressing thyroid-stimulating hormone.iScience. 2024 Dec 10;28(1):111565. doi: 10.1016/j.isci.2024.111565. eCollection 2025 Jan 17. iScience. 2024. PMID: 39811643 Free PMC article.
-
Regeneration of Thyroid Glands in the Spleen Restores Homeostasis in Thyroidectomy Mice.Adv Sci (Weinh). 2024 Feb;11(6):e2305913. doi: 10.1002/advs.202305913. Epub 2023 Dec 7. Adv Sci (Weinh). 2024. PMID: 38059822 Free PMC article.
References
-
- Cioffi F, Zambad SP, Chhipa L, Senese R, Busiello RA, Tuli D, Munshi S, Moreno M, Lombardi A, Gupta RC, Chauthaiwale V, Dutt C, de Lange P, Silvestri E, Lanni A, Goglia F. TRC150094, a novel functional analog of iodothyronines, reduces adiposity by increasing energy expenditure and fatty acid oxidation in rats receiving a high-fat diet. FASEB Journal. 2010;24:3451–3461. doi: 10.1096/fj.10-157115. - DOI - PubMed
Publication types
MeSH terms
Substances
Associated data
- Actions
LinkOut - more resources
Full Text Sources
Molecular Biology Databases
Miscellaneous
