. 2022 Oct 5;12(10):2414-2433.
doi: 10.1158/2159-8290.CD-22-0661.

A Cancer Cell-Intrinsic GOT2-PPARδ Axis Suppresses Antitumor Immunity

Affiliations

A Cancer Cell-Intrinsic GOT2-PPARδ Axis Suppresses Antitumor Immunity

Jaime Abrego et al. Cancer Discov. .

Abstract

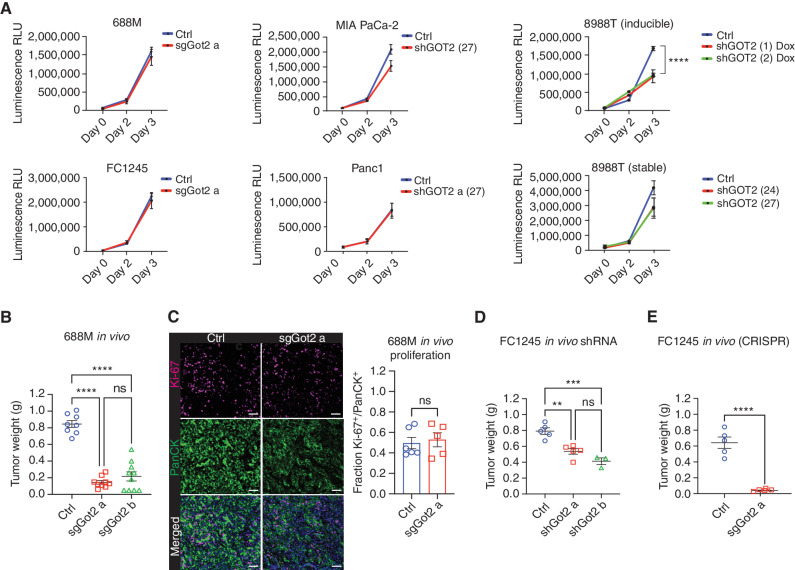
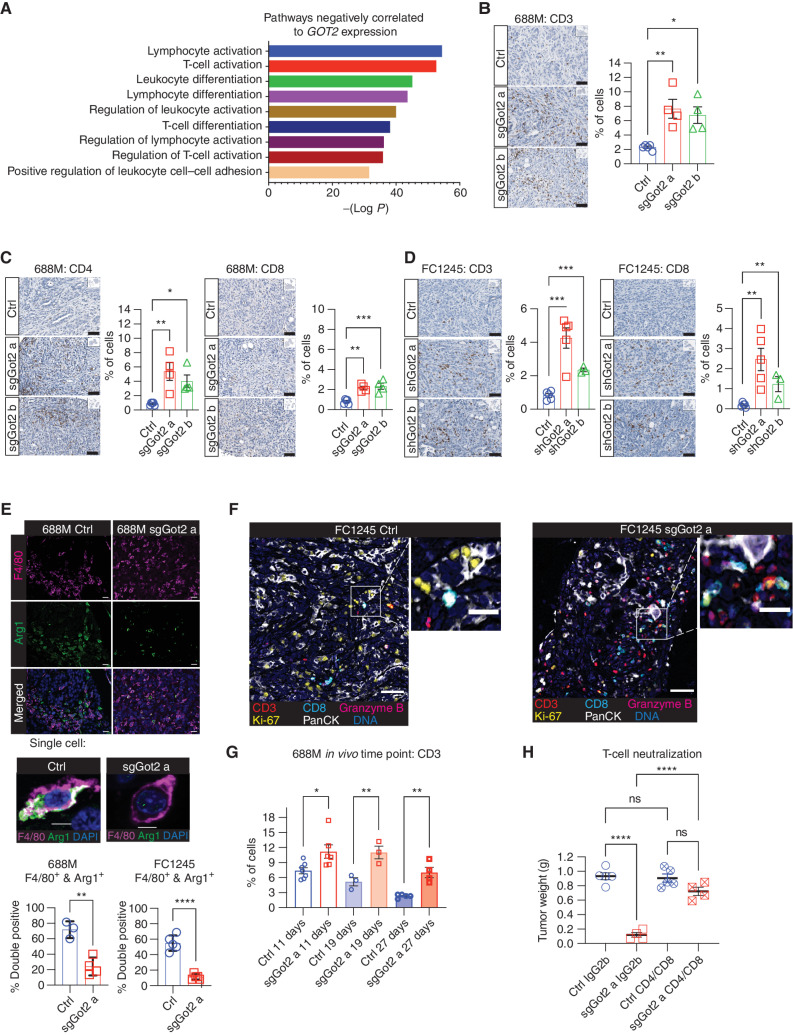
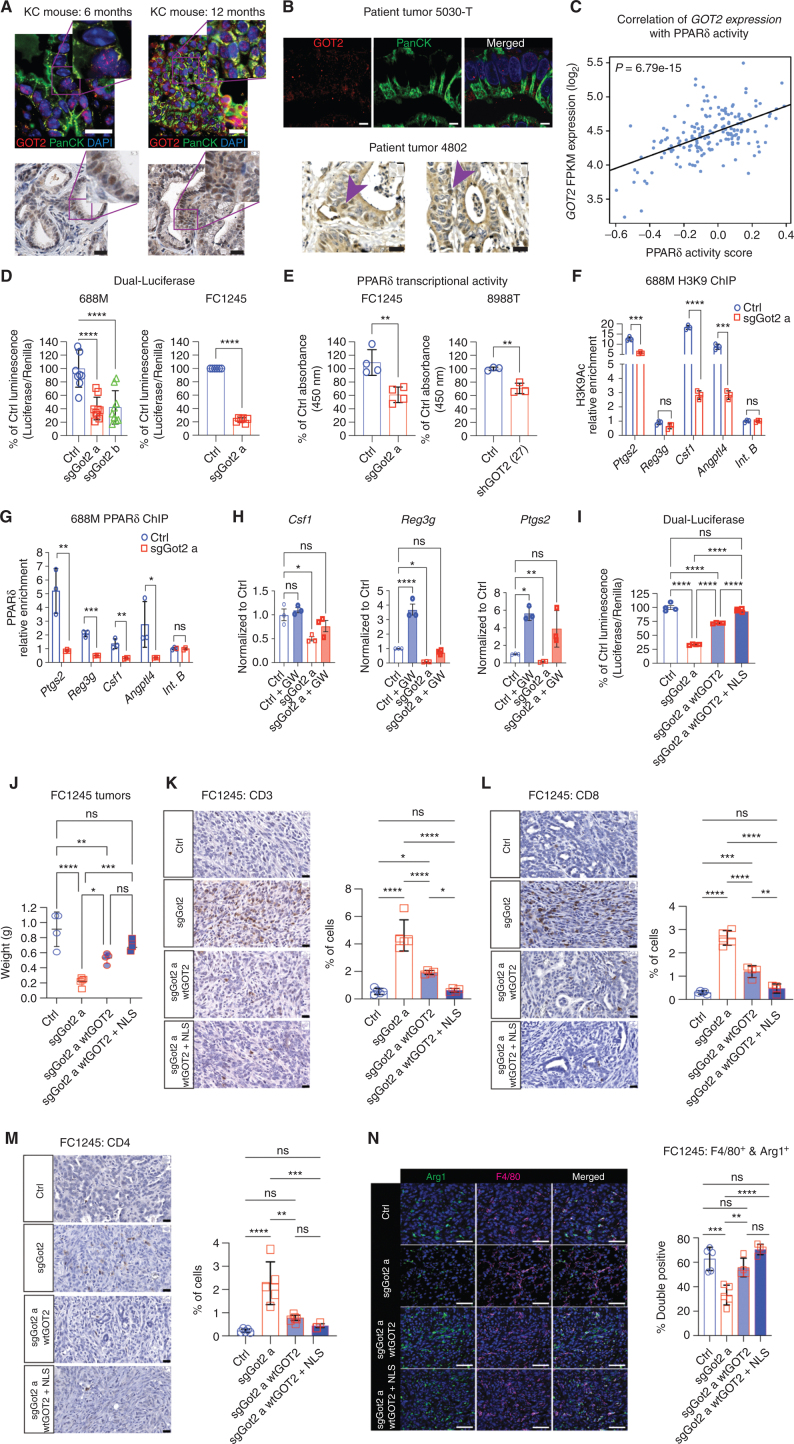
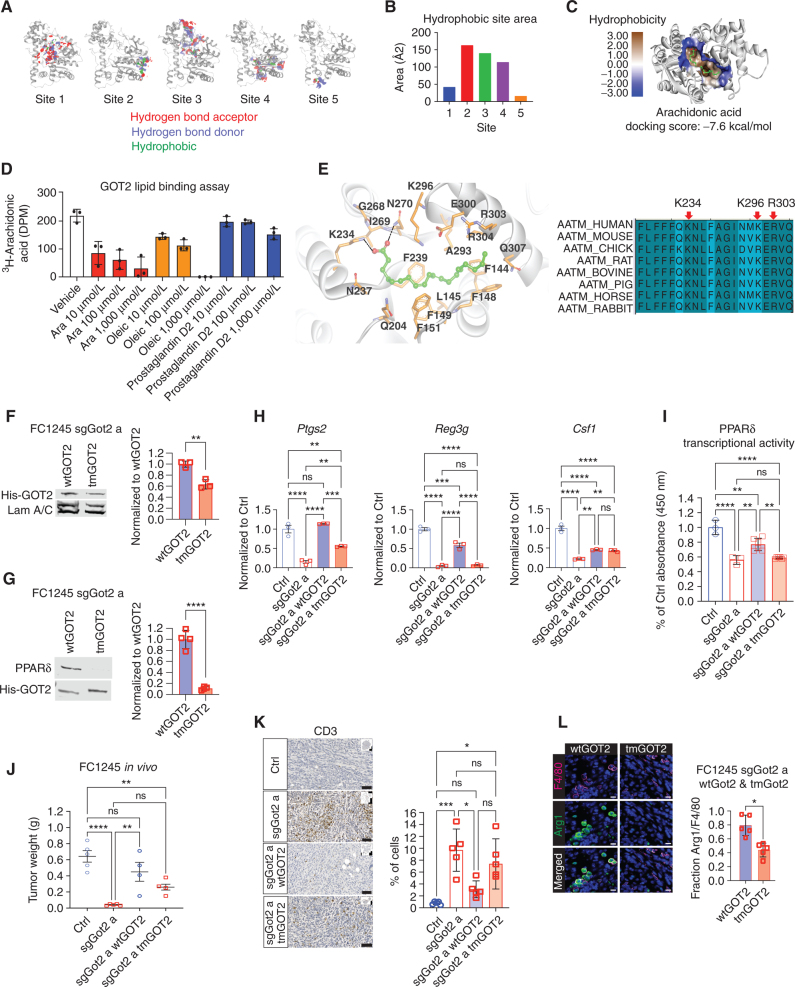
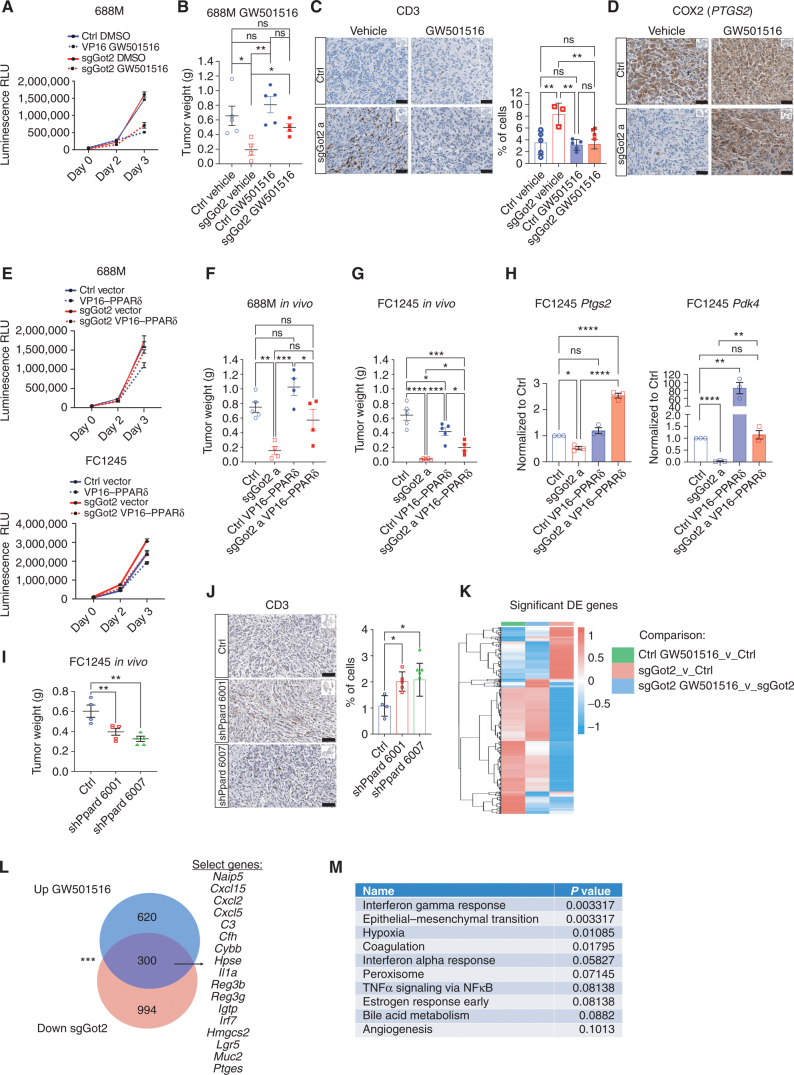
Despite significant recent advances in precision medicine, pancreatic ductal adenocarcinoma (PDAC) remains near uniformly lethal. Although immune-modulatory therapies hold promise to meaningfully improve outcomes for patients with PDAC, the development of such therapies requires an improved understanding of the immune evasion mechanisms that characterize the PDAC microenvironment. Here, we show that cancer cell-intrinsic glutamic-oxaloacetic transaminase 2 (GOT2) shapes the immune microenvironment to suppress antitumor immunity. Mechanistically, we find that GOT2 functions beyond its established role in the malate-aspartate shuttle and promotes the transcriptional activity of nuclear receptor peroxisome proliferator-activated receptor delta (PPARδ), facilitated by direct fatty acid binding. Although GOT2 is dispensable for cancer cell proliferation in vivo, the GOT2-PPARδ axis promotes spatial restriction of both CD4+ and CD8+ T cells from the tumor microenvironment. Our results demonstrate a noncanonical function for an established mitochondrial enzyme in transcriptional regulation of immune evasion, which may be exploitable to promote a productive antitumor immune response.

Significance: Prior studies demonstrate the important moonlighting functions of metabolic enzymes in cancer. We find that the mitochondrial transaminase GOT2 binds directly to fatty acid ligands that regulate the nuclear receptor PPARδ, and this functional interaction critically regulates the immune microenvironment of pancreatic cancer to promote tumor progression. See related commentary by Nwosu and di Magliano, p. 2237.. This article is highlighted in the In This Issue feature, p. 2221.


Figures

Figure 1. GOT2 promotes pancreatic tumor progression without impacting proliferation. A, Viable cell measurements in the indicated PDAC cell lines. Data are presented as mean ± SEM from biological triplicates. ****, P < 0.0001 by one-way ANOVA. Dox, doxycycline; RLU, relative light unit. Numbers in parentheses are the short hairpins (shRNAs) used for the GOT2 knockdowns. B, PDAC tumor weight at the experimental endpoint, 34 days after orthotopic transplantation of 688M cells into immune-competent hosts. Ctrl: n = 8, sgGot2 a: n = 9, sgGot2 b: n = 10. Data are presented as mean ± SEM. ns = not significant. ****, P < 0.0001 by one-way ANOVA. C, IHC staining of tumors in B for Ki-67 (proliferation) and pan-cytokeratin (panCK; tumor cells), with a DAPI counterstain (nuclei). Representative images are shown on the left (scale bars = 50 μm), with quantification on the right (ctrl: n = 6, sgGot2: n = 5). Data are presented as mean ± SEM. ns = not significant by an unpaired t test. D, PDAC tumor weight at the experimental endpoint, 22 days after orthotopic transplantation of FC1245 cells into immune-competent hosts. Ctrl: n = 5, shGot2 a: n = 5, shGot2 b: n = 3. Data are presented as mean ± SEM. ns = not significant. **, P < 0.01; ***, P < 0.001 by one-way ANOVA. E, PDAC tumor weight at the experimental endpoint, 18 days after orthotopic transplantation of FC1245 cells into immune-competent hosts. Ctrl: n = 5, sgGot2 a: n = 5. Data are presented as mean ± SEM. ****, P < 0.0001 by an unpaired t test.
Figure 1.
GOT2 promotes pancreatic tumor progression without impacting proliferation. A, Viable cell measurements in the indicated PDAC cell lines. Data are presented as mean ± SEM from biological triplicates. ****, P < 0.0001 by one-way ANOVA. Dox, doxycycline; RLU, relative light unit. Numbers in parentheses are the short hairpins (shRNAs) used for the GOT2 knockdowns. B, PDAC tumor weight at the experimental endpoint, 34 days after orthotopic transplantation of 688M cells into immune-competent hosts. Ctrl: n = 8, sgGot2 a: n = 9, sgGot2 b: n = 10. Data are presented as mean ± SEM. ns = not significant. ****, P < 0.0001 by one-way ANOVA. C, IHC staining of tumors in B for Ki-67 (proliferation) and pan-cytokeratin (panCK; tumor cells), with a DAPI counterstain (nuclei). Representative images are shown on the left (scale bars = 50 μm), with quantification on the right (ctrl: n = 6, sgGot2: n = 5). Data are presented as mean ± SEM. ns = not significant by an unpaired t test. D, PDAC tumor weight at the experimental endpoint, 22 days after orthotopic transplantation of FC1245 cells into immune-competent hosts. Ctrl: n = 5, shGot2 a: n = 5, shGot2 b: n = 3. Data are presented as mean ± SEM. ns = not significant. **, P < 0.01; ***, P < 0.001 by one-way ANOVA. E, PDAC tumor weight at the experimental endpoint, 18 days after orthotopic transplantation of FC1245 cells into immune-competent hosts. Ctrl: n = 5, sgGot2 a: n = 5. Data are presented as mean ± SEM. ****, P < 0.0001 by an unpaired t test.
Figure 2. PDAC cell–intrinsic GOT2 suppresses T cell–dependent immunologic control of tumor growth. A, Metascape pathway analysis depicting the top transcriptional programs inversely correlated with GOT2 expression in human PDAC. B and C, IHC staining of control and sgGot2 688M tumors for T-cell marker CD3 (B) and subtype markers CD4 and CD8 (C). Representative images are shown on the left (scale bars = 50 μm), with quantification on the right (ctrl: n = 5, sgGot2 a: n = 4, sgGot2 b: n = 4). Data are presented as mean ± SEM. *, P < 0.05; **, P < 0.01; ***, P < 0.001 by one-way ANOVA. D, IHC staining of control and shGot2 FC1245 tumors for T-cell markers CD3 and CD8. Representative images are shown on the left (scale bars = 50 μm), with quantification on the right (ctrl: n = 5, shGot2 a: n = 5, shGot2 b: n = 3). Data are presented as mean ± SEM. **, P < 0.01; ***, P < 0.001 by one-way ANOVA. E, IHC costaining of control and sgGot2 or shGot2 PDAC for macrophage marker F4/80 and immunosuppressive factor arginase-1 (Arg1). Representative images are from 688M tumors (scale bar on 20× images = 10 μm, scale bar on 63× images = 5 μm). Quantification of double-positive cells out of total F4/80+ cells in the 688M and FC1245 models is on the right; data are presented as mean ± SEM. **, P < 0.01; ****, P < 0.0001 by an unpaired t test. F, Multiplex IHC staining of control and sgGot2 FC1245 tumors for the indicated markers (large images, scale bar = 50 μm; insets, scale bar = 20 μm). G, Quantification of CD3 IHC on 688M PDAC at the indicated time points after transplantation (ctrl d11: n = 7, sgGot2 a d11: n = 6, ctrl d19: n = 3, sgGot2 a d19: n = 3, ctrl d27: n = 5, sgGot2 a d27: n = 4). *, P < 0.05; **, P < 0.01 by an unpaired t test. H, PDAC tumor weight at the experimental endpoint, 27 days after orthotopic transplantation of 688M cells and treatment with isotype control or T-cell depleting antibodies (details in Methods). Ctrl: n = 5 per cohort, sgGot2 a: n = 4 per cohort. Data are presented as mean ± SEM. ns = not significant. ****, P < 0.0001 by one-way ANOVA.
Figure 2.
PDAC cell–intrinsic GOT2 suppresses T cell–dependent immunologic control of tumor growth. A, Metascape pathway analysis depicting the top transcriptional programs inversely correlated with GOT2 expression in human PDAC. B and C, IHC staining of control and sgGot2 688M tumors for T-cell marker CD3 (B) and subtype markers CD4 and CD8 (C). Representative images are shown on the left (scale bars = 50 μm), with quantification on the right (ctrl: n = 5, sgGot2 a: n = 4, sgGot2 b: n = 4). Data are presented as mean ± SEM. *, P < 0.05; **, P < 0.01; ***, P < 0.001 by one-way ANOVA. D, IHC staining of control and shGot2 FC1245 tumors for T-cell markers CD3 and CD8. Representative images are shown on the left (scale bars = 50 μm), with quantification on the right (ctrl: n = 5, shGot2 a: n = 5, shGot2 b: n = 3). Data are presented as mean ± SEM. **, P < 0.01; ***, P < 0.001 by one-way ANOVA. E, IHC costaining of control and sgGot2 or shGot2 PDAC for macrophage marker F4/80 and immunosuppressive factor arginase-1 (Arg1). Representative images are from 688M tumors (scale bar on 20× images = 10 μm, scale bar on 63× images = 5 μm). Quantification of double-positive cells out of total F4/80+ cells in the 688M and FC1245 models is on the right; data are presented as mean ± SEM. **, P < 0.01; ****, P < 0.0001 by an unpaired t test. F, Multiplex IHC staining of control and sgGot2 FC1245 tumors for the indicated markers (large images, scale bar = 50 μm; insets, scale bar = 20 μm). G, Quantification of CD3 IHC on 688M PDAC at the indicated time points after transplantation (ctrl d11: n = 7, sgGot2 a d11: n = 6, ctrl d19: n = 3, sgGot2 a d19: n = 3, ctrl d27: n = 5, sgGot2 a d27: n = 4). *, P < 0.05; **, P < 0.01 by an unpaired t test. H, PDAC tumor weight at the experimental endpoint, 27 days after orthotopic transplantation of 688M cells and treatment with isotype control or T-cell depleting antibodies (details in Methods). Ctrl: n = 5 per cohort, sgGot2 a: n = 4 per cohort. Data are presented as mean ± SEM. ns = not significant. ****, P < 0.0001 by one-way ANOVA.
Figure 3. GOT2 positively regulates PPARδ activity. A, IHC staining for GOT2 or GOT2 and panCK in pancreas tissues from KrasLSL-G12D/+;Pdx1-Cre (KC) mice at 6 or 12 months of age (representative of n = 4 per time point). Scale bars = 20 μm. B, IHC staining for GOT2 or GOT2 and panCK in human PDAC (representative of n = 5). Fluorescent images: scale bar = 5 μm, brightfield image: scale bar = 20 μm. Arrowheads indicate examples of tumor cells with nuclear GOT2. C, Scatter plot depicting the correlation of GOT2 expression with expression of PPARδ target genes in human PDAC per TCGA RNA-seq data (n = 177). FPKM, fragments per kilobase of transcript per million mapped reads. D, Luciferase assay for PPRE activity in the indicated cell lines, normalized to renilla, presented as mean ± SEM. ****, P < 0.0001 by one-way ANOVA (688M) or an unpaired t test (FC1245). E, PPARδ transcriptional activity assay, reading out binding to immobilized DNA containing PPREs, in the indicated cell lines. Data are presented as mean ± SEM from four (FC1245) or three (8988T) independent experiments. **, P < 0.01 by an unpaired t test. F and G, ChIP for H3K9Ac (F) and PPARδ (G) in control or sgGot2 688M PDAC cells, followed by qPCR for proximal promoter regions of the indicated genes. Data were normalized to an intergenic region (int. B) and are presented as mean ± SEM from biological triplicates. ns = not significant. *, P < 0.05; **, P < 0.01; ***, P < 0.001; ****, P < 0.0001 by an unpaired t test. H, qPCR for the indicated PPARδ-regulated genes in control or GOT2-knockdown PDAC cells, treated with vehicle (DMSO) or the PPARδ synthetic agonist GW501516 (GW; 100 nmol/L). Data are presented as mean ± SEM from biological triplicates. ns = not significant. *, P < 0.05; **, P < 0.01; ****, P < 0.0001 by one-way ANOVA. I, Luciferase assay for PPRE activity in sgGOT2 PDAC cells reconstituted with wild-type GOT2 (wtGOT2) or NLS-wtGOT2. Data are presented as mean ± SEM from four independent experiments. ns = not significant. ****, P < 0.0001 by one-way ANOVA. J, PDAC tumor weight at the experimental endpoint, 22 days after orthotopic transplantation of FC1245 cells into immune-competent hosts (n = 4–5 per arm). Data are presented as mean ± SEM. ns = not significant. *, P < 0.05; **, P < 0.01; ***, P < 0.001; ****, P < 0.0001 by one-way ANOVA. K–M, IHC staining and quantification of T-cell markers CD3, CD8, and CD4 in FC1245 tumors (n = 4–5 per arm, scale bars = 20 μm). Data are presented as mean ± SEM. ns = not significant. *, P < 0.05; **, P < 0.01; ***, P < 0.001; ****, P < 0.0001 by one-way ANOVA. N, IHC staining and quantification of CD68 and Arg1 in FC1245 tumors (n = 4–5 per arm, scale bars = 20 μm). Data are presented as mean ± SEM. ns = not significant. **, P < 0.01; ***, P < 0.001; ****, P < 0.0001 by one-way ANOVA.
Figure 3.
GOT2 positively regulates PPARδ activity. A, IHC staining for GOT2 or GOT2 and panCK in pancreas tissues from KrasLSL-G12D/+;Pdx1-Cre (KC) mice at 6 or 12 months of age (representative of n = 4 per time point). Scale bars = 20 μm. B, IHC staining for GOT2 or GOT2 and panCK in human PDAC (representative of n = 5). Fluorescent images: scale bar = 5 μm, brightfield image: scale bar = 20 μm. Arrowheads indicate examples of tumor cells with nuclear GOT2. C, Scatter plot depicting the correlation of GOT2 expression with expression of PPARδ target genes in human PDAC per TCGA RNA-seq data (n = 177). FPKM, fragments per kilobase of transcript per million mapped reads. D, Luciferase assay for PPRE activity in the indicated cell lines, normalized to renilla, presented as mean ± SEM. ****, P < 0.0001 by one-way ANOVA (688M) or an unpaired t test (FC1245). E, PPARδ transcriptional activity assay, reading out binding to immobilized DNA containing PPREs, in the indicated cell lines. Data are presented as mean ± SEM from four (FC1245) or three (8988T) independent experiments. **, P < 0.01 by an unpaired t test. F and G, ChIP for H3K9Ac (F) and PPARδ (G) in control or sgGot2 688M PDAC cells, followed by qPCR for proximal promoter regions of the indicated genes. Data were normalized to an intergenic region (int. B) and are presented as mean ± SEM from biological triplicates. ns = not significant. *, P < 0.05; **, P < 0.01; ***, P < 0.001; ****, P < 0.0001 by an unpaired t test. H, qPCR for the indicated PPARδ-regulated genes in control or GOT2-knockdown PDAC cells, treated with vehicle (DMSO) or the PPARδ synthetic agonist GW501516 (GW; 100 nmol/L). Data are presented as mean ± SEM from biological triplicates. ns = not significant. *, P < 0.05; **, P < 0.01; ****, P < 0.0001 by one-way ANOVA. I, Luciferase assay for PPRE activity in sgGOT2 PDAC cells reconstituted with wild-type GOT2 (wtGOT2) or NLS-wtGOT2. Data are presented as mean ± SEM from four independent experiments. ns = not significant. ****, P < 0.0001 by one-way ANOVA. J, PDAC tumor weight at the experimental endpoint, 22 days after orthotopic transplantation of FC1245 cells into immune-competent hosts (n = 4–5 per arm). Data are presented as mean ± SEM. ns = not significant. *, P < 0.05; **, P < 0.01; ***, P < 0.001; ****, P < 0.0001 by one-way ANOVA. K–M, IHC staining and quantification of T-cell markers CD3, CD8, and CD4 in FC1245 tumors (n = 4–5 per arm, scale bars = 20 μm). Data are presented as mean ± SEM. ns = not significant. *, P < 0.05; **, P < 0.01; ***, P < 0.001; ****, P < 0.0001 by one-way ANOVA. N, IHC staining and quantification of CD68 and Arg1 in FC1245 tumors (n = 4–5 per arm, scale bars = 20 μm). Data are presented as mean ± SEM. ns = not significant. **, P < 0.01; ***, P < 0.001; ****, P < 0.0001 by one-way ANOVA.
Figure 4. Figure 4. GOT2 binds to the PPARδ ligand directly. A, Hydrophobic site maps on the GOT2 protein, indicating putative fatty acid binding domains. Red: hydrogen bond acceptor, blue: hydrogen bond donor, green: hydrophobic. B, Plot of the hydrophobic area of the putative fatty acid binding sites depicted in A. C, Docking model of arachidonic acid in site 2 on the GOT2 protein, with bioenergetic docking score (−7.6 kcal/mol) indicated below. D, Competitive fatty acid binding assay measuring radioactivity upon incubating purified human GOT2 with 3H-arachidonic acid (1 μmol/L) and the indicated concentrations of cold lipid species. Ara, cold arachidonic acid. E, Left, model of arachidonic acid bound to GOT2, indicating amino acid residues that potentially facilitate binding. Based on this model, K234, K296, and R303 were selected for mutation to alanine. Right, conservation of GOT2 amino acid sequence, including the three residues predicted to support arachidonic acid binding, among higher vertebrates. F, Western blots indicating nuclear and whole-cell abundance of wtGOT2 and tmGOT2 (both His-tagged) in reconstituted sgGOT2 FC1245 PDAC cells. Nuclear GOT2 quantification appears to the right. **, P < 0.01 by an unpaired t test. G, Western blots from whole-cell lysates or His pulldowns from the cells depicted in F. ****, P < 0.0001 by an unpaired t test. H, qPCR for the indicated PPARδ-regulated genes in FC1245 stable cell lines, normalized to 36b4. Data are presented as mean ± SEM from biological triplicates. ns = not significant. **, P < 0.01; ***, P < 0.001; ****, P < 0.0001 by one-way ANOVA. I, PPARδ transcriptional activity assay in the indicated FC1245 stable cell lines. Data are presented as mean ± SEM from three to six biological replicates. ns = not significant. **, P < 0.01; ****, P < 0.0001 by one-way ANOVA. J, PDAC tumor weight at the experimental endpoint, 18 days after orthotopic transplantation of the indicated FC1245 cells. Ctrl: n = 5, sgGot2 a: n = 5, sgGot2 a + wtGOT2: n = 4, sgGot2 a + tmGOT2: n = 5. Ctrl and sgGot2 arms here are also depicted in Fig. 1E. Data are presented as mean ± SEM. ns = not significant. **, P < 0.01; ****, P < 0.0001 by one-way ANOVA. K and L, IHC staining (scale bars = 50 μm) and quantification for T cells (K; CD3) and macrophages (L; F4/80 and Arg1) in PDAC harboring wtGOT2 or tmGOT2 (n = 5 per arm). Data are presented as mean ± SEM. ns = not significant. *, P < 0.05; ***, P < 0.001 by one-way ANOVA (K) or an unpaired t test (L).
GOT2 binds to the PPARδ ligand directly. A, Hydrophobic site maps on the GOT2 protein, indicating putative fatty acid binding domains. Red: hydrogen bond acceptor, blue: hydrogen bond donor, green: hydrophobic. B, Plot of the hydrophobic area of the putative fatty acid binding sites depicted in A. C, Docking model of arachidonic acid in site 2 on the GOT2 protein, with bioenergetic docking score (−7.6 kcal/mol) indicated below. D, Competitive fatty acid binding assay measuring radioactivity upon incubating purified human GOT2 with 3H-arachidonic acid (1 μmol/L) and the indicated concentrations of cold lipid species. Ara, cold arachidonic acid. E, Left, model of arachidonic acid bound to GOT2, indicating amino acid residues that potentially facilitate binding. Based on this model, K234, K296, and R303 were selected for mutation to alanine. Right, conservation of GOT2 amino acid sequence, including the three residues predicted to support arachidonic acid binding, among higher vertebrates. F, Western blots indicating nuclear and whole-cell abundance of wtGOT2 and tmGOT2 (both His-tagged) in reconstituted sgGOT2 FC1245 PDAC cells. Nuclear GOT2 quantification appears to the right. **, P < 0.01 by an unpaired t test. G, Western blots from whole-cell lysates or His pulldowns from the cells depicted in F. ****, P < 0.0001 by an unpaired t test. H, qPCR for the indicated PPARδ-regulated genes in FC1245 stable cell lines, normalized to 36b4. Data are presented as mean ± SEM from biological triplicates. ns = not significant. **, P < 0.01; ***, P < 0.001; ****, P < 0.0001 by one-way ANOVA. I, PPARδ transcriptional activity assay in the indicated FC1245 stable cell lines. Data are presented as mean ± SEM from three to six biological replicates. ns = not significant. **, P < 0.01; ****, P < 0.0001 by one-way ANOVA. J, PDAC tumor weight at the experimental endpoint, 18 days after orthotopic transplantation of the indicated FC1245 cells. Ctrl: n = 5, sgGot2 a: n = 5, sgGot2 a + wtGOT2: n = 4, sgGot2 a + tmGOT2: n = 5. Ctrl and sgGot2 arms here are also depicted in Fig. 1E. Data are presented as mean ± SEM. ns = not significant. **, P < 0.01; ****, P < 0.0001 by one-way ANOVA. K and L, IHC staining (scale bars = 50 μm) and quantification for T cells (K; CD3) and macrophages (L; F4/80 and Arg1) in PDAC harboring wtGOT2 or tmGOT2 (n = 5 per arm). Data are presented as mean ± SEM. ns = not significant. *, P < 0.05; ***, P < 0.001 by one-way ANOVA (K) or an unpaired t test (L).
Figure 5. PPARδ activation restores tumor growth and T-cell exclusion in the absence of GOT2. A, Viable cell measurements in control or sgGot2 PDAC cells treated with vehicle or 100 nmol/L GW501516. RLU, relative light unit. B, PDAC tumor weight at the experimental endpoint, 30 days after orthotopic transplantation of the control or sgGot2 cells, with daily i.p. injection of vehicle or 4 mg/kg GW501516. Ctrl: n = 5 per cohort, sgGot2: n = 4 per cohort. Data are presented as mean ± SEM. ns = not significant. *, P < 0.05; **, P < 0.01 by one-way ANOVA. C, IHC staining of control and sgGot2 688M tumors treated with vehicle or GW501516 as in B for the T-cell marker CD3. Representative images are shown above (scale bars = 50 μm), with quantification below (ctrl: n = 5, ctrl + GW501516: n = 5, sgGot2: n = 3, sgGot2 + GW501516: n = 4). Data are presented as mean ± SEM. ns = not significant. **, P < 0.01 by one-way ANOVA. D, IHC staining for PTGS2/COX2 in control or sgGot2 PDAC treated with vehicle or GW501516 (representative of n = 3–5 per cohort). Scale bars = 50 μm. E, Viable cell measurements in control or sgGot2 PDAC cells stably transduced with empty vector or VP16–PPARδ. Data are presented as mean ± SEM. F and G, PDAC tumor weight at the experimental endpoint in the indicated 688M (F) and FC1245 (G) lines. 688M: Ctrl: n = 5, sgGot2 a: n = 4, ctrl VP16–PPARδ: n = 4, sgGot2 a VP16–PPARδ: n = 4, endpoint = day 27. FC1245: Ctrl: n = 5, sgGot2 a: n = 5, ctrl VP16–PPARδ: n = 5, sgGot2 a VP16–PPARδ: n = 4, endpoint = day 18. Ctrl and sgGot2 FC1245 arms here are also depicted in Fig. 1E. ns = not significant. *, P < 0.05; **, P < 0.01; ***, P < 0.001; ****, P < 0.0001 by one-way ANOVA. H, qPCR for PPARδ-regulated genes in the indicated FC1245 stable cell lines, normalized to 36b4. Data are presented as mean ± SEM from biological triplicates. *, P < 0.05; **, P < 0.01; ****, P < 0.0001 by one-way ANOVA. I, PDAC tumor weight at experimental endpoint (day 18) in ctrl (n = 4) and shPpard (n = 5 per hairpin) FC1245 tumors. **, P < 0.01 by one-way ANOVA. J, Quantification of CD3 IHC on the tumors from I (scale bars = 50 μm). ns = not significant. *, P < 0.05 by one-way ANOVA. K, Heat map depicting differentially expressed (DE) genes in control and sgGot2 FC1245 PDAC cells, untreated or treated with 500 nmol/L GW501516 for 24 hours (n = 3 per group), identified by RNA-seq using cutoff criteria Padj < 0.01 and logFC < −1 or > 1 in at least one comparison. L, Venn diagram showing RNA-seq results by the criteria in K, with sample gene identities at the overlap listed. Overlapping gene frequency: ***, P < 0.001 by permutation test. M, Molecular Signatures Database (MSigDB) pathway analysis showing the top 10 enriched pathways of genes at the overlap in L.
Figure 5.
PPARδ activation restores tumor growth and T-cell exclusion in the absence of GOT2. A, Viable cell measurements in control or sgGot2 PDAC cells treated with vehicle or 100 nmol/L GW501516. RLU, relative light unit. B, PDAC tumor weight at the experimental endpoint, 30 days after orthotopic transplantation of the control or sgGot2 cells, with daily i.p. injection of vehicle or 4 mg/kg GW501516. Ctrl: n = 5 per cohort, sgGot2: n = 4 per cohort. Data are presented as mean ± SEM. ns = not significant. *, P < 0.05; **, P < 0.01 by one-way ANOVA. C, IHC staining of control and sgGot2 688M tumors treated with vehicle or GW501516 as in B for the T-cell marker CD3. Representative images are shown above (scale bars = 50 μm), with quantification below (ctrl: n = 5, ctrl + GW501516: n = 5, sgGot2: n = 3, sgGot2 + GW501516: n = 4). Data are presented as mean ± SEM. ns = not significant. **, P < 0.01 by one-way ANOVA. D, IHC staining for PTGS2/COX2 in control or sgGot2 PDAC treated with vehicle or GW501516 (representative of n = 3–5 per cohort). Scale bars = 50 μm. E, Viable cell measurements in control or sgGot2 PDAC cells stably transduced with empty vector or VP16–PPARδ. Data are presented as mean ± SEM. F and G, PDAC tumor weight at the experimental endpoint in the indicated 688M (F) and FC1245 (G) lines. 688M: Ctrl: n = 5, sgGot2 a: n = 4, ctrl VP16–PPARδ: n = 4, sgGot2 a VP16–PPARδ: n = 4, endpoint = day 27. FC1245: Ctrl: n = 5, sgGot2 a: n = 5, ctrl VP16–PPARδ: n = 5, sgGot2 a VP16–PPARδ: n = 4, endpoint = day 18. Ctrl and sgGot2 FC1245 arms here are also depicted in Fig. 1E. ns = not significant. *, P < 0.05; **, P < 0.01; ***, P < 0.001; ****, P < 0.0001 by one-way ANOVA. H, qPCR for PPARδ-regulated genes in the indicated FC1245 stable cell lines, normalized to 36b4. Data are presented as mean ± SEM from biological triplicates. *, P < 0.05; **, P < 0.01; ****, P < 0.0001 by one-way ANOVA. I, PDAC tumor weight at experimental endpoint (day 18) in ctrl (n = 4) and shPpard (n = 5 per hairpin) FC1245 tumors. **, P < 0.01 by one-way ANOVA. J, Quantification of CD3 IHC on the tumors from I (scale bars = 50 μm). ns = not significant. *, P < 0.05 by one-way ANOVA. K, Heat map depicting differentially expressed (DE) genes in control and sgGot2 FC1245 PDAC cells, untreated or treated with 500 nmol/L GW501516 for 24 hours (n = 3 per group), identified by RNA-seq using cutoff criteria Padj < 0.01 and logFC < −1 or > 1 in at least one comparison. L, Venn diagram showing RNA-seq results by the criteria in K, with sample gene identities at the overlap listed. Overlapping gene frequency: ***, P < 0.001 by permutation test. M, Molecular Signatures Database (MSigDB) pathway analysis showing the top 10 enriched pathways of genes at the overlap in L.

Comment in

References

    1. van Karnebeek CDM, Ramos RJ, Wen XY, Tarailo-Graovac M, Gleeson JG, Skrypnyk C, et al. . Bi-allelic GOT2 mutations cause a treatable malate-aspartate shuttle-related encephalopathy. Am J Hum Genet 2019;105:534–48. - PMC - PubMed
    1. Yang H, Zhou L, Shi Q, Zhao Y, Lin H, Zhang M, et al. . SIRT3-dependent GOT2 acetylation status affects the malate-aspartate NADH shuttle activity and pancreatic tumor growth. EMBO J 2015;34:1110–25. - PMC - PubMed
    1. Yang S, Hwang S, Kim M, Seo SB, Lee JH, Jeong SM. Mitochondrial glutamine metabolism via GOT2 supports pancreatic cancer growth through senescence inhibition. Cell Death Dis 2018;9:55. - PMC - PubMed
    1. Hollinshead KER, Parker SJ, Eapen VV, Encarnacion-Rosado J, Sohn A, Oncu T, et al. . Respiratory supercomplexes promote mitochondrial efficiency and growth in severely hypoxic pancreatic cancer. Cell Rep 2020;33:108231. - PMC - PubMed
    1. Sorrentino D, Stump D, Potter BJ, Robinson RB, White R, Kiang CL, et al. . Oleate uptake by cardiac myocytes is carrier mediated and involves a 40-kD plasma membrane fatty acid binding protein similar to that in liver, adipose tissue, and gut. J Clin Invest 1988;82:928–35. - PMC - PubMed

Publication types