Randomized Controlled Trial
. 2022 Sep 1;45(9):2064-2075.
doi: 10.2337/dc21-2049.

Comparison of Tofogliflozin and Glimepiride Effects on Nonalcoholic Fatty Liver Disease in Participants With Type 2 Diabetes: A Randomized, 48-Week, Open-Label, Active-Controlled Trial

Affiliations
Randomized Controlled Trial

Comparison of Tofogliflozin and Glimepiride Effects on Nonalcoholic Fatty Liver Disease in Participants With Type 2 Diabetes: A Randomized, 48-Week, Open-Label, Active-Controlled Trial

Yumie Takeshita et al. Diabetes Care. .

Abstract

Objective: Nonalcoholic fatty liver disease (NAFLD) is a liver phenotype of type 2 diabetes and obesity. Currently, the efficacy of sodium-glucose cotransporter 2 (SGLT2) inhibitors and sulfonylureas in liver pathology and hepatic gene expression profiles for type 2 diabetes with NAFLD are unknown.

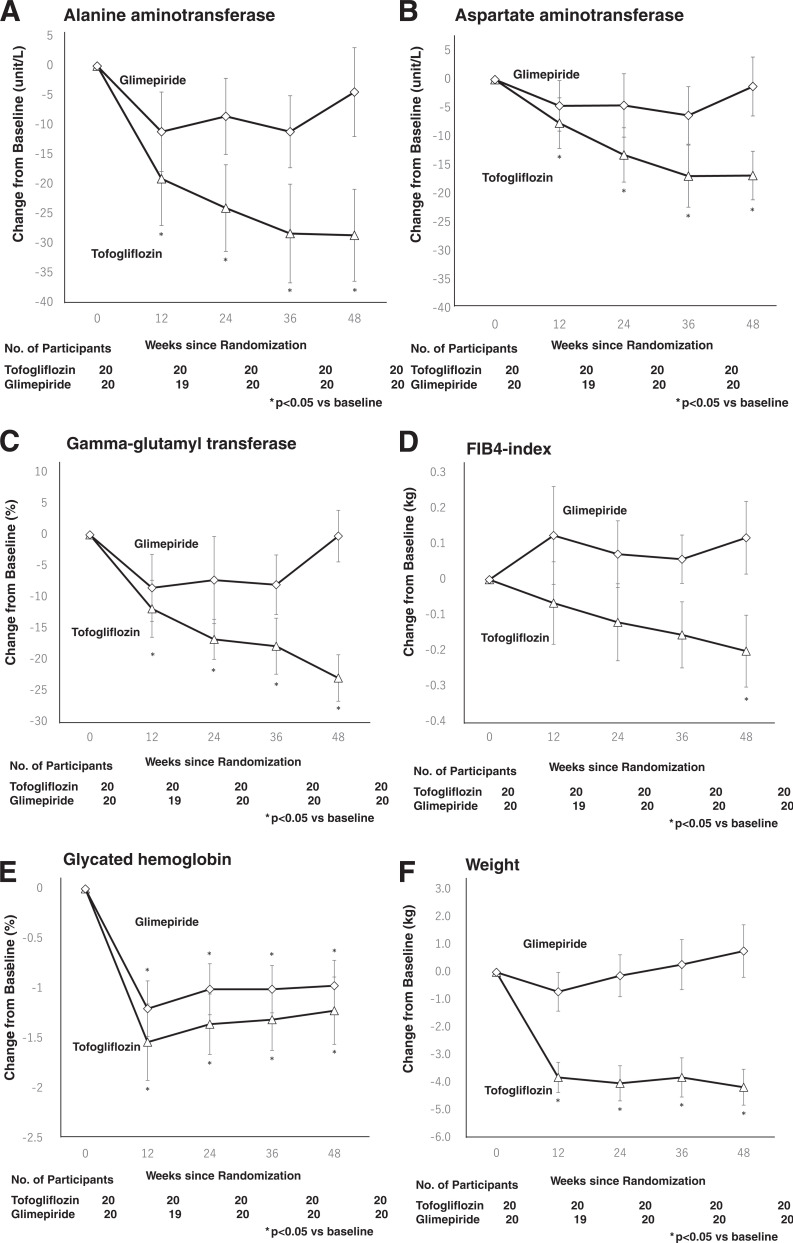
Research design and methods: We conducted a 48 week, randomized, open-label, parallel-group trial involving participants with biopsy-confirmed NAFLD. A total of 40 participants were randomly assigned to receive once daily 20 mg tofogliflozin or 0.5 mg glimepiride. The primary outcome was the percentage of participants with at least an improvement in all individual scores for histological categories of steatosis, hepatocellular ballooning, lobular inflammation, and fibrosis by at least 1 point. The secondary end points were the changes in liver enzymes, metabolic markers, and hepatic gene expression profiles.

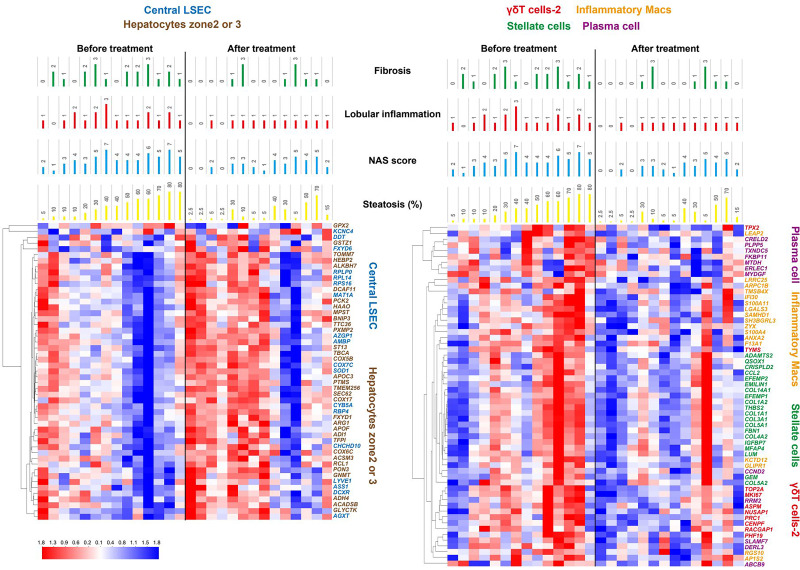
Results: Fibrosis scores improved in the tofogliflozin group (60%, P = 0.001), whereas the change from baseline did not differ significantly between the groups (P = 0.172). The histological variables of steatosis (65%, P = 0.001), hepatocellular ballooning (55%, P = 0.002), and lobular inflammation (50%, P = 0.003) were improved in the tofogliflozin group, whereas only hepatocellular ballooning was improved in the glimepiride group (25%, P = 0.025). Hepatic gene expression profiling revealed histology-associated signatures in energy metabolism, inflammation, and fibrosis that were reversed with tofogliflozin.

Conclusions: Tofogliflozin and, to a lesser degree, glimepiride led to liver histological and metabolic improvement in participants with type 2 diabetes and NAFLD, with no significant difference between the agents. The hepatic expression of the genes involved in energy metabolism, inflammation, and fibrosis was well correlated with liver histological changes and rescued by tofogliflozin. We need further confirmation through long-term larger-scale clinical trials of SGLT2 inhibitors.

Trial registration: ClinicalTrials.gov NCT02649465.


Figures

Figure 1
Figure 1
Changes from baseline in liver-related parameters, HbA1c, and weight, according to the study group. Mean values are shown for changes from baseline (the value at follow-up minus the baseline value) for ALT levels (A), AST levels (B), γ-glutamyl transferase (C), FIB-4 index (D), HbA1c (E), and weight (F) among the 20 subjects in the tofogliflozin group and the 20 subjects in the glimepiride group.
Figure 2
Figure 2
Heat maps of gene set enrichment analyses using gene sets of resident cells in the liver defined by single-cell RNA-seq analyses and corresponding liver histological scores before and after the tofogliflozin treatment. The heat maps show one-way hierarchical clustering of 51 representative genes involved in central LSECs and zone 2 and 3 hepatocytes (left) and 59 genes involved in γδT cells, inflammatory macrophages (macs), stellate cells, and plasma cells (right). Histological scores of fibrosis, lobular inflammation, NAS, and steatosis (%) are shown in individual patients before and after treatment, respectively. Gene expression patterns were well correlated with histological changes. The 51 genes involved in LSECs and zone 2 and 3 hepatocytes were coordinately downregulated in the liver with severe steatosis before treatment (left side of left panel). Tofogliflozin upregulated these genes expression (right side of left panel). The 59 genes, representative of γδT cells, inflammatory macrophages, stellate cells, and plasma cells, showed a similar gene expression pattern and clustered in each cell component. These genes were coordinately upregulated in the liver with severe steatosis before treatment (left side of right panel). Tofogliflozin downregulated these genes expression (right side of left panel).

References

    1. Bril F, Cusi K. Management of nonalcoholic fatty liver disease in patients with type 2 diabetes: a call to action. Diabetes Care 2017;40:419–430 - PubMed
    1. Hamaguchi E, Takamura T, Sakurai M, et al. . Histological course of nonalcoholic fatty liver disease in Japanese patients: tight glycemic control, rather than weight reduction, ameliorates liver fibrosis. Diabetes Care 2010;33:284–286 - PMC - PubMed
    1. Angulo P, Kleiner DE, Dam-Larsen S, et al. . Liver fibrosis, but no other histologic features, is associated with long-term outcomes of patients with nonalcoholic fatty liver disease. Gastroenterology 2015;149:389–97.e10 - PMC - PubMed
    1. Estes C, Razavi H, Loomba R, Younossi Z, Sanyal AJ. Modeling the epidemic of nonalcoholic fatty liver disease demonstrates an exponential increase in burden of disease. Hepatology 2018;67:123–133 - PMC - PubMed
    1. Dulai PS, Singh S, Patel J, et al. . Increased risk of mortality by fibrosis stage in nonalcoholic fatty liver disease: systematic review and meta-analysis. Hepatology 2017;65:1557–1565 - PMC - PubMed

Publication types

MeSH terms

Substances

Associated data