. 2022 Jul 8;11(7):24.
doi: 10.1167/tvst.11.7.24.

3D Reconstruction of a Unitary Posterior Eye by Converging Optically Corrected Optical Coherence and Magnetic Resonance Tomography Images via 3D CAD

Affiliations

3D Reconstruction of a Unitary Posterior Eye by Converging Optically Corrected Optical Coherence and Magnetic Resonance Tomography Images via 3D CAD

Hyung Bin Hwang et al. Transl Vis Sci Technol. .

Abstract

Purpose: In acquiring images of the posterior eye, magnetic resonance imaging (MRI) provides low spatial resolution of the overall shape of the eye while optical coherence tomography (OCT) offers high spatial resolution of the limited range. Through the merger of the two devices, we attempted to acquire detailed anatomy of the posterior eye.

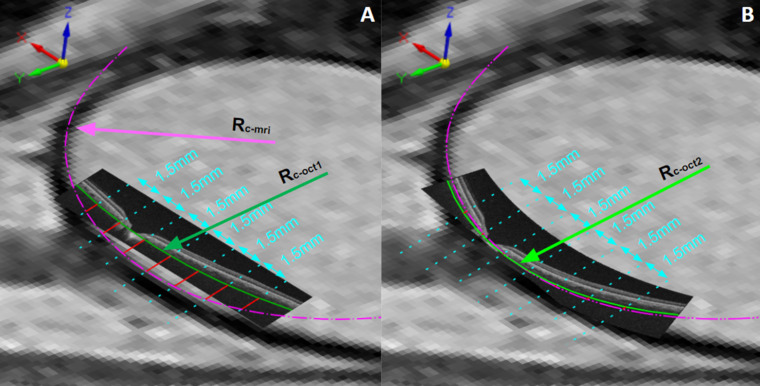
Methods: Optical and display distortions in OCT images were corrected using the Listing reduced eye model. The 3.0T orbital MRI images were placed on the three-dimensional coordinate system of the computer-aided design (CAD) program. Employing anterior scleral canal opening, visual axis, and scleral curvature as references, original and corrected OCT images were ported into the CAD application. The radii of curvature of the choroid-scleral interfaces (Rc values) of all original and corrected OCT images were compared to the MRI images.

Results: Sixty-five eyes of 33 participants (45.58 ± 19.82 years) with a mean Rc of 12.94 ± 1.24 mm on axial MRI and 13.66 ± 2.81 mm on sagittal MRI were included. The uncorrected horizontal OCT (30.51 ± 9.34 mm) and the uncorrected vertical OCT (34.35 ± 18.09 mm) lengths differed significantly from the MRI Rc values (both P < 0.001). However, the mean Rc values of the corrected horizontal (12.50 ± 1.21 mm) and vertical (13.05 ± 1.98 mm) images did not differ significantly from the Rc values of the corresponding MRI planes (P = 0.065 and P = 0.198, respectively).

Conclusions: Features identifiable only on OCT and features only on MRI were successfully integrated into a unitary posterior eye.

Translational relevance: Our CAD-based converging method may establish the collective anatomy of the posterior eye and the neural canal, beyond the range of the OCT.


Conflict of interest statement

Disclosure: H.B. Hwang, None; J.S. Yeon, None; G.S. Moon, None; H.N. Jung, None; J.Y. Kim, None; S.H. Jeon, None; J.M. Yoon, None; H.W. Kim, None; Y.C. Kim, None

Figures

Figure 1.
Figure 1.
Merged OCT and MRI axial images. The Bruch's membrane (BM, pink line), choroid (Cho, orange area), sclera (Sc, purple area), and optic nerve parenchyme (ON, red area) are presented. BMO (yellow dots), ASCO (green dots), PSCO (blue dots), and ASAS (purple dots) are also presented.
Figure 2.
Figure 2.
Reconstructed 3D model and sectional view. Features identifiable on OCT—the BMO, peripapillary sclera, and peripapillary atrophy—and features unidentifiable on OCT but identifiable on MRI—the mid-peripheral sclera, the scleral flange, the optic nerve sheath, and the optic nerve parenchyma—were integrated into a unitary posterior eye model. Inner sclera boundary (sky blue solid line), lamina cribrosa (gray), outer sclera boundary and dura outer (orange solid line), dura inner (blue solid line), and optic nerve parenchyma (green) are displayed.
Figure 3.
Figure 3.
Concept of 3D reconstruction of a posterior eye by converging optically corrected OCT and MRI images. (A) MRI axial and sagittal scans were placed in the 3D space of the CAD program. (B) The linear line connecting the corneal apex (red dot) of the eye, the posterior pole (light blue point) of the lens, and the centroid of the eye (red dot) was assumed to be the visual axis. The AXL was measured from the anterior pole of the eye, back pole of the lens, and centroid of the eyeball. (C) In the frames showing the maximum transverse dimensions of the scleral canal and the surrounding optic nerve sheath, OCT image arrangement reference lines were drawn from the nodal point of the eye to the center of the ASCO of the neural canal (orange line). (D) The three points were considered when reviewing the consistency of MRI/OCT image overlap: continuity of the scleral boundary between MRI and OCT (orange circle), ASCO overlap between MRI and OCT (green dot), and whether the MRI visual axis passed through the fovea (pink circle).
Figure 4.
Figure 4.
(A) Discrepancy between the scan paths and the presentation of OCTs. OCT acquires images using a fan-beam light, but the images are processed and presented in rectangular format. (B) As all light scans are assumed to share a common pivot at the nodal point of a reduced model eye, all points on a scanned retina were assumed to be equidistant to the nodal point (df). Also, the equidistant scan beam (df) can organize an equilateral triangle with a lower base (d1) as the scan widths of the OCT. This triangle can also be organized into a right-angled triangle, which can be employed to a trigonometrical function. From these assumptions, the angle of the equilateral triangle (Ɵbend) can be calculated. The angle (Ɵbend) is used as the standard for bending the rectangular display of the OCT (uncorrected OCT) to a corrected OCT image that resembles the actual eye shape.
Figure 5.
Figure 5.
The radii of curvature of the scleral boundary in the uncorrected (Rc-OCT1), corrected OCT (Rc-OCT2), and the MRI (Rc-MRI) images. The linear distances between the MRI and OCT scleral boundaries were measured at seven equidistant points based on the differences between the MRI curvature and those of uncorrected and corrected OCT.
Figure 6.
Figure 6.
Comparison of the AXL measured with the optical biometry and with the reconstructed MRI images using the CAD caliper.
Figure 7.
Figure 7.
Comparison of the scleral radii of curvature of MRI, uncorrected OCT, and corrected OCT.
Figure 8.
Figure 8.
The scleral boundary differences between MRI and OCT in the axial and sagittal planes. The corrected and the uncorrected measures all had statistical difference, as shown in Table 2. C, corrected OCT versus MRI; C_avg, average difference of seven points of corrected OCT versus MRI; U, uncorrected OCT versus MRI; U_avg, average difference of seven points of uncorrected OCT versus MRI.

References

    1. Huang D, Swanson EA, Lin CP, et al. .. Optical coherence tomography. Science. 1991; 254: 1178–1181. - PMC - PubMed
    1. Podoleanu A, Charalambous I, Plesea L, Dogariu A, Rosen R.. Correction of distortions in optical coherence tomography imaging of the eye. Phys Med Biol. 2004; 49: 1277–1294. - PubMed
    1. Chen M, Gee JC, Prince JL, Aguirre GK.. 2D modeling and correction of fan-beam scan geometry in OCT. Comput Pathol Ophthalmic Med Image Anal (2018). 2018; 11039: 328–335. - PMC - PubMed
    1. Berrio E, Tabernero J, Artal P.. Optical aberrations and alignment of the eye with age. J Vis. 2010; 10(14): 34. - PubMed
    1. Snead MP, Hardman Lea S, Rubinstein MP, Reynolds K, Haworth SM. Determination of the nodal point position in the pseudophakic eye. Ophthalmic Physiol Opt. 1991; 11: 105–108. - PubMed

Publication types