

Quantifying Deviations of Brain Structure and Function in Major Depressive Disorder Across Neuroimaging Modalities
- PMID: 35895072
- PMCID: PMC9330277
- DOI: 10.1001/jamapsychiatry.2022.1780
Quantifying Deviations of Brain Structure and Function in Major Depressive Disorder Across Neuroimaging Modalities
Erratum in
-
Errors in Author Affiliations.JAMA Psychiatry. 2022 Sep 1;79(9):937. doi: 10.1001/jamapsychiatry.2022.2900. JAMA Psychiatry. 2022. PMID: 36069868 Free PMC article. No abstract available.
Abstract
Importance: Identifying neurobiological differences between patients with major depressive disorder (MDD) and healthy individuals has been a mainstay of clinical neuroscience for decades. However, recent meta-analyses have raised concerns regarding the replicability and clinical relevance of brain alterations in depression.
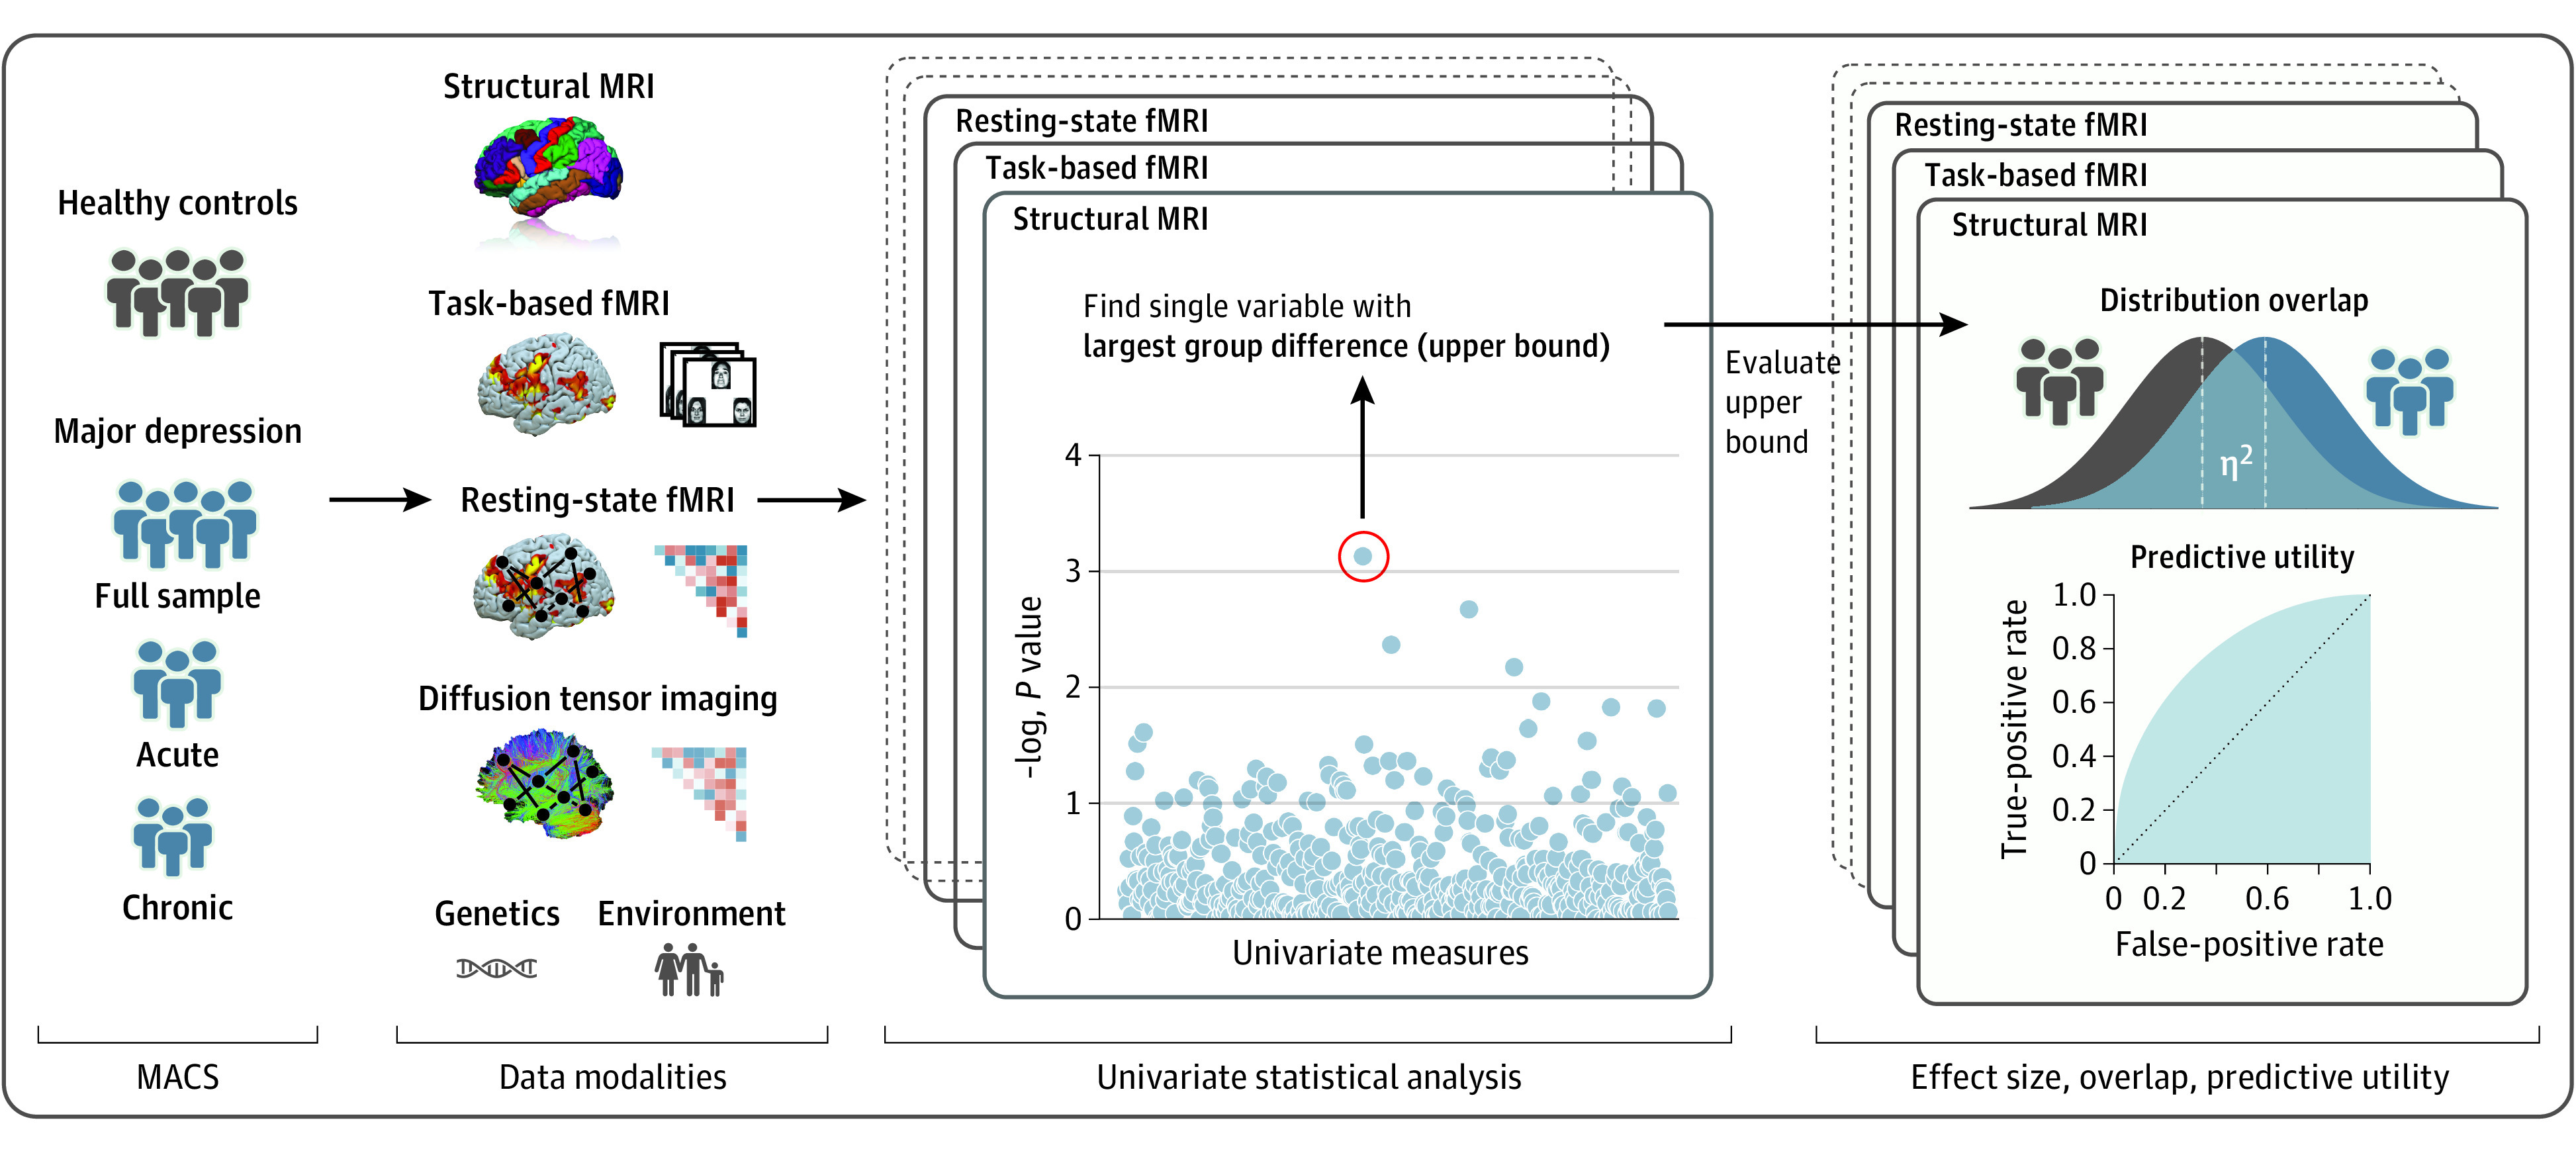
Objective: To quantify the upper bounds of univariate effect sizes, estimated predictive utility, and distributional dissimilarity of healthy individuals and those with depression across structural magnetic resonance imaging (MRI), diffusion-tensor imaging, and functional task-based as well as resting-state MRI, and to compare results with an MDD polygenic risk score (PRS) and environmental variables.
Design, setting, and participants: This was a cross-sectional, case-control clinical neuroimaging study. Data were part of the Marburg-Münster Affective Disorders Cohort Study. Patients with depression and healthy controls were recruited from primary care and the general population in Münster and Marburg, Germany. Study recruitment was performed from September 11, 2014, to September 26, 2018. The sample comprised patients with acute and chronic MDD as well as healthy controls in the age range of 18 to 65 years. Data were analyzed from October 29, 2020, to April 7, 2022.
Main outcomes and measures: Primary analyses included univariate partial effect size (η2), classification accuracy, and distributional overlapping coefficient for healthy individuals and those with depression across neuroimaging modalities, controlling for age, sex, and additional modality-specific confounding variables. Secondary analyses included patient subgroups for acute or chronic depressive status.
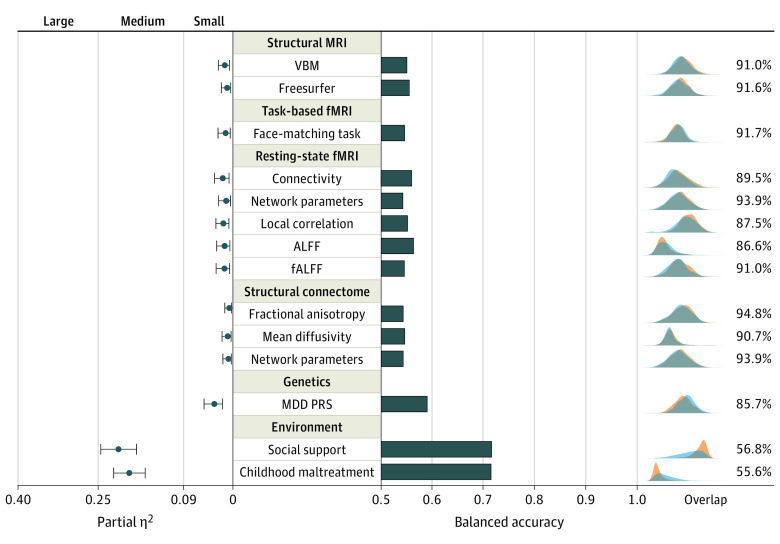
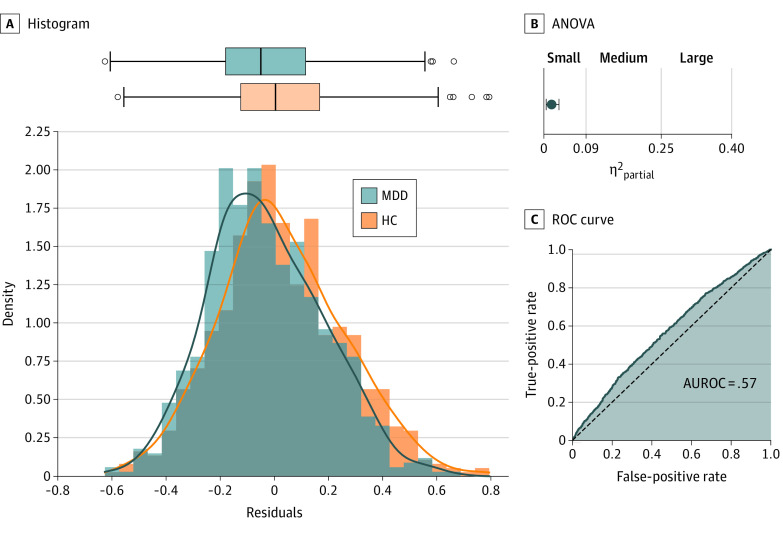
Results: A total of 1809 individuals (861 patients [47.6%] and 948 controls [52.4%]) were included in the analysis (mean [SD] age, 35.6 [13.2] years; 1165 female patients [64.4%]). The upper bound of the effect sizes of the single univariate measures displaying the largest group difference ranged from partial η2 of 0.004 to 0.017, and distributions overlapped between 87% and 95%, with classification accuracies ranging between 54% and 56% across neuroimaging modalities. This pattern remained virtually unchanged when considering either only patients with acute or chronic depression. Differences were comparable with those found for PRS but substantially smaller than for environmental variables.
Conclusions and relevance: Results of this case-control study suggest that even for maximum univariate biological differences, deviations between patients with MDD and healthy controls were remarkably small, single-participant prediction was not possible, and similarity between study groups dominated. Biological psychiatry should facilitate meaningful outcome measures or predictive approaches to increase the potential for a personalization of the clinical practice.
Conflict of interest statement
Figures
Comment in
-
The Search for Clinically Useful Neuroimaging Markers of Depression-A Worthwhile Pursuit or a Futile Quest?JAMA Psychiatry. 2022 Sep 1;79(9):845-846. doi: 10.1001/jamapsychiatry.2022.1606. JAMA Psychiatry. 2022. PMID: 35895069 No abstract available.
References
-
- World Health Organization . Depression and other common mental disorders. Accessed November 11, 2021. https://apps.who.int/iris/bitstream/handle/10665/254610/WHO-MSD-MER-2017...
-
- Shorter E. A History of Psychiatry: From the Era of the Asylum to the Age of Prozac by Edward Shorter. 2nd ed. Wiley; 1998.
Publication types
MeSH terms
Substances
LinkOut - more resources
Full Text Sources
Miscellaneous
