. 2022 Nov;144(5):843-859.
doi: 10.1007/s00401-022-02469-6. Epub 2022 Jul 27.

Galectin-3 is elevated in CSF and is associated with Aβ deposits and tau aggregates in brain tissue in Alzheimer's disease

Affiliations

Galectin-3 is elevated in CSF and is associated with Aβ deposits and tau aggregates in brain tissue in Alzheimer's disease

Antonio Boza-Serrano et al. Acta Neuropathol. 2022 Nov.

Abstract

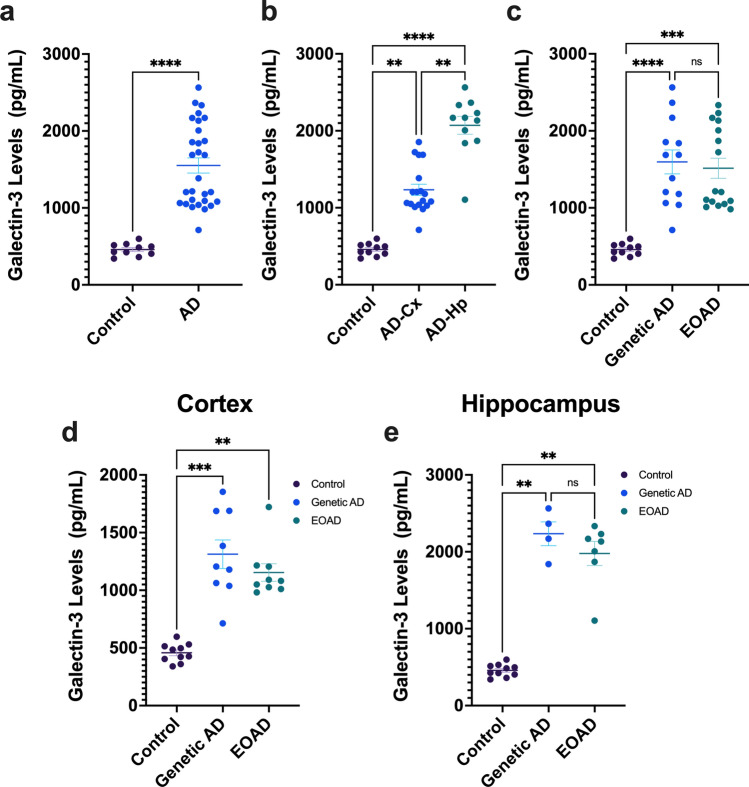
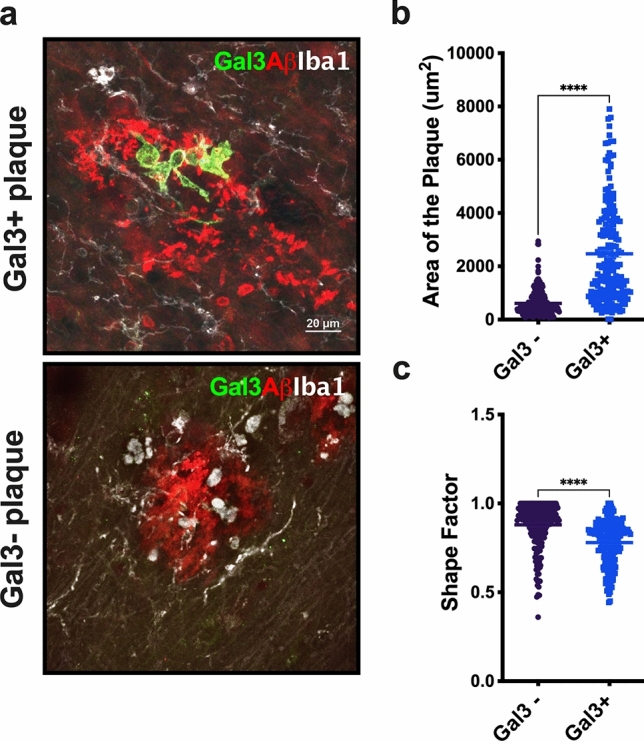
Galectin-3 (Gal-3) is a beta-galactosidase binding protein involved in microglial activation in the central nervous system (CNS). We previously demonstrated the crucial deleterious role of Gal-3 in microglial activation in Alzheimer's disease (AD). Under AD conditions, Gal-3 is primarily expressed by microglial cells clustered around Aβ plaques in both human and mouse brain, and knocking out Gal-3 reduces AD pathology in AD-model mice. To further unravel the importance of Gal-3-associated inflammation in AD, we aimed to investigate the Gal-3 inflammatory response in the AD continuum. First, we measured Gal-3 levels in neocortical and hippocampal tissue from early-onset AD patients, including genetic and sporadic cases. We found that Gal-3 levels were significantly higher in both cortex and hippocampus in AD subjects. Immunohistochemistry revealed that Gal-3+ microglial cells were associated with amyloid plaques of a larger size and more irregular shape and with neurons containing tau-inclusions. We then analyzed the levels of Gal-3 in cerebrospinal fluid (CSF) from AD patients (n = 119) compared to control individuals (n = 36). CSF Gal-3 levels were elevated in AD patients compared to controls and more strongly correlated with tau (p-Tau181 and t-tau) and synaptic markers (GAP-43 and neurogranin) than with amyloid-β. Lastly, principal component analysis (PCA) of AD biomarkers revealed that CSF Gal-3 clustered and associated with other CSF neuroinflammatory markers, including sTREM-2, GFAP, and YKL-40. This neuroinflammatory component was more highly expressed in the CSF from amyloid-β positive (A+), CSF p-Tau181 positive (T+), and biomarker neurodegeneration positive/negative (N+/-) (A + T + N+/-) groups compared to the A + T-N- group. Overall, Gal-3 stands out as a key pathological biomarker of AD pathology that is measurable in CSF and, therefore, a potential target for disease-modifying therapies involving the neuroinflammatory response.


Conflict of interest statement

The authors do not declare any conflict of interest.

Figures

Fig. 1
Fig. 1
Gal-3 levels are increased in the cortex and the hippocampus in AD patients. First, Gal-3 levels were compared between AD samples versus control samples (a). Gal-3 levels measured by ELISA are increased in cortical and hippocampal tissue from AD patients compared to controls (b). c AD patients were divided into sporadic early-onset AD (EOAD) and genetic AD (PSEN1 mutation) cases. Then, Gal-3 levels were compared between AD groups and controls. d, e Cortical and hippocampal Gal-3 levels were compared between EOAD and genetic AD groups. Differences were found compared to control samples but not between EOAD and genetic AD groups themselves. Non-parametric t-test a and Kruskal–Wallis multiple comparisons (b-e) were performed. Data are shown as mean ± SEM. **p < 0.01; ***p < 0.001. ****p < 0.0001
Fig. 2
Fig. 2
Gal-3-positive microglial cells are associated with larger and more irregularly shaped Aβ plaques. a Gal-3-positive microglial cells were associated with larger and more irregularly shaped Aβ plaques (Gal3+ plaques) compared to Gal-3-negative Aβ plaques (Gal3− plaques). b, c Gal3+ plaques were larger and more irregularly shaped than Gal-3− plaques. Aβ (red), Galectin-3 (green), Iba1 (white). Data are shown as mean ± SEM. Non-parametric t-tests were performed. ****p < 0.0001. (n = 3 (HC), n = 8 (AD). Gal-3-negative plaques, n = 212; Gal-3-positive plaques, n = 197)
Fig. 3
Fig. 3
Reactive microglial cells expressing Gal-3 presented Aβ inclusions in human tissue samples. af Gal-3-positive microglial cell associated with Aβ plaques. g 3D reconstruction of microglial cells with multiple Aβ inclusions inside. Gal3 (green), Aβ (red), Iba1 (white), DAPI (blue). White arrows are pointing to Aβ inclusions (in red) (n = 3 (HC), n = 8 (AD)
Fig. 4
Fig. 4
Reactive microglial cells expressing Gal-3 interact with p-Tau in senile plaques from human tissue samples. af Gal-3-positive microglial cell associated with p-Tau plaques. g 3D reconstruction of microglial cell with multiple p-Tau interactions. Gal3 (green), p-Tau (red), Iba1 (white) and DAPI (blue). White arrows are pointing p-Tau Gal-3 interactions (in orange). n = 3 (HC), n = 8 (AD)
Fig. 5
Fig. 5
CSF Gal-3 levels are increased in AD patients and correlate with other CSF neuroinflammatory biomarkers. a CSF Gal-3 levels were measured by ELISA in control subjects and AD patients. Gal-3 levels were significantly elevated in AD patients compared to controls (*P = 0.030) after adjustment on age, sex and ApoE4 carriership. b CSF sTREM-2 levels were measured in our cohort. No difference was found between the AD and control groups in our analysis adjusted for age, sex and ApoE4 carriership (P = 0.217). c, d Analysis of ROC curves revealed moderate performance of CSF Gal-3 and sTREM-2 levels for differentiating AD patients from neurological controls (c Gal-3 AUROC = 0.80 [95% CI = 0.72–0.88], sTREM-2 AUROC = 0.78 [95% CI = 0.69–0.88]; d Gal-3 AUPRC = 0.92, sTREM-2 AUPRC = 0.91). For comparison, CSF markers p-tau and t-tau demonstrated high discriminating performance between AD and controls (c: p-tau AUROC = 0.95 [95% CI = 0.91–1.00], t-tau AUROC = 0.92 [95% CI = 0.86–0.98]; 5d: p-tau AUPRC = 1.00, t-tau AUPRC = 0.99). e, f, g The relationships between CSF Gal-3 and other CSF neuroinflammatory biomarkers—sTREM-2, GFAP and YKL-40—were studied using Spearman’s rank correlation in the whole cohort as well as in AD and neurological control (NC) subgroups
Fig. 6
Fig. 6
CSF Gal-3 levels correlate with CSF tau and synaptic markers. ao Scatter plots depicting the association between CSF Gal-3 levels with other CSF AD and synaptic markers in the whole cohort and in the sub-groups (neurological controls [NC] n = 36 and AD n = 119). ac CSF Aβ ratio weakly correlated with CSF Gal-3 in the whole cohort and sub-groups. di CSF Gal-3 significantly correlated with CSF p-tau181 and t-tau in the whole cohort and some sub-groups. jo CSF Gal-3 levels correlated with CSF synaptic markers neurogranin jl and GAP-43 mo in the whole cohort and in the AD patient sub-group. Associations were assessed using Spearman’s rank correlation. Solid line indicates regression line, and dotted lines border the 95% confidence interval
Fig. 7
Fig. 7
CSF Gal-3 clusters with a neuroinflammatory component in principal component analysis. a, b Principal component analysis (PCA) in the whole cohort revealed clustering of the CSF biomarkers in two principal components (a loading values of each CSF biomarker, eigenvalues, and variance explained for each component identified; b: scree-plot in Varimax rotation). Component 1 is associated with CSF core AD biomarkers (Aß ratio, p-Tau181, and t-tau) and CSF synaptic markers (neurogranin, GAP-43). Component 2 included the CSF neuroinflammation markers (Gal-3, sTREM-2, GFAP, and YKL-40). Component 1 and Component 2 accounted for 57% and 14% of the variance. ce Identified components were compared between groups using one-way ANCOVA-adjusted on age and sex followed by post hoc Least square test, adjusted with Bonferroni for multiple comparisons. c Core AD Component 1 was significantly higher in AD patients than in all other groups (****P < 0.0001 versus all other groups). d Neuroinflammation Component 2 did not differ between the groups. e Focusing on the patients on the AD continuum, neuroinflammatory Component 2 was significantly higher in patients with a [A + T + N +] CSF profile compared to patients with an [A + T−N−] profile (P = 0.002)

References

    1. Alosco ML, Tripodis Y, Fritts NG, Heslegrave A, Baugh CM, Conneely S, et al. Cerebrospinal fluid tau, Abeta, and sTREM2 in former national football league players: modeling the relationship between repetitive head impacts, microglial activation, and neurodegeneration. Alzheimer’s Dement. 2018;14:1159–1170. doi: 10.1016/j.jalz.2018.05.004. - DOI - PMC - PubMed
    1. Antonell A, Mansilla A, Rami L, Llado A, Iranzo A, Olives J, et al. Cerebrospinal fluid level of YKL-40 protein in preclinical and prodromal Alzheimer's disease. J Alzheimer’s Dis. 2014;42:901–908. doi: 10.3233/JAD-140624. - DOI - PubMed
    1. Ashraf GM, Baeesa SS. Investigation of Gal-3 expression pattern in serum and cerebrospinal fluid of patients suffering from neurodegenerative disorders. Front Neurosci. 2018;12:430. doi: 10.3389/fnins.2018.00430. - DOI - PMC - PubMed
    1. Ashton NJ, Scholl M, Heurling K, Gkanatsiou E, Portelius E, Hoglund K, et al. Update on biomarkers for amyloid pathology in Alzheimer's disease. Biomark Med. 2018;12:799–812. doi: 10.2217/bmm-2017-0433. - DOI - PubMed
    1. Bellaver B, Ferrari-Souza JP, Uglione da Ros L, Carter SF, Rodriguez-Vieitez E, Nordberg A, et al. Astrocyte biomarkers in Alzheimer disease: a systematic review and meta-analysis. Neurology. 2021 doi: 10.1212/WNL.0000000000012109. - DOI - PubMed

Publication types