. 2022 Aug 2;119(31):e2123241119.
doi: 10.1073/pnas.2123241119. Epub 2022 Jul 27.

A quantification method of somatic mutations in normal tissues and their accumulation in pediatric patients with chemotherapy

Affiliations

A quantification method of somatic mutations in normal tissues and their accumulation in pediatric patients with chemotherapy

Sho Ueda et al. Proc Natl Acad Sci U S A. .

Abstract

Somatic mutations are accumulated in normal human tissues with aging and exposure to carcinogens. If we can accurately count any passenger mutations in any single DNA molecule, since their quantity is much larger than driver mutations, we can sensitively detect mutation accumulation in polyclonal normal tissues. Duplex sequencing, which tags both DNA strands in one DNA molecule, enables accurate count of such mutations, but requires a very large number of sequencing reads for each single sample of human-genome size. Here, we reduced the genome size to 1/90 using the BamHI restriction enzyme and established a cost-effective pipeline. The enzymatically cleaved and optimal sequencing (EcoSeq) method was able to count somatic mutations in a single DNA molecule with a sensitivity of as low as 3 × 10⁻⁸ per base pair (bp), as assessed by measuring artificially prepared mutations. Taking advantages of EcoSeq, we analyzed normal peripheral blood cells of pediatric sarcoma patients who received chemotherapy (n = 10) and those who did not (n = 10). The former had a mutation frequency of 31.2 ± 13.4 × 10⁻⁸ per base pair while the latter had 9.0 ± 4.5 × 10⁻⁸ per base pair (P < 0.001). The increase in mutation frequency was confirmed by analysis of the same patients before and after chemotherapy, and increased mutation frequencies persisted 46 to 64 mo after chemotherapy, indicating that the mutation accumulation constitutes a risk of secondary leukemia. EcoSeq has the potential to reveal accumulation of somatic mutations and exposure to environmental factors in any DNA samples and will contribute to cancer risk estimation.

Keywords: chemotherapy; duplex sequencing; next-generation sequencing; normal tissue; somatic mutation.


Conflict of interest statement

The authors declare no competing interest.

Figures

Fig. 1.
Fig. 1.
Reduction of analyzed genomic regions by EcoSeq. (A) Schema of genomic region reduction and adaptor ligation of EcoSeq. Analyzed genomic regions are reduced by digestion using the BamHI restriction enzyme and size selection. Partial filling-in using dATP and dGTP enabled specific ligation to a 5′-TC-tailed adaptor with a sticky end, and excluded illegitimate inserts. Red circle represents a mutation present in a single DNA molecule. (B) Expected reduction rate using five restriction enzymes. Enzymatically digested fragments of 100 to 700 bp were expected to be used to prepare the EcoSeq library. A reduction rate was calculated as genomic regions covered by digested fragments of 100 to 700 bp within the entire genome. BamHI was expected to have the highest reduction rate and adopted for EcoSeq. (C) Total number of analyzed base pairs from 40 M PE reads by EcoSeq. Ligation using a 5′-TC-tailed adaptor from 100 ng genomic DNA (v1 adaptor, n = 3) showed a larger number of analyzed base pairs than normal 3′-dA-tailed adaptor from 500 ng genomic DNA (v0 adaptor, n = 4) using the same cell line sample. Error bar represents the SD. (D) Mutation frequency of EcoSeq library prepared by v0 and v1 adaptors. Mutation frequencies of the same cell line sample were consistent between v1 adaptor (n = 3) v0 adaptor (n = 4). Error bar represents the SD.
Fig. 2.
Fig. 2.
Detection of artificially prepared rare mutations. (A) Schema of expected and measured mutation frequencies using model DNA samples. A small amount of HPDE-4 gDNA was mixed into TK6 gDNA, and SNPs present only in HPDE-4 were defined as mutations (artificially prepared mutations). (B) Efficiency in DCS creation. The percentage of DCSs created from PE reads using three pre-PCR copy numbers (1 M, 3 M, and 10 M; n = 3) was analyzed. 1 M pre-PCR copy number showed the highest efficiency to create DCSs. Error bar represents the SD. (C) Total number of analyzed base pairs from 40 M PE reads by EcoSeq. Total number of analyzed base pairs from 40 M PE reads using three pre-PCR copy numbers (1 M, 3 M, and 10 M; n = 3) was compared. 1 M pre-PCR copy number allowed the largest total number of analyzed base pairs. Error bar represents the SD. (D) Accordance between the measured and expected mutation frequencies. The libraries with three mixing ratios (1, 0.1, and 0.01%) prepared from three pre-PCR copy numbers (1 M, 3 M, and 10 M) were analyzed. High accordance was shown in all three mixing ratios prepared from 1 M pre-PCR copy number. No mutations were detected with a mixing ratio of 0.01% and 10 M pre-PCR copy number. (E) Accordance with two additional mixing ratios. The libraries with five mixing ratios (1, 0.3, 0.1, 0.03, and 0.01%) prepared from optimal pre-PCR copy number (1 M) were analyzed in triplicates (1, 0.1, and 0.01%) or duplicates (0.3 and 0.03%). High accordance was shown in all five mixing ratios.
Fig. 3.
Fig. 3.
Detection of rare mutations induced by a mutagen. (A) Mutation frequencies in cells treated with 4-nitroquinoline 1-oxide (4-NQO) for three doses (0.1, 0.3, and 1.0 µg/mL). Mutation induction by 4-NQO was successfully detected in 293FT cells after cloning. Error bar represents 95% confidence interval (CI). (B) The mutational signatures in cells treated with 4-NQO. The signatures associated with 4-NQO treatment including G:C to A:T transitions and G:C to T:A transversions were observed.
Fig. 4.
Fig. 4.
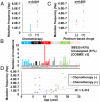
Mutation accumulation in blood cells with chemotherapy. (A) Mutation frequencies of normal peripheral blood cells in pediatric sarcoma patients who received chemotherapy (n = 10) and those who did not (n = 10). Somatic mutations were significantly accumulated in patients with chemotherapy at a level of 10−7 per base pair (P < 0.001). Error bar represents the SD. (B) The mutational signatures in patients with chemotherapy. The signature associated with prior platinum-based chemotherapy (SBS35 in COSMIC v3 signatures) was observed. (C) Mutation frequencies in patients who received platinum-based drugs (n = 6) and those who received other drugs (n = 4). Somatic mutations tended to be accumulated in patients with platinum-based drugs (P = 0.085). Error bar represents the SD. (D) Correlation between mutation frequency and age. Mutation frequencies in patients without chemotherapy (blue dot) were correlated with age.
Fig. 5.
Fig. 5.
Mutation accumulation at multiple time points and in different cell types. (A) Mutation accumulation at two time points of the same pediatric sarcoma patients. Peripheral blood cell samples before and 12 to 31 mo after chemotherapy were analyzed in six patients. Blood cells after chemotherapy showed 2.1 to 12.5 times higher mutation frequencies than those before chemotherapy. Arrows represent the chemotherapy periods, and the dotted lines represent the chemotherapy-free period. (B) The mutational signatures in patients after chemotherapy. The signature associated with prior platinum-based chemotherapy (SBS31 in COSMIC v3 signatures) constituted 69%. (C) Mutation accumulation at three time points of the same pediatric sarcoma patients. Increased mutation levels after chemotherapy persisted even after 46 to 64 mo. (D) Mutation accumulation by chemotherapy in myelocytes and lymphocytes. No differences of mutation accumulation were observed. PBMC, peripheral blood mononuclear cells; Lympho, lymphocytes.

Similar articles

Cited by

References

    1. Yang Z., et al. , Correlation of an epigenetic mitotic clock with cancer risk. Genome Biol. 17, 205 (2016). - PMC - PubMed
    1. Ushijima T., Clark S. J., Tan P., Mapping genomic and epigenomic evolution in cancer ecosystems. Science 373, 1474–1479 (2021). - PubMed
    1. Martincorena I., et al. , Tumor evolution. High burden and pervasive positive selection of somatic mutations in normal human skin. Science 348, 880–886 (2015). - PMC - PubMed
    1. Blokzijl F., et al. , Tissue-specific mutation accumulation in human adult stem cells during life. Nature 538, 260–264 (2016). - PMC - PubMed
    1. Hoang M. L., et al. , Genome-wide quantification of rare somatic mutations in normal human tissues using massively parallel sequencing. Proc. Natl. Acad. Sci. U.S.A. 113, 9846–9851 (2016). - PMC - PubMed

Publication types

LinkOut - more resources