. 2022 Aug 2;119(31):e2121858119.
doi: 10.1073/pnas.2121858119. Epub 2022 Jul 27.

Genetic architecture of dispersal and local adaptation drives accelerating range expansions

Affiliations

Genetic architecture of dispersal and local adaptation drives accelerating range expansions

Jhelam N Deshpande et al. Proc Natl Acad Sci U S A. .

Abstract

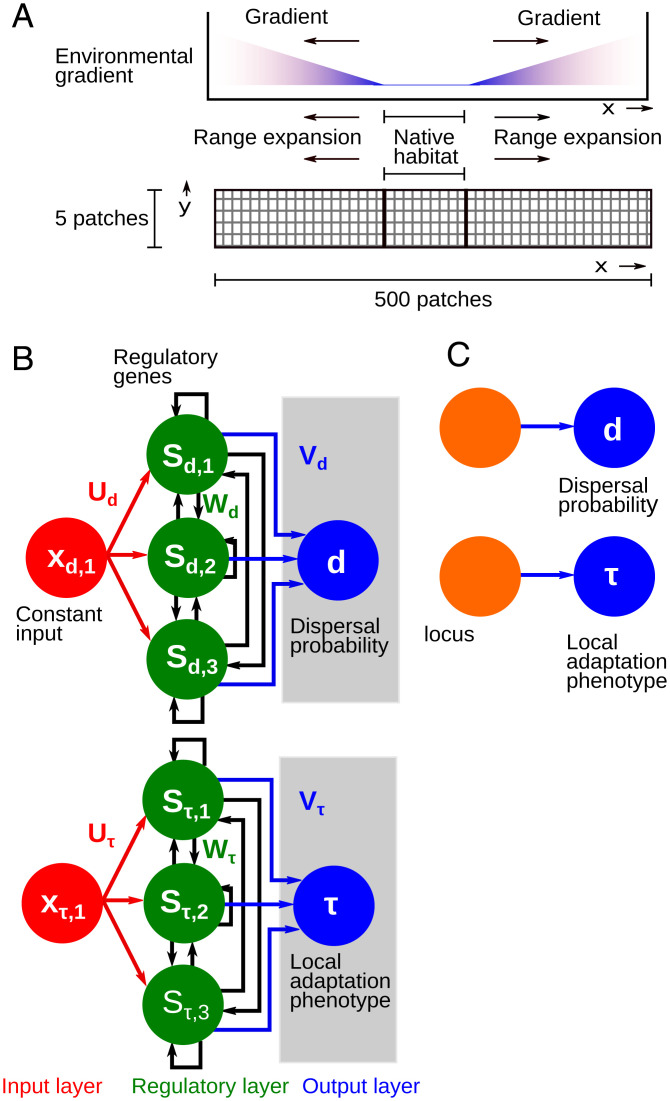
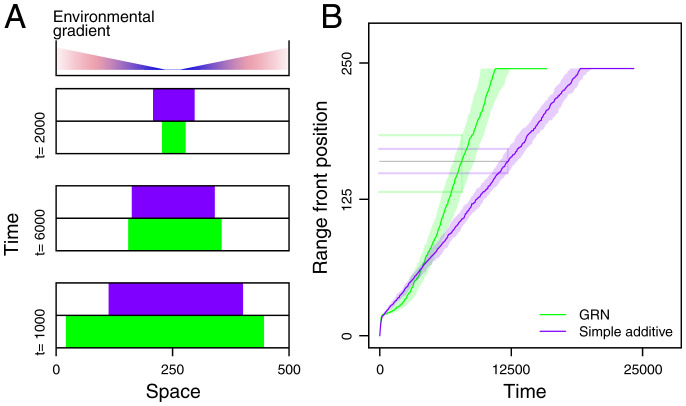
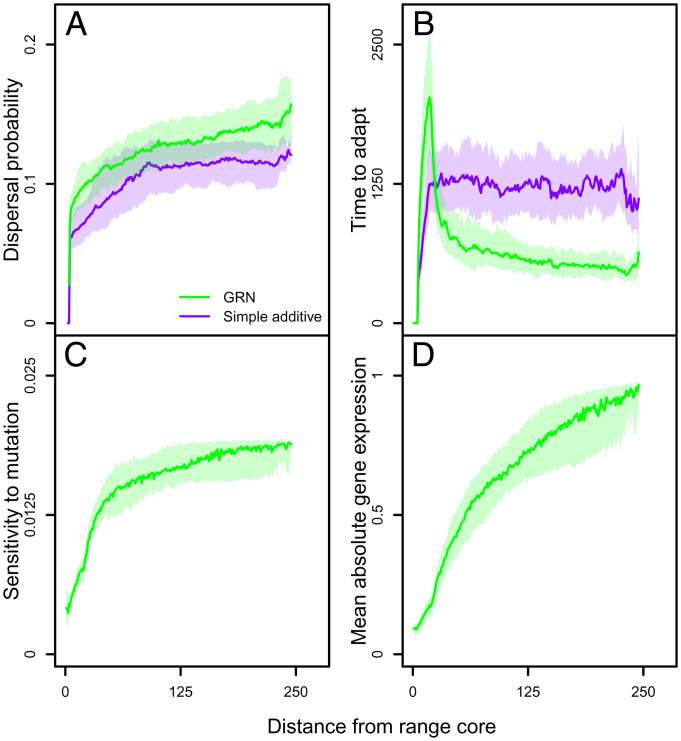
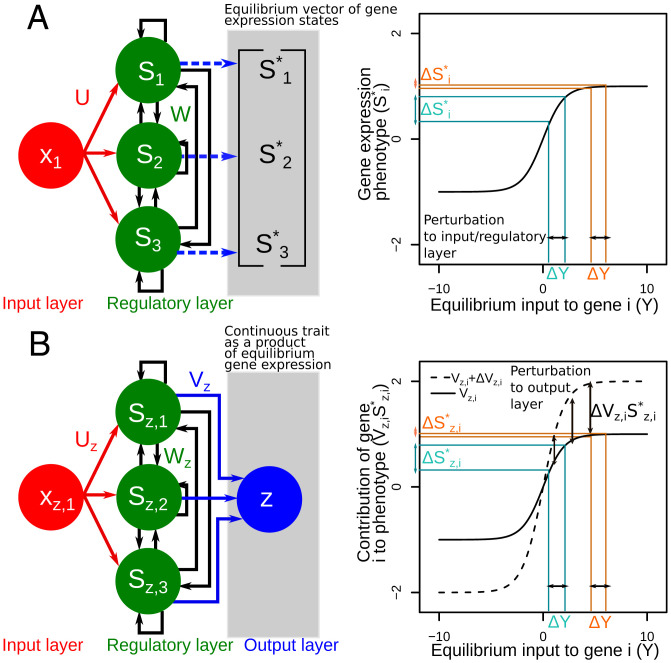
Contemporary evolution has the potential to significantly alter biotic responses to global change, including range expansion dynamics and biological invasions. Models predicting range dynamics often make highly simplifying assumptions about the genetic architecture underlying relevant traits. However, genetic architecture defines evolvability and higher-order evolutionary processes, which determine whether evolution will be able to keep up with environmental change or not. Therefore, we here study the impact of the genetic architecture of dispersal and local adaptation, two central traits of high relevance for range expansions, on the dynamics and predictability of invasion into an environmental gradient, such as temperature. In our theoretical model we assume that dispersal and local adaptation traits result from the products of two noninteracting gene-regulatory networks (GRNs). We compare our model to simpler quantitative genetics models and show that in the GRN model, range expansions are accelerating and less predictable. We further find that accelerating dynamics in the GRN model are primarily driven by an increase in the rate of local adaptation to novel habitats which results from greater sensitivity to mutation (decreased robustness) and increased gene expression. Our results highlight how processes at microscopic scales, here within genomes, can impact the predictions of large-scale, macroscopic phenomena, such as range expansions, by modulating the rate of evolution.

Keywords: biological invasion; environmental gradient; evolvability; gene-regulatory network; robustness.


Conflict of interest statement

The authors declare no competing interest.

Figures

Fig. 1.
Fig. 1.
Range expansions into an environmental gradient (A) and the assumed genetic architectures (B and C). (A) We model range expansions into an environmental gradient in a landscape of 500 × 5 patches. Individuals are initially adapted to their constant, native habitat (range core; central 10 × 5 patches) and can subsequently expand their range into a novel linear environmental gradient of slope b along the x direction. Dispersal is local, and individuals may disperse to one of their eight nearest neighbors. In our standard scenario, we compare range expansion dynamics assuming either that dispersal and local adaptation traits result from the products of two noninteracting GRNs (B) or that both traits have a simple additive genetic architecture (C). (B) The GRN model. Two noninteracting GRNs separately encode dispersal probability (d) and the local adaptation phenotype (τ) of a Gaussian niche function. Each GRN has an input layer (constant input xz,1 to each gene, where z represents the dispersal trait d or the local adaptation trait τ), a regulatory layer (regulatory genes with expression level Sz,i for every gene i for the trait z), and an output layer (the phenotype downstream of gene expression, here dispersal [d] or local adaptation [τ]) highlighted in gray. Uz,Wz, and Vz are matrices of weights that connect the input layer to the regulatory layer, the genes within the regulatory layer, and map gene expression states to the output phenotype, respectively, for each trait z. (C) Simple additive genetic architecture. One quantitative locus each encodes dispersal (d) and the local adaptation trait (τ). Even though in the main text results we assume a simple additive model with only one locus for each trait, we also explore the consequences of assuming different numbers of loci and per locus mutation effects (SI Appendix).
Fig. 2.
Fig. 2.
Comparing range dynamics for GRN (green) and simple additive (purple) genetic architectures. (A) Example snapshot of the landscape at different times (t=2,000,6,000,10,000) since the beginning of range expansion where occupied patches are in color and unoccupied patches are blank. The environmental gradient increases symmetrically on either side of the landscape. Early in the range expansion (t=2,000), new patches are colonized more quickly in the simple additive model, but accelerating range expansions in the GRN model invert this pattern later on (t=6,000,10,000). (B) Range front position, that is, the position of the occupied patch farthest from the range core, as a function of time since the beginning of range expansion. Since we model a symmetric environmental gradient, range expansions toward both sides of the landscape are comparable. Thus, we pool the 50 replicates, which amount to a total of 100 range expansions. The solid line represents the median position of the range front over these 100 range expansions of our stochastic model. The shading represents the corresponding interquartile range. The horizontal lines highlight the differences in variability of range expansion between the GRN and simple additive models when the range front is at the same median distance (160 patches; indicated in gray) from the range core. Focal scenario parameters are as follows: b = 0.04, λ0=2,α=0.01, mmin = 0.0001, μ=0.1, ϵ = 0, ω = 1, and number of genes per GRN n = 3.
Fig. 3.
Fig. 3.
Evolved dispersal probability (A), time to adapt (B), sensitivity to mutation (C), and mean absolute gene expression levels (D) as a function of the distance from the range core for the GRN (green) and simple additive (purple) models. All measures are calculated for 100 replicate range expansions, solid lines are medians, and shaded areas interquartile ranges. (A) Dispersal probability increases as the expanding population moves farther from the range core in both the GRN and simple additive models. (B) Time to adapt. The time to adapt is the duration an expanding population takes to completely adapt to a novel environment (patch cross-section). The time to adapt decreases as the expanding population moves farther along the environmental gradient for the GRN model but remains constant in the simple additive model. Note that the initial increase is due to standing genetic variation present in the range core. (C) Sensitivity to mutation of the local adaptation trait. This is a measure of how much the local adaptation phenotype changes in response to an introduced mutation in the GRN genotype (SI Appendix). For the GRN model, the sensitivity to mutation increases as a function of the distance from the range core. Phenotypic effects of mutation cannot change in the simple additive model. (D) Mean absolute gene expression. We average the absolute value of gene expression states of all genes in the GRN. Gene expression states evolve to extremes farther away from the range core. Focal scenario parameters are as follows: b = 0.04, λ0=2,α=0.01, mmin = 0.0001, μ=0.1, ϵ = 0, ω = 1, and number of genes per GRN n = 3.
Fig. 4.
Fig. 4.
Mechanism for the evolution of increased sensitivity to mutation in the sigmoid Wagner model (A) and the local adaptation GRN in the present study (B). For this example, we consider a highly simplified scenario in which the GRN is at a fixed point equilibrium, and we focus on how a single gene would respond to perturbations to the genotype at extreme and intermediate gene expression levels. We further assume that any perturbation in the input the gene receives takes its gene expression to another fixed point equilibrium. For an easier comparison of both GRN models, the phenotype under selection is highlighted with a gray background. (A) In the sigmoid Wagner model, the vector of equilibrium gene expression states S* is the phenotype under selection; therefore, any perturbation ΔY in the input a single gene receives (either from the input layer or from other genes) would lead to greater phenotypic difference at intermediate gene expression states when compared to those at extremes (ΔSi*) (39). (B) In our model the output z of the GRN is the continuous local adaptation phenotype under selection. Here the linear effects downstream of a gene i contribute to a trait determined by the output weight Vz,i; therefore, the contribution of each gene to the phenotype is Vz,iSz,i*. In this case, any perturbation in the output weights Vz,i, say, Vz,i+ΔVz,i, would yield a greater difference in contribution to the phenotype at extreme rather than intermediate gene expression.

Similar articles

Cited by

References

    1. Bullock J. M., et al. ., Human-mediated dispersal and the rewiring of spatial networks. Trends Ecol. Evol. 33, 958–970 (2018). - PubMed
    1. Chen I. C., Hill J. K., Ohlemüller R., Roy D. B., Thomas C. D., Rapid range shifts of species associated with high levels of climate warming. Science 333, 1024–1026 (2011). - PubMed
    1. Petchey O. L., et al. ., The ecological forecast horizon, and examples of its uses and determinants. Ecol. Lett. 18, 597–611 (2015). - PMC - PubMed
    1. Melbourne B. A., Hastings A., Highly variable spread rates in replicated biological invasions: Fundamental limits to predictability. Science 325, 1536–1539 (2009). - PubMed
    1. Giometto A., Rinaldo A., Carrara F., Altermatt F., Emerging predictable features of replicated biological invasion fronts. Proc. Natl. Acad. Sci. U.S.A. 111, 297–301 (2014). - PMC - PubMed

Publication types

LinkOut - more resources