. 2023 Mar;19(3):1000-1025.
doi: 10.1080/15548627.2022.2103961. Epub 2022 Jul 27.

TNK2/ACK1-mediated phosphorylation of ATP5F1A (ATP synthase F1 subunit alpha) selectively augments survival of prostate cancer while engendering mitochondrial vulnerability

Affiliations

TNK2/ACK1-mediated phosphorylation of ATP5F1A (ATP synthase F1 subunit alpha) selectively augments survival of prostate cancer while engendering mitochondrial vulnerability

Surbhi Chouhan et al. Autophagy. 2023 Mar.

Abstract

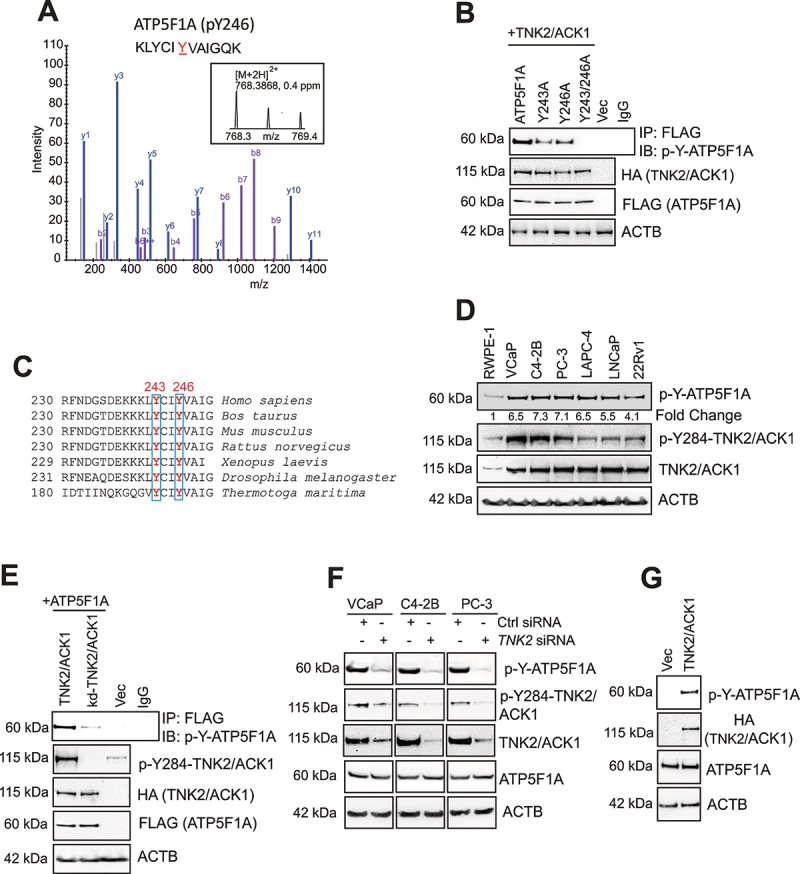
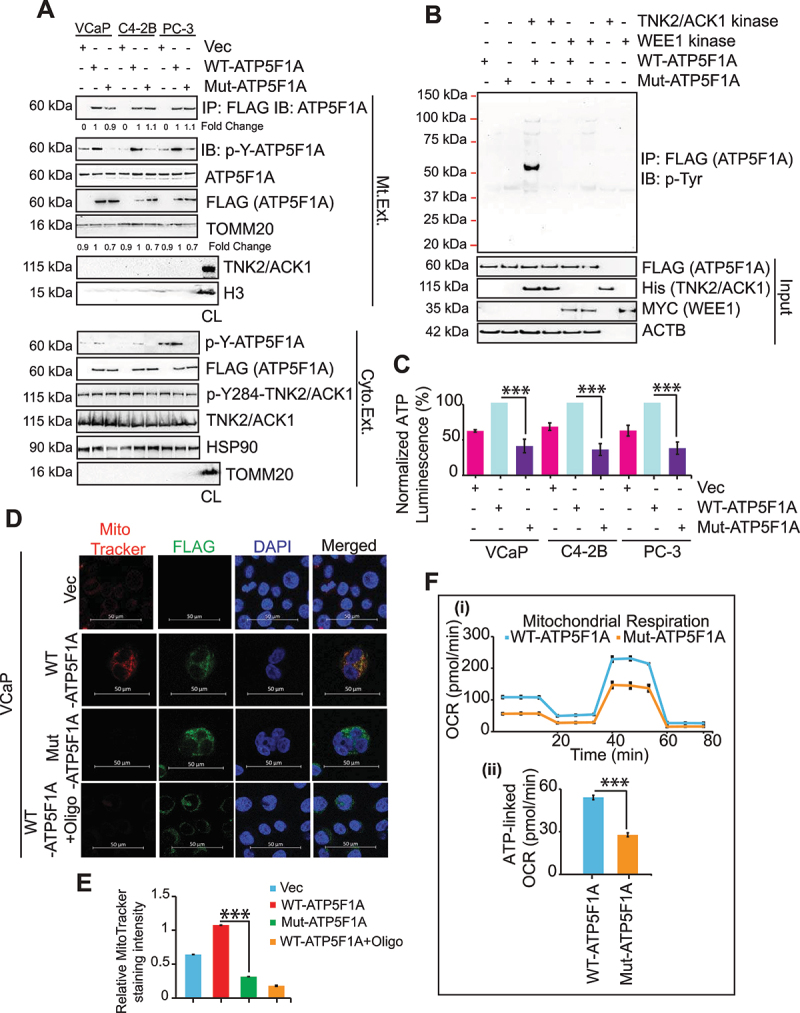
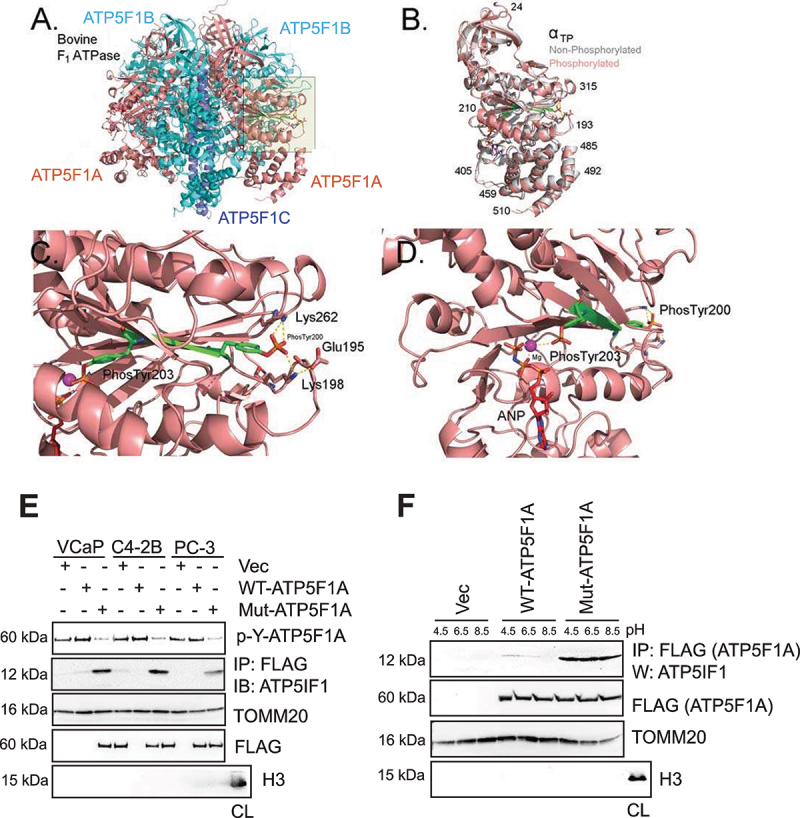
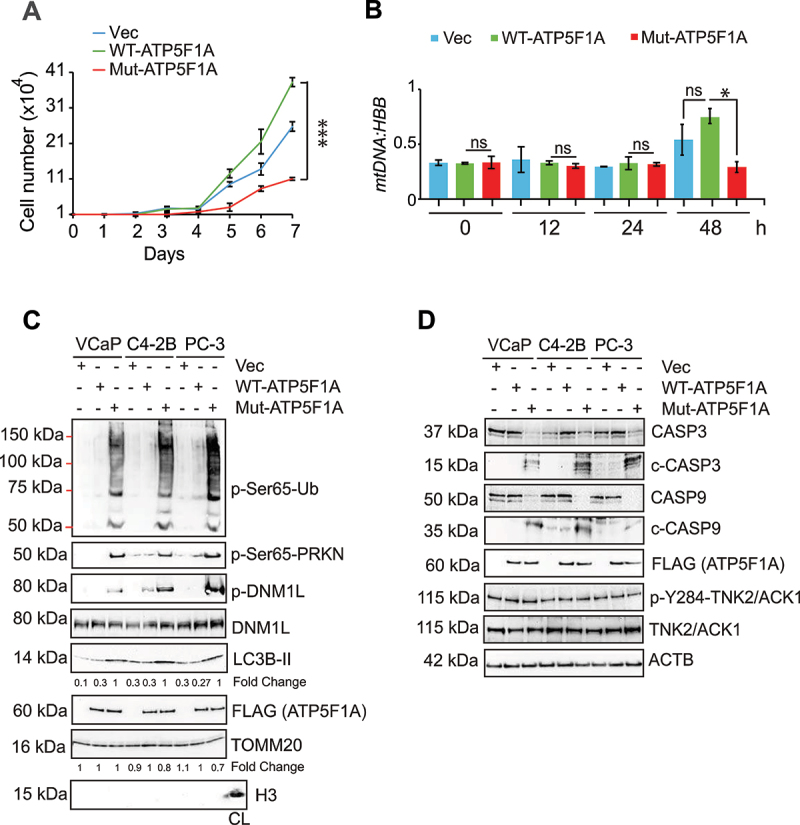
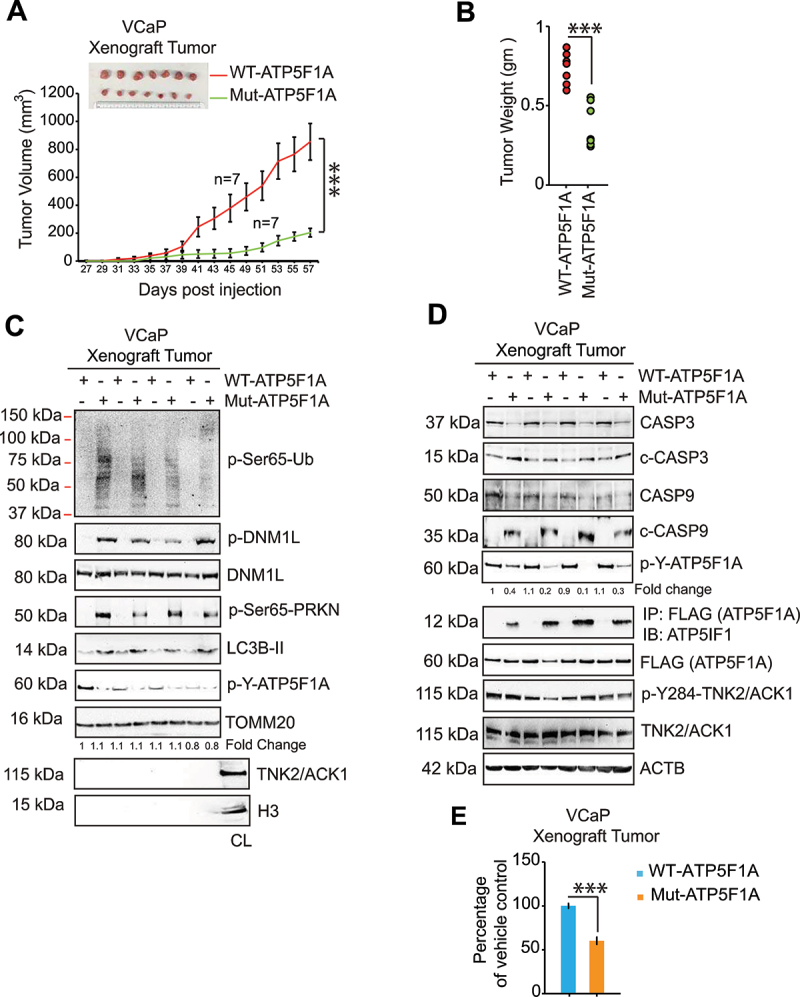
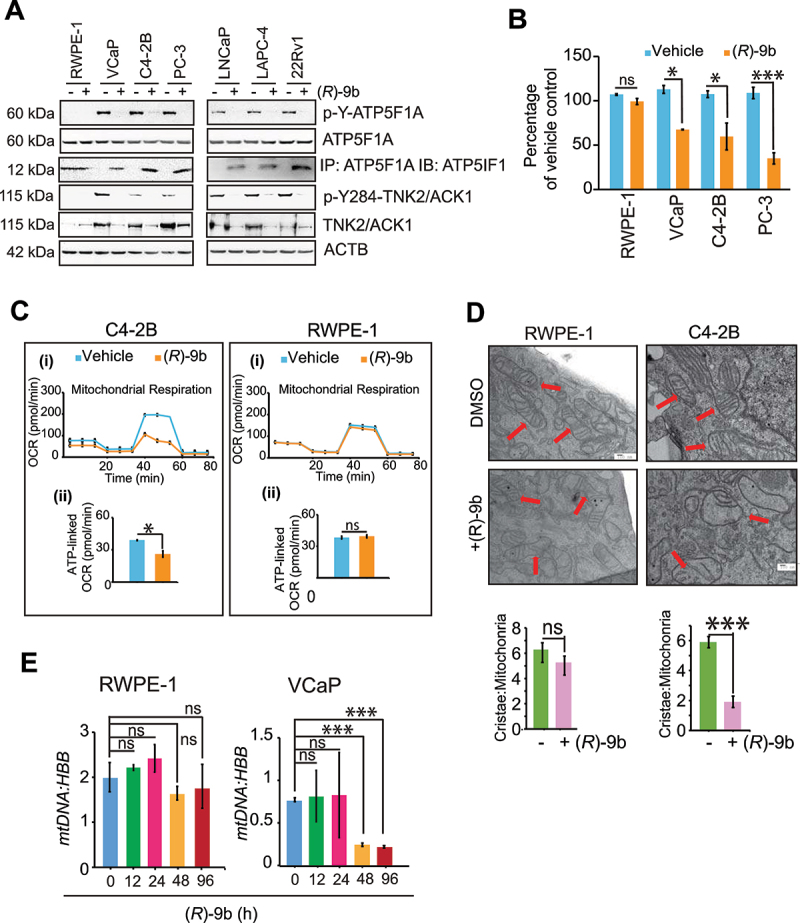
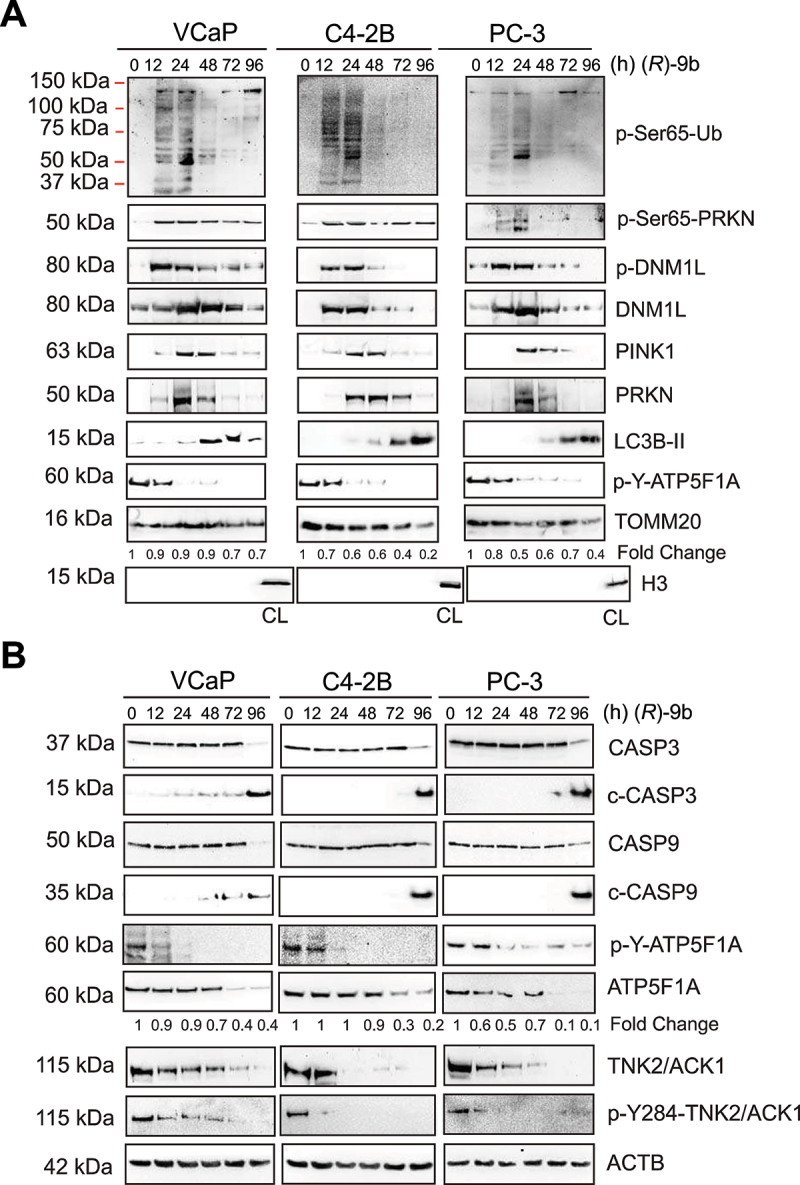
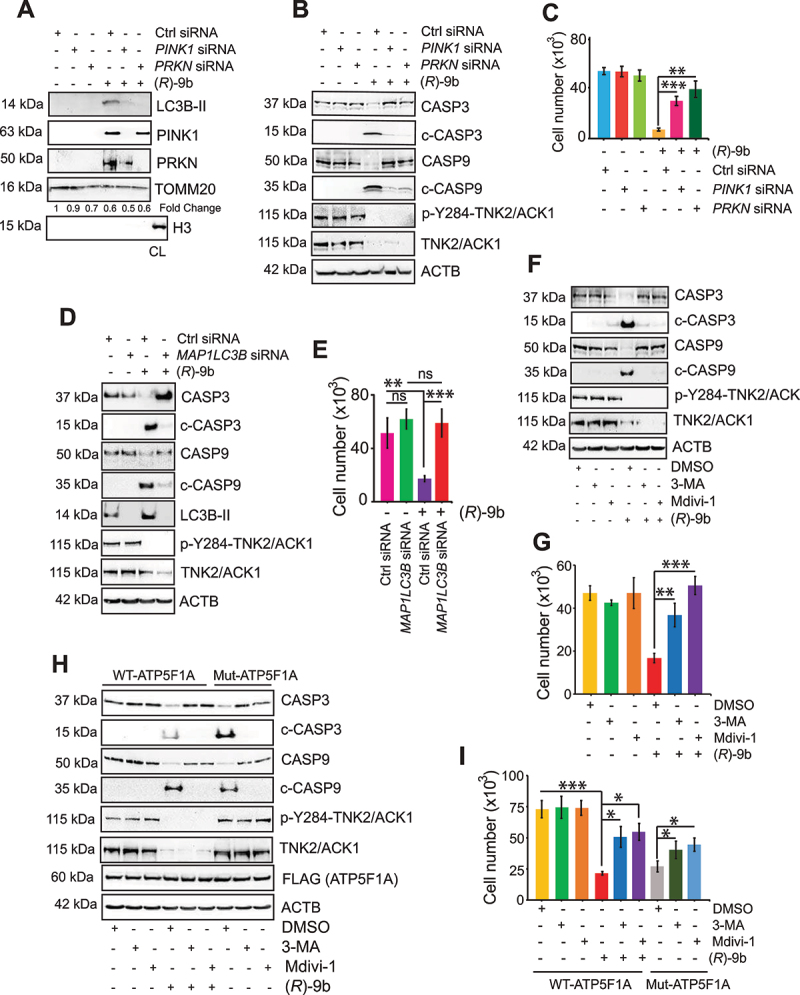
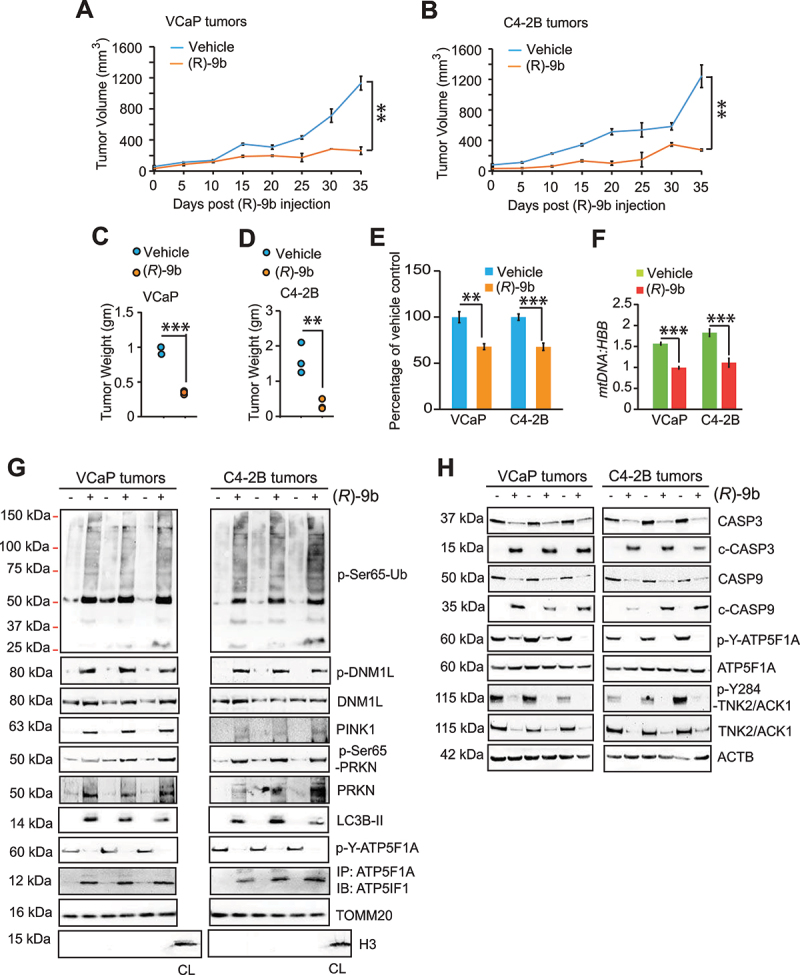
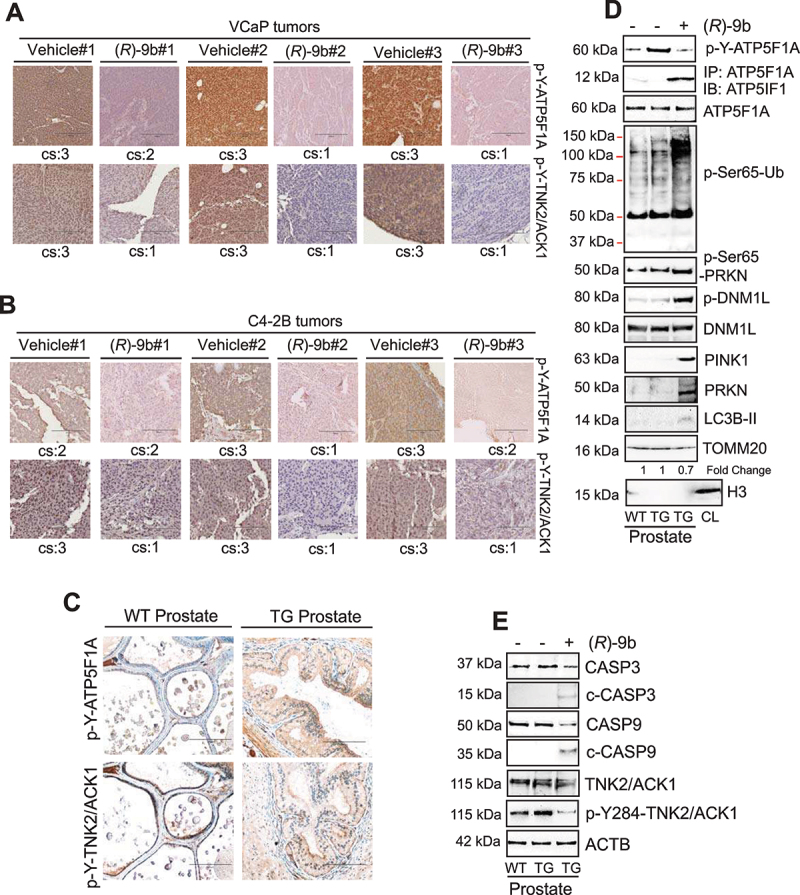
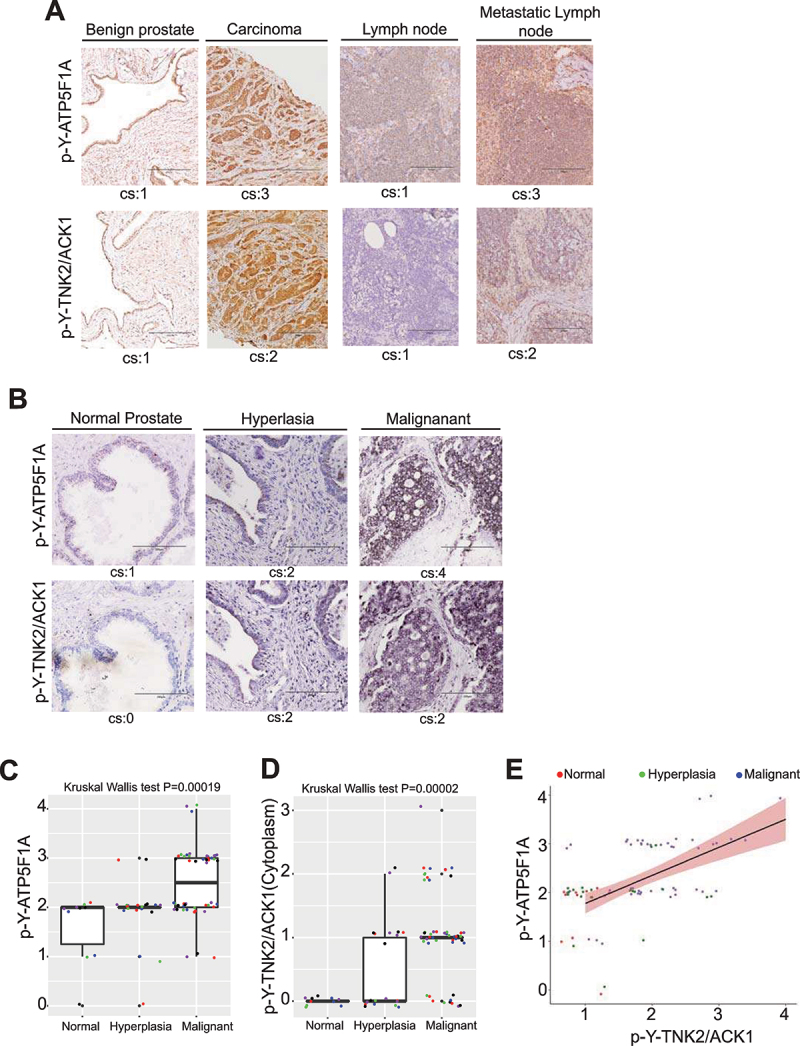
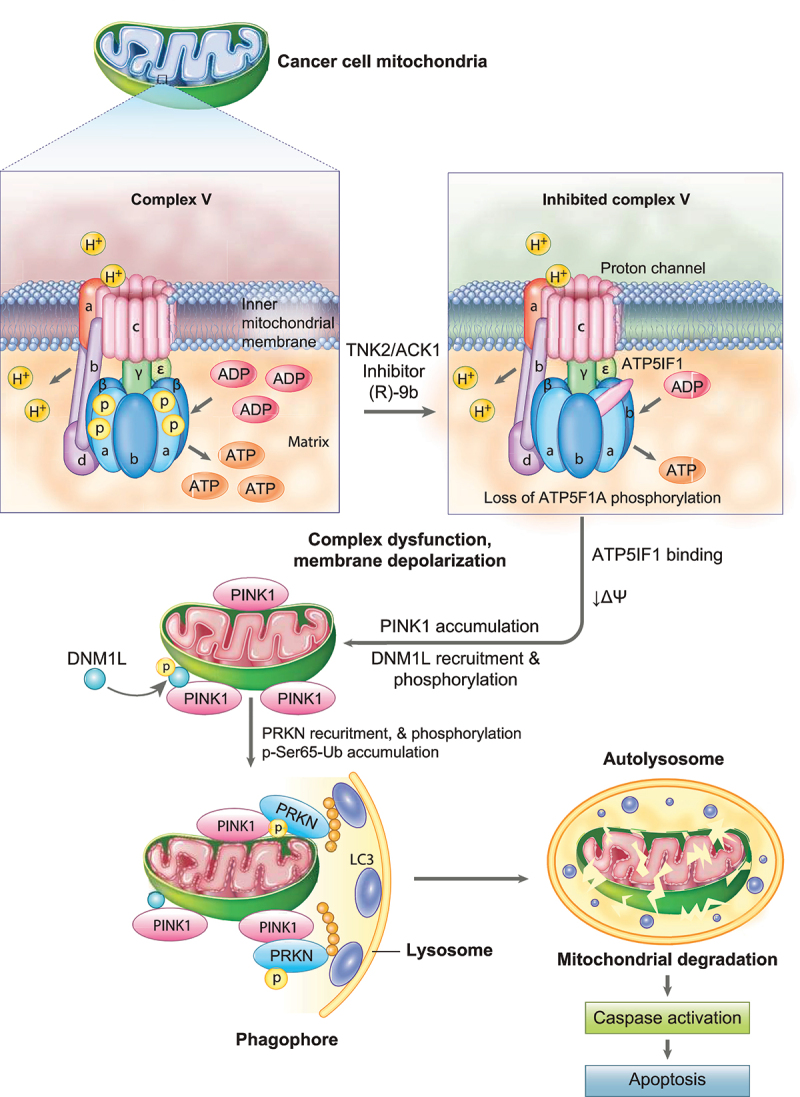
The challenge of rapid macromolecular synthesis enforces the energy-hungry cancer cell mitochondria to switch their metabolic phenotypes, accomplished by activation of oncogenic tyrosine kinases. Precisely how kinase activity is directly exploited by cancer cell mitochondria to meet high-energy demand, remains to be deciphered. Here we show that a non-receptor tyrosine kinase, TNK2/ACK1 (tyrosine kinase non receptor 2), phosphorylated ATP5F1A (ATP synthase F1 subunit alpha) at Tyr243 and Tyr246 (Tyr200 and 203 in the mature protein, respectively) that not only increased the stability of complex V, but also increased mitochondrial energy output in cancer cells. Further, phospho-ATP5F1A (p-Y-ATP5F1A) prevented its binding to its physiological inhibitor, ATP5IF1 (ATP synthase inhibitory factor subunit 1), causing sustained mitochondrial activity to promote cancer cell growth. TNK2 inhibitor, (R)-9b reversed this process and induced mitophagy-based autophagy to mitigate prostate tumor growth while sparing normal prostate cells. Further, depletion of p-Y-ATP5F1A was needed for (R)-9b-mediated mitophagic response and tumor growth. Moreover, Tnk2 transgenic mice displayed increased p-Y-ATP5F1A and loss of mitophagy and exhibited formation of prostatic intraepithelial neoplasia (PINs). Consistent with these data, a marked increase in p-Y-ATP5F1A was seen as prostate cancer progressed to the malignant stage. Overall, this study uncovered the molecular intricacy of tyrosine kinase-mediated mitochondrial energy regulation as a distinct cancer cell mitochondrial vulnerability and provided evidence that TNK2 inhibitors can act as "mitocans" to induce cancer-specific mitophagy.Abbreviations: ATP5F1A: ATP synthase F1 subunit alpha; ATP5IF1: ATP synthase inhibitory factor subunit 1; CRPC: castration-resistant prostate cancer; DNM1L: dynamin 1 like; MAP1LC3B/LC3B: microtubule associated protein 1 light chain 3 beta; Mdivi-1: mitochondrial division inhibitor 1; Mut-ATP5F1A: Y243,246A mutant of ATP5F1A; OXPHOS: oxidative phosphorylation; PC: prostate cancer; PINK1: PTEN induced kinase 1; p-Y-ATP5F1A: phosphorylated tyrosine 243 and 246 on ATP5F1A; TNK2/ACK1: tyrosine kinase non receptor 2; Ub: ubiquitin; WT: wild type.

Keywords: ATP5F1A; ATP5IF1; TNK2/ACK1; mitochondrial dysfunction; mitochondrial vulnerability; mitophagy; tyrosine phosphorylation.


Conflict of interest statement

Patents “Inhibitors of ACK1/TNK2 Tyrosine Kinase” (patent no. 9,850,216 and 10,017,478) cover (R)-9b compound. N.P.M. is named as inventor. Both the patents have been licensed by TechnoGenesys Inc. N.P.M. is a cofounder of TechnoGenesys Inc., own stocks, and serve as a consultant for TechnoGenesys Inc.

Figures

Figure 1.
Figure 1.
Phosphorylation of ATP5F1A (ATP synthase F1 subunit alpha) at evolutionarily conserved Y243 and Y246 sites by TNK2/ACK1 kinase. (A) Lysates of HEK293T cells transfected with TNK2/ACK1 were processed for LC-MS/MS analysis. A peptide KLYCIYVAIGQK from ATP5F1A (p-Y246) was detected at m/z 768.3868 (2+), which represents mass accuracy of 0.4 ppm (MS1). MS/MS spectrum confirmed the peptide sequence. The identification were made with MaxQuant software. (B) HEK293T cells were co-transfected with HA-tagged TNK2/ACK1 and FLAG-tagged ATP5F1A or mutants, Y243A or Y243/246A or vector (Vec) expressing constructs. Lysates were immunoprecipitated with FLAG beads or IgG, followed by immunoblotting with p-Tyr antibodies (Top panel). (C) Alignment of ATP5F1A protein sequence indicates that tyrosine residue at 243 and 246 site is invariant from human to bacteria. (D) Lysates prepared from RWPE-1, VCaP, C4-2B, PC-3, LAPC-4, LNCaP and 22Rv1 cells were screened for detection of p-Y-ATP5F1A, p-Y284-TNK2/ACK1, TNK2/ACK1 and ACTB by immunoblotting with respective antibodies. (E) HEK293T cells were co-transfected with FLAG-tagged ATP5F1A and HA-tagged TNK2/ACK1 or kd-TNK2/ACK1-TNK2/ACK1 or vector (Vec). Lysates were immunoprecipitated with p-Y-ATP5F1A or IgG, followed by immunoblot to detect ATP5F1A, p-Y284-TNK2/ACK1, HA, FLAG and ACTB levels. (F) VCaP, C4-2B, PC-3 cells were transfected with control (Ctrl) and TNK2 siRNA and levels of the indicated proteins were examined by immunoblotting. (G) Lysates from RWPE-1 cells stably expressing HA-tagged TNK2/ACK1 and vector, were subjected to immnunoblotting.
Figure 2.
Figure 2.
Y243/246-phosphorylation of ATP5F1A increases ATP synthase activity in prostate cancer cells by blocking ATP5IF1 binding. (A) Mitochondrial and Cytosolic extracts of VCaP, C4-2B and PC-3 cells stably expressing FLAG-tagged ATP5F1A and Mut-ATP5F1A were immunoblotted with p-Y-ATP5F1A (1st panel) and indicated antibodies. Total cell lysate (CL) is used as control for mitochondrial (Mt. Ext.) or cytosolic extract (Cyto. Ext.). (B) In vitro kinase assay performed using purified TNK2/ACK1 and a non-specific kinase, WEE1, with WT or Mut-ATP5F1A proteins immunoprecipitated on FLAG beads. The reaction was then immunoblotted with p-Tyr antibody to detect phosphorylation on ATP5F1A. (C) ATP levels were determined by luminescence-based assay in VCaP, C4-2B and PC-3 cells stably expressing vector (Vec) or FLAG-tagged WT-ATP5F1A and Mut-ATP5F1A variants. Data are represented as mean ± SEM (n = 3, 3 replicates). ***p < 0.001. (D and E) VCaP cells expressing vector (Vec), FLAG-tagged ATP5F1A and Mut-ATP5F1A were treated with DMSO or oligomycin (Oligo) (0.5 μM) for 3 h co-stained with MitoTracker and TOMM20 and were processed for immunofluoresence-based detection. Bars: 50 μm. MitoTracker Red staining intensity was normalized with DAPI staining intensity using densitometric analysis by ImageJ software (NIH) and fold changes were represented as mean ± SEM of relative MitoTracker staining intensity. ***p < 0.001. (F) (i) A representative graph of OCR outputs from the seahorseXF26 analyzer of VCaP cells expressing WT-ATP5F1A and Mut-ATP5F1A variants and the response to oligomycin, FCCP, and antimycin A/rotenone. (ii) Comparison of ATP-linked OCR in WT and Mut-ATP5F1A cells.
Figure 3.
Figure 3.
Representation of the structure of the phosphorylated form of the mammalian ATP F1 ATPase. (A-D) The crystal structure of bovine F1 ATPase (pdb: 1BMF) were energy minimized before (gray) and after replacement of Try200 and Tyr203 with phospho-tyrosine (p-Tyr). In A-D, the structure of the phosphorylated form were colored by subunit (ATP5F1A, ATP5F1B, ATP5F1C as salmon, cyan, purple, respectively). Residues 200–203 are colored green. The non-phosphorylated form is colored in gray and superimposed on the phosphorylated from in B. Cartoon of the bovine F1 ATPase is shown in A. The area shaded in yellow is zoomed in C and D. (C) Zoomed image of the region around the α-subunit that interacts with phospho-tyrosine 200 and 203. (D) The same as C, except that the perspective is changed and residues 211–227 were removed to allow visualization of p-Tyr203. Other colors for atoms: blue: nitrogen, Orange: phosphate, red: oxygen, magenta: Mg2+. Hydrogen atoms were added to the structure, but are not shown in the figures. (E) Mitochondrial extracts were immunoblotted with p-Y-ATP5F1A antibodies (top panel). In addition, lysates were immunoprecipitated with FLAG antibodies, followed by immunoblotting with ATP5IF1 antibodies (2nd panel). Total cell lysate (CL) is used as control for mitochondrial extract. (F) C4-2B cells expressing vector (Vec), FLAG-tagged ATP5F1A and Mut-ATP5F1A were cultured in media with pH 4.5, 6.5 and 8.5, for 6 h. Mitochondrial extracts were immunoprecipitated with FLAG (ATP5F1A) antibody, followed by immunoblotting with ATP5IF1 antibody, respectively (top panel). Total cell lysate (CL) is used as control for mitochondrial extract.
Figure 4.
Figure 4.
Ablation of Y243/246-phosphorylation on ATP5F1A induces mitophagy. (A) VCaP cells expressing FLAG-tagged ATP5F1A, Mut-ATP5F1A and control vector were grown in culture media with 1% serum for 7 days and number of viable cells was determined utilizing trypan blue exclusion assay. (B) Lysates were subjected for detection of mtDNA and HBB gene expression by qPCR. (C and D) Mitochondrial and cellular lysates from these cells were subjected to immunoblotting for the indicated proteins. For A and B, data are represented as mean ± SEM (n = 3, 3 replicates). *p < 0.05, ***p < 0.001.
Figure 5.
Figure 5.
TNK2/ACK1-mediated ATP5F1A Y243/246-phosphorylation promotes prostate xenograft tumor growth by overcoming mitophagy. (A) VCaP cells stably expressing ATP5F1A or Mut-ATP5F1A (2 × 106 cells/mice) were injected subcutaneously in mouse and tumor progression was monitored. Tumor volume is represented as mean of 7 mice ± SE. (B) Dot plot represents individual tumor weight n = 7 each group. ***p < 0.001. (C) Levels of p-Y-ATP5F1A (6th panel) along with mitophagy marker proteins and (D) Levels of p-Y-ATP5F1A (5th panel), ATP5F1A/ATPIF1 complex (6th panel) and p-Y284-TNK2/ACK1 (8th panel) were detected in tumor lysates by immunoblotting. (E) The mitochondrial extract from tumors were processed to determine ATP synthase activity. For E, data are represented as mean ± SEM (n = 3, 3 replicates). *p < 0.05, ***p < 0.001.
Figure 6.
Figure 6.
Loss of ATP5F1A Y243/246-phosphorylation causes loss of mitochondrial function in prostate cancer cells while sparing normal cells. (A) RWPE-1, VCaP, C4-2B, PC-3, LNCaP, LAPC-4 and 22Rv1 cells were treated with 1 μM of (R)-9b and protein lysates were processed for detection of p-Y-ATP5F1A (top panel), ATP5F1A, p-Y284-TNK2/ACK1 and TNK2/ACK1. In addition, the lysates were also immunoprecipitated with ATP5F1A, followed by immunoblotting with ATP5IF1 antibodies (3rd panel). (B) These lysates were also accessed for ATP synthase activity. (C) (i) A representative graph of OCR outputs from the XF24 analyzer of C4-2B and RWPE-1 cells were treated with 1 μM of (R)-9b for 12 h and the response to oligomycin, FCCP, and antimycin A/rotenone was recorded. (ii) Comparison of ATP-linked OCR in (R)-9b treated and untreated cells. (D) RWPE-1 and C4-2B cells were treated with 1 μM of (R)-9b for 48 h and processed for electron microscopy. Bars: 100 μm. (E) RWPE-1 and VCaP cells were treated with 1 µM of (R)-9b for 0, 12, 24, 48 and 96 h and lysates were subjected for detection of mtDNA and HBB levels by quantitative qPCR. For B, C, D and E, data are represented as mean ± SEM (n = 3, 2 replicates). ns, not significant. *p < 0.05, **p < 0.01, ***p < 0.001.
Figure 7.
Figure 7.
(R)-9b-mediated inhibition of ATP5F1A Y243/246-phosphorylation sensitize prostate cancer cells to mitophagy. (A) VCaP, C4-2B and PC-3 cells were treated with 1 µM of (R)-9b for indicated time duration and mitochondrial extracts were processed for detection of p-Ser65-Ub, p-Ser65-PRKN, p-DNM1L, DNM1L, LC3B-II, PINK1, PRKN and TOMM20 by immunoblotting (top 2 panels). Total cell lysate (CL) is used as control for mitochondrial or cytosolic extract. (B) Whole cell lysates were processed for detection of the indicated proteins.
Figure 8.
Figure 8.
Anchoring of defective mitochondria to lysosome promoted by (R)-9b, mediating autophagic response. (A) VCaP cells were transfected with control (Ctrl) or PINK1 or PRKN siRNA, followed by (R)-9b (1 μM) for 72 h and mitochondrial extracts were subjected to immunoblot-based detection of the indicated proteins. (B) VCaP cells were transfected with control (Ctrl) or PINK1 or PRKN siRNA, followed by (R)-9b (1 μM) for 72 h and cell lysates were subjected to immunoblot-based detection of the indicated proteins. (C) VCaP cells were transfected with control (Ctrl) or PINK1 or PRKN siRNA, followed by (R)-9b (1 μM) for 96 h and surviving cell number was determined by trypan blue exclusion assay. (D) VCaP cells were transfected with control (Ctrl) or MAP1LC3B siRNA, followed by (R)-9b (1 μM) for 72 h and cell lysates were subjected to immunoblot-based detection of the indicated proteins. (E) VCaP cells were transfected with control (Ctrl) or MAP1LC3B siRNA, followed by (R)-9b (1 μM) for 96 h and surviving cell number was determined by trypan blue exclusion assay. (F) VCaP cells were pre-treated with 3-MA (5 mM) or Mdivi-1 (10 μM), followed by (R)-9b (1 μM) for 72 h and lysates were subjected to immunoblot-based detection of the indicated proteins. (G) VCaP cells were pre-treated with 3-MA (5 mM) or Mdivi-1 (10 μM), followed by (R)-9b (1 μM) for 72 h and surviving cell number was determined by trypan blue exclusion assay. (H) VCaP cells expressing FLAG-tagged WT-ATP5F1A and Mut-ATP5F1A were pre-treated with 3-MA (5 mM) or Mdivi-1 (10 μM) followed by (R)-9b (1 μM) for 72 h. Cell lysates were immunoblotted for detection of the indicated proteins (Lower panel). (I) These cells were subjected to trypan blue exclusion assay to determine the surviving cell number. For C, E, G and I, data are represented as mean ± SEM (n = 3, 3 replicates). ns- not significant, *p < 0.05, **p < 0.01, ***p < 0.001.
Figure 9.
Figure 9.
TNK2/ACK1 inhibitor (R)-9b suppresses p-Y-ATP5F1A and prostate tumors growth. (A and B) VCaP and C4-2B cells (2 × 106/mice) were injected subcutaneously in SCID mice and once tumors were palpable, mice were injected with vehicle (6% Captisol) or (R)-9b (dissolved in 6% Captisol), 5 times a week for 5 weeks. The tumor volume was measured using calipers. (C) The mitochondrial extracts were processed for determining ATP synthase activity. (D) mtDNA and HBB levels were determined by qPCR. (E) Tumor mitochondrial extract were processed for immunoblot-based detection of p-Ser65-Ub, p-Ser65-PRKN, p-DNM1L, DNM1L, LC3B-II, PINK1, PRKN and TOMM20. Additionally, the lysates were also immunoprecipitated with ATP5F1A, followed by immunoblotting with ATP5IF1 antibodies (4th panel). (F) Tumor lysates were immunoblotted for detection of the indicated proteins. For A-F, data are represented as mean ± SEM (for E and F, n = 3, 2 replicates). ns- not significant, *p < 0.05, **p < 0.01, ***p < 0.001.
Figure 10.
Figure 10.
Loss of TNK2/ACK1 kinase activity depletes p-Y-ATP5F1A in tumor xenograft and mice models. (A and B) VCaP and C4-2B tumors treated with (R)-9b were processed for immunohistochemistry-based detection of p-Y-ATP5F1A, p-Y284-ACK. Histological scores for cytosolic staining (cs) in each sample is represented at bottom of each image. (C) TNK2 transgenic mice (TG) prostate sections were subjected to IHC staining with p-Y-ATP5F1A and p-Y-284-TNK2/ACK antibodies. (D) Mitochondrial lysates from prostates of wild type and TG mice were subjected to immunoblotting with indicated antibodies. (E) Total lysates from prostates of wild type and TG mice were subjected to immunoblotting with indicated antibodies.
Figure 11.
Figure 11.
P-Y284-TNK2/ACK1 and p-Y-ATP5F1A expression in TMA is correlated with progression of prostate cancer to malignant stage. (A) Human benign prostates, cancer tissue, lymph nodes and metastatic lymph nodes were subjected to immunohistochemistry-based detection of p-Y-ATP5F1A and p-Y284-TNK2/ACK1. Pathologist’s scores for cytosolic staining (cs) in each sample is shown. Bars: 200 μm. (B) Human prostates TMA were subjected to IHC staining with p-Y-ATP5F1A and p-Y284-TNK2/ACK1 antibodies. Pathologist’s scores for in each sample is shown. Bars: 200 μm. (C and D) Box plots summarize distributions of staining intensities for p-Y-ATP5F1A or p-Y284-TNK2/ACK1 antibody in prostate TMA sections. The box indicates 50% of the data from the 25% quartile to the 75% quartile with the bold black horizontal lines representing the median. Whiskers extend from each end of the box to the most extreme values within 1.5 times the inter quartile range from the ends of the box. The individual data points were jittered and colored for better visualization. (E) Expression levels between p-Y-ATP5F1A and p-Y284-TNK2/ACK1 expression were significantly correlated in prostate tumors (ρ =  0.46, p = 1.9x10⁻⁵).
Figure 12.
Figure 12.
TNK2/ACK1-mediated phosphorylation of ATP5F1A (ATP synthase F1 subunit alpha): Graphical abstract. In prostate cancer cell mitochondria, TNK2/ACK1 inhibition by (R)-9b causes depletion of p-Y243/Y246-ATP5F1A, resulting in enhanced binding of ATP5IF1 to ATP synthase complex. ATP5IF1 binding causes mitochondrial dysfunction in prostate cancer cells, promoting reduction in mitochondrial membrane potential (ΔΨ) thereby elevating mitochondrial membrane depolarization. This mitochondrial stress then enable recruitment of PINK1, which further facilitates recruitment and phosphorylation of DNM1L and PRKN. Consequently, accumulation of p-Ser65-Ub activates PINK1/PRKN mitophagy pathway. The damaged mitochondria experiencing massive PINK1/PRKN activation recruits itself to lysosome membranes via LC3 attached to a phagophore. Targeted cancer mitochondria are subsequently degraded in autolysosome, causing activation of caspase-based apoptosis signaling, leading to cancer cell specific clearance.

Similar articles

Cited by

References

    1. Hanahan D, Weinberg RA.. Hallmarks of cancer: the next generation. Cell. 2011 Mar 4; 144(5):646–674. - PubMed
    1. Garcia-Bermudez J, Cuezva JM. The ATPase Inhibitory Factor 1 (IF1): a master regulator of energy metabolism and of cell survival. Biochim Biophys Acta. 2016. Aug;1857(8):1167–1182. - PubMed
    1. Lemasters JJ. Metabolic implications of non-electrogenic ATP/ADP exchange in cancer cells: a mechanistic basis for the Warburg effect. Biochim Biophys Acta Bioenerg. 2021 Jul 1; 1862(7):148410. - PMC - PubMed
    1. Porporato PE, Filigheddu N, Pedro JMB, et al. Mitochondrial metabolism and cancer. Cell Res. 2018. Mar;28(3):265–280. - PMC - PubMed
    1. Vasan K, Werner M, Chandel NS. Mitochondrial metabolism as a target for cancer therapy. Cell Metab. 2020 Sep 1; 32(3):341–352. - PMC - PubMed

Publication types

Substances