. 2022 Sep 16;82(18):3209-3222.
doi: 10.1158/0008-5472.CAN-21-3914.

GLS2 Is a Tumor Suppressor and a Regulator of Ferroptosis in Hepatocellular Carcinoma

Affiliations

GLS2 Is a Tumor Suppressor and a Regulator of Ferroptosis in Hepatocellular Carcinoma

Sawako Suzuki et al. Cancer Res. .

Abstract

Glutamine synthase 2 (GLS2) is a key regulator of glutaminolysis and has been previously implicated in activities consistent with tumor suppression. Here we generated Gls2 knockout (KO) mice that develop late-occurring B-cell lymphomas and hepatocellular carcinomas (HCC). Further, Gls2 KO mice subjected to the hepatocarcinogenic Stelic Animal Model (STAM) protocol produce larger HCC tumors than seen in wild-type (WT) mice. GLS2 has been shown to promote ferroptosis, a form of cell death characterized by iron-dependent accumulation of lipid peroxides. In line with this, GLS2 deficiency, either in cells derived from Gls2 KO mice or in human cancer cells depleted of GLS2, conferred significant resistance to ferroptosis. Mechanistically, GLS2, but not GLS1, increased lipid reactive oxygen species (ROS) production by facilitating the conversion of glutamate to α-ketoglutarate (αKG), thereby promoting ferroptosis. Ectopic expression of WT GLS2 in a human hepatic adenocarcinoma xenograft model significantly reduced tumor size; this effect was nullified by either expressing a catalytically inactive form of GLS2 or by blocking ferroptosis. Furthermore, analysis of cancer patient datasets supported a role for GLS2-mediated regulation of ferroptosis in human tumor suppression. These data suggest that GLS2 is a bona fide tumor suppressor and that its ability to favor ferroptosis by regulating glutaminolysis contributes to its tumor suppressive function.

Significance: This study demonstrates that the key regulator of glutaminolysis, GLS2, can limit HCC in vivo by promoting ferroptosis through αKG-dependent lipid ROS, which in turn might lay the foundation for a novel therapeutic approach.


Conflict of interest statement

Authors Disclosures

B.R.S. is an inventor on patents and patent applications involving ferroptosis, holds equity in and serves as a consultant to Inzen Therapeutics and Nevrox Limited, and serves as a consultant to Weatherwax Biotechnologies Corporation, and Akin Gump Strauss Hauer & Feld LLP.

All other authors declare no potential conflicts of interest.

Figures

Figure 1.
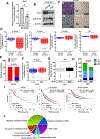
Figure 1.. Progression of tumorigenesis in the absence of Gls2
A, Immunoblot showing Gls2 and Gls1 protein levels in the livers of knockout (KO; Gls2−/−), heterozygous (Hetero; Gls2+/−), and wild-type (WT; Gls2+/+) mice. Actin is the loading control. B, Summary of tumorigenesis in WT and KO mice after 65 weeks of age. HCC signifies hepatocellular carcinoma. C-D, Macroscopic findings of tumorigenesis at 120 weeks of age in (C) KO mice and (D) in WT mice. E, H&E stain of liver sections indicating HCC ≤1 mm, HCC 1 mm–3 mm, and HCC >3 mm. HCC; Hepatocellular cellular carcinoma. F, The average number of liver tumors and the relative size distribution of HCC in two KO mice at 120 weeks was determined based on the analysis of the H&E stain (classified as >3 mm, 1 mm–3 mm, ≤3 mm) shown in E. **p < 0.01. G, Diagram showing generation and pathological analysis of Stelic Animal Model (STAM), a model for non-alcoholic steatohepatitis (NASH) and HCC. H,Macroscopic findings of tumorigenesis in the three experimental groups of STAM: WT mice (WT-STAM), KO mice (KO-STAM) and KO mice fed with high-fat diets mixed with 1% probucol (KO-STAM with probucol). The arrowheads indicate HCCs. I, The average number of tumors and the relative size distribution of HCC from the liver of WT-STAM, KO-STAM, and KO-STAM with probucol at 15 weeks of age were determined based on the analysis of H&E staining (classified as ≤1 mm, 1 mm–3 mm, >3 mm). ***p < 0.001. J, The immunohistochemical appearance of 4-HNE (brown) in normal liver and HCCs of WT-STAM and KO-STAM. Scale bars; 100 μm. K, Expression levels of Ptgs2 (mRNA) in normal liver and HCCs of WT-STAM and KO-STAM were determined by the comparative threshold cycle method and then normalized to 18S expression. Values are the means ± SEM. *p < 0.05.
Figure 2.
Figure 2.. Loss of Gls2 results in HCC lesions with increased resistance to ferroptosis
A, The levels of malondialdehyde (MDA), the end product of lipid peroxidation, in the livers from KO (22 weeks, n=4) and WT (22 weeks, n=4) mice. Values are the means ± SEM. *P < 0.05. B-C, Primary hepatocytes from WT (20 weeks, n=9) or KO mice (20 weeks, n=6) were treated with indicated ferroptosis inducers (erastin 20 μM and IKE 10 μM) for 72 hours in the absence or presence of the ferroptosis inhibitor ferrostatin-1 (Fer-1 20 μM). Representative visualization of the treated primary hepatocytes from WT and KO mice are shown in (B) (20x magnification). ATP based cell viability was assayed post these treatments and the corresponding data in (C) are presented as a percentage of the control (DMSO). Values are the means ± SEM. **p < 0.01. D-E, Cell viability in (D) and Ptgs2 gene expression in (E) were assayed in mice primary hepatocytes from KO mice (20 weeks) transfected with p3×FLAG-CMV10-empty vector (Mock, n=4) or p3×FLAG-CMV10-hGLS2 vector (GLS2wt, n=4). F, RNA levels of the ferroptosis marker, Ptgs2 were obtained from RNA-sequencing analysis performed in liver tissues of WT with non-HCC (20 weeks, n=1), KO with non-HCC (20 weeks, n=3) and KO with HCC (120 weeks, n=1).
Figure 3.
Figure 3.. GLS2 promotes an increase in lipid ROS and a concomitant increase in death due to erastin treatment
A, SKHep1 WT cells were transfected with luciferase RNAi (siLuci), hGLS1 RNAi (siGLS1), or hGLS2 RNAi (siGLS2) for 48 hours followed by immunoblot analysis to detect GLS1 and GLS2 or actin as indicated. B, Cell viability of SKHep1 WT cells that were transfected with siLuci, siGLS1, or siGLS2 for 36 hours and then treated with erastin (0, 5, or 10 μM). The viability was assayed at 18 hours (left panel) and 24 hours (right panel) post erastin treatment. Values are the means ± SEM (n=4). *p < 0.05 versus siLuci. C-D, SKHep1 WT cells were transfected with siLuci, siGLS1, or siGLS2 for 36 hours and then treated with vehicle (DMSO) or erastin (5 μM) for 12 hours (n=6) or 18 hours (n=10). Lipid ROS was detected by C11-BODIPY: the ratio of oxidized form (green) to the non-oxidized form (red) are presented. Bar graph in (C) depicts means ± SEM. ***p < 0.001, *p < 0.05 versus siLuci. Representative images are shown in (D). E-F, Intracellular Fe2+ was detected by FeRhoNox™-1 a fluorescent probe that measures labile iron. The green fluorescence signal from the probe is shown in representative images in F. The bar graph in E depicts means ± SEM (n=6). Scale bars in (D) and (F) 100 μm. G-H, Cell viability in (G) and Lipid ROS in (H) were measured in HepG2 cells that were transfected with siLuci, siGLS1, or siGLS2 for 36 hours and then treated with vehicle (DMSO), erastin (10 μM) or RSL3 (3 μM). The cells were treated for 30 hours (n=6) in (G) and for 24 hours (n=4–6) in (H). Bar graphs depict means ± SEM.,**p < 0.01, *p < 0.05 versus siLuci.
Figure 4.
Figure 4.. GLS2 mediates ferroptosis sensitivity via α-ketoglutarate (αKG)
A, Cell viability in SKHep1 WT cells or SKHep1 p53 knockout cells (SKHep1 p53KO cells) in response to treatment with erastin (5 μM) in the presence or absence of ferrostatin 1 (Fer-1; 5 μM) was measured at the indicated time points. Values are the means ± SEM (n=4). B, Immunoblot analysis of p53 and GLS2 expression in SKHep1 WT or SKHep1 p53KO cells following treatment with erastin (0, 2.5 or 5 μM) for 12 hours (upper panel). Change in mRNA levels of the indicated p53 target genes along with GLS1 after DMSO or erastin (5 μM) treatment for 12 hours in SKHep1 WT or SKHep1 p53KO cells (lower panel). C, Change in mRNA levels of ferroptosis markers after DMSO or erastin (5 μM) treatment for 12 hours in SKHep1 WT or SKHep1 p53KO cells. D, SKHep1 p53KO cells were transfected with p3×FLAG-CMV10-empty vector (Mock), p3×FLAG-CMV10-hGLS1 (GLS1) or p3×FLAG-CMV10-hGLS2 (GLS2) constructs for 48 hours prior to lysis and processing for immunoblotting with anti-GLS2 antibody. E, Intracellular colocalization of GLS2 (PAcGFPN1-hGLS2) and mitochondria (Mito tracker) in SKHep1 KO cells. F, Relative oxygen consumption rate in SKHep1 p53KO cells transfected with Mock or GLS2 (left panel). Relative oxygen consumption rate in SKHep1 WT cells transfected with luciferase RNAi (siLuci) (left) or hGLS2 RNAi (siGLS2) (right). *p < 0.05 versus Mock or siLuci at each time point. G, Intracellular metabolite levels were quantified by CE-MS analysis and normalized to the number of SKHep1 WT cells. Then ratios of α-ketoglutarate (αKG) to glutamate in SKHep1 WT cells transfected with siLuci (gray) or siGLS2 (red) (for 48 hours) were calculated. H-I, SKHep1 WT cells were transfected with either control (siLuci) or siGLS2 for 36 hours and then treated with erastin (5 μM) for 18 hours. α-ketoglutarate (αKG 10 mM) or glutamate (Glu 500 μM) was added to culture medium at the same time as erastin and then cell morphology (H) and viability (I) were determined. Bar graph in (I) depicts means ± SEM (n=4). *p < 0.05 versus siGLS2. J, Cell viability of HepG2 cells that were transfected with either control (siLuci) or siGLS2 for 36 hours and then treated with erastin (10 μM) for 30 hours. α-ketoglutarate (αKG 10 mM) or glutamate (Glu 500 μM) was added to culture medium at the same time as erastin. Bar graph in J depicts means ± SEM (n=6). **p < 0.01 versus siGLS2. K-L, SK Hep1 p53KO cells were transfected with Mock or GLS2 constructs for 24 hours and then cells were treated with DMSO, erastin (5 μM or 10 μM) alone, or erastin (5 μM or 10 μM) with AOA (5 mM) for 24 hours. Cell morphology (K) and cell viability (L) were assayed for these treated cells. Scale bar: 100 μm (in H and K). Bar graph in L depicts means ± SEM (n=4). *p < 0.05 versus GLS2. M-N, Cell viability of Hep3B cells that were transfected with Mock or GLS2 constructs for 24 hours and then cells were treated for 24 hours with either (M) DMSO or ferroptosis inducers (erastin 10 μM or RSL3 3 μM) or indicated ferroptosis inducer with AOA (10 mM) or (N) erastin (10 μM) in the absence or presence of the ferroptosis inhibitor (Fer-1 10 μM, Liproxstatin 2 μM or DFO 50 μM). Bar graphs in (M) and (N) depict means ± SEM (n=6). **p < 0.01, *p < 0.05 - versus GLS2 for (M) or versus erastin in (N).
Figure 5.
Figure 5.. GLS2 requires its core domain to promote ferroptosis and tumor suppression
A, Western blot analysis of GLS2 expression in SKHep1 p53KO cells transfected with p3×FLAG-CMV10-empty vector (Mock) or p3×FLAG-CMV10-hGLS2 vector (GLS2wt) or p3×FLAG-CMV10-hGLS2 177–463 deletion mutant vector (GLS2del). B, SKHep1 p53KO cells were transfected with Mock, GLS2wt, or GLS2del constructs for 48 hours and then oxygen consumption rate (OCR) as recorded using a flux analyzer. The OCR was measured at baseline and after treatment with oligomycin, FCCP, and a mixture of antimycin and rotenone. C, SKHep1 p53KO cells were transfected with Mock, GLS2wt or GLS2del constructs for 24 hours and then treated with erastin (5 μM) for 24 hours to assay changes in cell viability. Bar graph depicts means ± SEM (n=4). *p < 0.05 versus GLS2wt. D, Xenograft tumors were obtained by subcutaneously injecting SKHep1 p53 KO cells that were transfected with either the GLS2wt lentivirus vector or CSII-EF-RfA-IRES2-Venus-empty vector (Mock) into SCID mice. Injections of indicated lentiviral vectors were performed on the right and left flanks of the same SCID mice. GFP expressed by the indicated lentivirus vectors was measured using the IVIS imaging system. E, Top panel- Representative macroscopic findings of the results of the procedure shown in (D). Bottom panel- Volume of subcutaneous tumors obtained 6 weeks after injection of SKHep1 p53KO cells treated with Mock lentivirus vector on the left flank and either GLS2wt (left panel) or hGLS2del (right panel) on the right flank in SCID mice (n=3). F, RT-qPCR analysis of ferroptosis markers, Ptgs2 and Chac1 expression in subcutaneous tumors shown in (E). G, Representative macroscopic findings and volume measurements of subcutaneous tumors in SCID mice (n=4) that were obtained 6 weeks after injection of SKHep1 p53 KO cells treated with left panel- GLS2wt (left flank) and GLS2wt with ferroptosis inhibitor Fer-1 (right flank) and right panel- Mock lentivirus vector (left flank) and Mock with Fer-1 (right flank). H, RT-qPCR analysis of ferroptosis marker, Ptgs2 expression in subcutaneous tumors shown in (G). I, Representative macroscopic findings and volume measurements of subcutaneous tumors obtained 6 weeks after injection of SKHep1 cells treated with shGLS2 or shGLS1 (right flank; n = 4) and shCont lentivirus vector (left flank; n = 5). Bar graph in C, E-I depicts means ± SEM. *p < 0.05.
Figure 6.
Figure 6.. GLS2 expression levels are decreased in both mice and human HCC and these levels are correlated with malignancy and poor prognosis
A, RT-qPCR analysis of Gls2 expression in liver tissues from HCC stages (22 weeks, n=6) compared to normal stage (6 weeks, n=5) in STAM generated from wild-type mice (WT-STAM). Bar graph depicts means ± SEM *P < 0.05 versus the normal stage. B, Western blot analysis of Gls2 or p53 (Ab3) protein expression in the liver from HCC and normal stages in WT-STAM mice. C, Immunohisto-chemical analysis of Gls2 and p53 (Pab240) in liver from WT-STAM, mice containing HCC and non-HCC regions. D, GLS2, PTGS2, GLS1 or p53 mRNA expression levels in human HCC samples (HCC) compared to normal liver tissues (Normal) were assessed using the Cancer Genome Atlas (TCGA) database and the GDC portal (https://portal.gdc.cancer.gov/). E, The numbers of HCC or normal samples from patients in TCGA database were categorized based on GLS2 expression levels as GLS2 low (below the median) or GLS2 high (over the median). F, PTGS2 mRNA expression level was assessed in GLS2 low or GLS2 patients. G-H, Clinical (age at initial pathological diagnosis in G) and pathological data (histological grades; G1, G2, G3 or G4 in H) in human HCC according to GLS2 low (n=205) and GLS2 high (n=205) were extracted from TCGA. I, Kaplan-Meier analyses were performed using KM-plotter database (kmplot.com/analysis/). The graph represents survival curves of patients stratified according to GLS2 low (black) and GLS2 high (red) in human HCC, lung cancer and breast cancer samples. J, Catalogue of Somatic Mutations in Cancer (COSMIC) analysis in 3256 samples of human hepatocellular carcinoma. The mutation subtypes of GLS2 from the COSMIC database are shown. Number of mutations for each subtype is shown in parentheses.

References

    1. Yang L, Venneti S, Nagrath D. Glutaminolysis: A Hallmark of Cancer Metabolism. Annu Rev Biomed Eng. 2017;19:163–94. - PubMed
    1. Lamonte G, Tang X, Chen JL, Wu J, Ding CK, Keenan MM, et al. Acidosis induces reprogramming of cellular metabolism to mitigate oxidative stress. Cancer Metab. 2013;1(1):23. - PMC - PubMed
    1. Araujo L, Khim P, Mkhikian H, Mortales CL, Demetriou M. Glycolysis and glutaminolysis cooperatively control T cell function by limiting metabolite supply to N-glycosylation. Elife. 2017;6. - PMC - PubMed
    1. Chung-Bok MI, Vincent N, Jhala U, Watford M. Rat hepatic glutaminase: identification of the full coding sequence and characterization of a functional promoter. Biochem J. 1997;324 ( Pt 1)(Pt 1):193–200. - PMC - PubMed
    1. Gao P, Tchernyshyov I, Chang TC, Lee YS, Kita K, Ochi T, et al. c-Myc suppression of miR-23a/b enhances mitochondrial glutaminase expression and glutamine metabolism. Nature. 2009;458(7239):762–5. - PMC - PubMed

Publication types