. 2022 Jul 29;8(30):eabm6815.
doi: 10.1126/sciadv.abm6815. Epub 2022 Jul 27.

CMOS electrochemical pH localizer-imager

Affiliations

CMOS electrochemical pH localizer-imager

Han Sae Jung et al. Sci Adv. .

Abstract

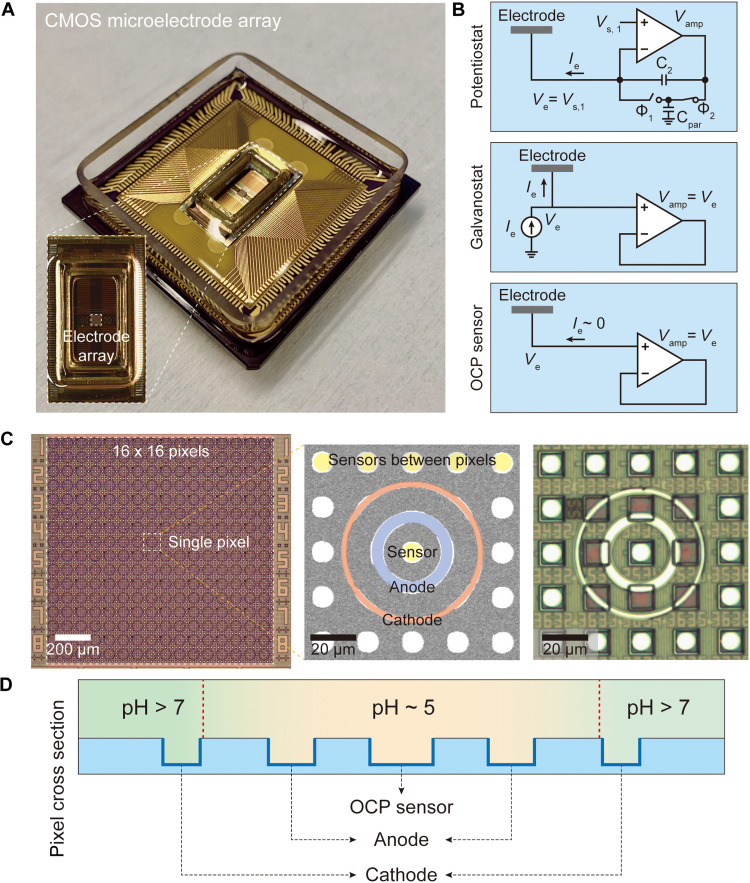
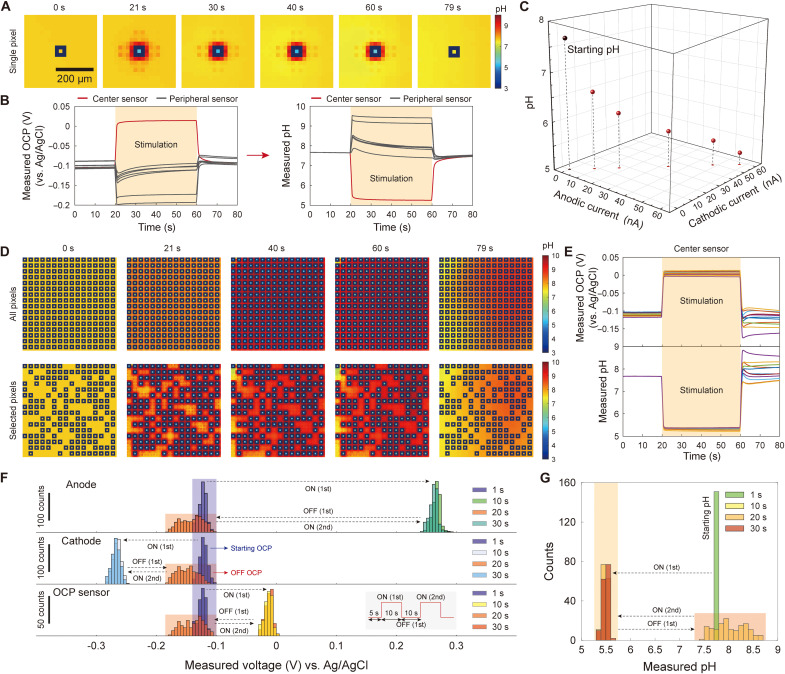
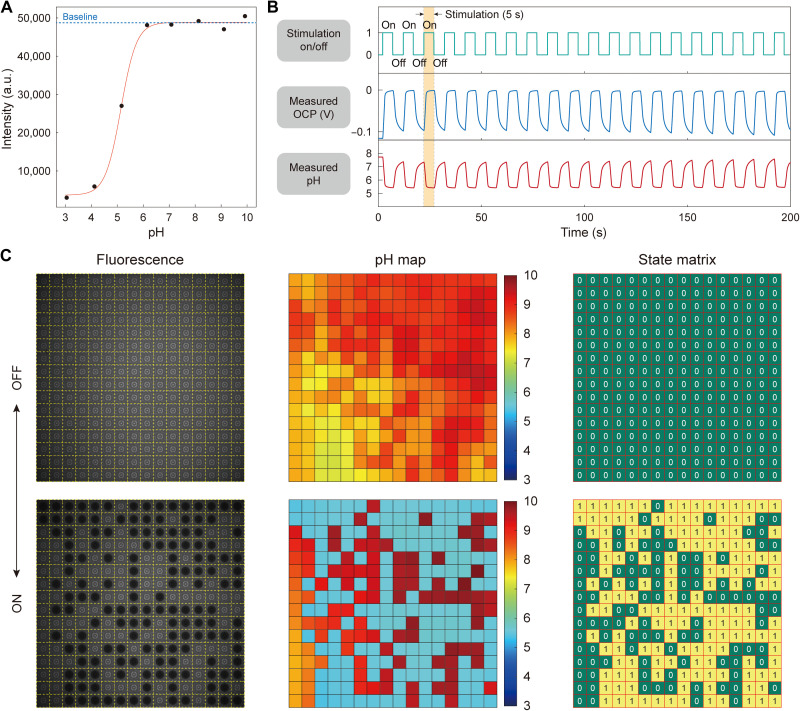
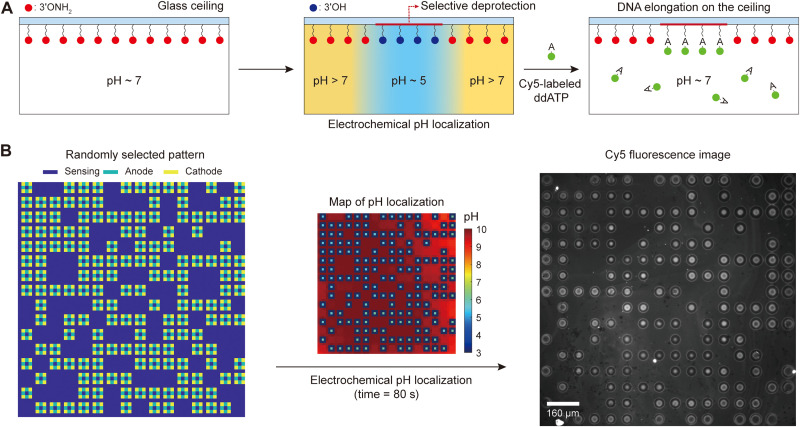
pH controls a large repertoire of chemical and biochemical processes in water. Densely arrayed pH microenvironments would parallelize these processes, enabling their high-throughput studies and applications. However, pH localization, let alone its arrayed realization, remains challenging because of fast diffusion of protons in water. Here, we demonstrate arrayed localizations of picoliter-scale aqueous acids, using a 256-electrochemical cell array defined on and operated by a complementary metal oxide semiconductor (CMOS)-integrated circuit. Each cell, comprising a concentric pair of cathode and anode with their current injections controlled with a sub-nanoampere resolution by the CMOS electronics, creates a local pH environment, or a pH "voxel," via confined electrochemistry. The system also monitors the spatiotemporal pH profile across the array in real time for precision pH control. We highlight the utility of this CMOS pH localizer-imager for high-throughput tasks by parallelizing pH-gated molecular state encoding and pH-regulated enzymatic DNA elongation at any selected set of cells.


Figures

Fig. 1.
Fig. 1.. CMOS electrochemical cell array.
(A) Image of the packaged CMOS IC featuring a predefined array of 64 × 64 = 4096 Al pads. (B) The CMOS circuit connected to each Al pad can be configured into one of the three modes: potentiostat, galvanostat, and OCP sensor. (C) Pt electrodes are postfabricated on top of the predefined Al pad array, resulting in an array of 16 × 16 = 256 electrochemical cells or pixels. Each pixel consists of an inner anodic Pt ring electrode connected to a set of four underlying Al pads, an outer cathodic Pt ring electrode connected to another set of four underlying Al pads, and a center OCP sensor with a circular Pt electrode connected to one underlying Al pad. In addition, circular Pt electrodes (with each connected to one underlying Al pad) are postfabricated in between pixels to be used as additional OCP sensors. A scanning electron microscope image and an optical image of a pixel and its surrounding are shown in the middle and at the right, respectively. (D) In any given pixel, if both of its two concentric rings are operated in the galvanostat mode with the outer cathodic ring with a negative current injection and the inner anodic ring with a positive current injection, the base generated by the former serves as an electrochemical wall that confines the protons electrochemically generated by the latter.
Fig. 2.
Fig. 2.. pH manipulation with quinone chemistry and proton diffusion.
(A) Illustration of redox reactions of DMHQ or H2Q for brevity and DMBQ (or Q). The oxidation reaction generates protons, while the reduction reaction generates quinone dianions (Q2−), which serve as base. (B) OCP versus pH calibration. The OCP measured by our OCP sensors with the circular Pt electrodes has a linear relationship to pH with an experimentally determined sensitivity of −49.7 ± 1.4 mV/pH. This calibration was conducted by measuring OCP of various pH buffer solutions. Only the slope of this calibration line is used in converting OCP to pH (for details, see Materials and Methods). (C) Cyclic voltammogram at a single circular Pt electrode (which in this case is used not in the OCP sensing mode but in the potentiostat mode) with a scan range from −0.6 to 0.5 V and a scan rate of 20 mV/s. (D) A positive current is injected into the anodic ring around pad “3434” (i.e., the Al pad located at row 34 and column 34), with the results presented in parts (E) and (F). (E) The OCP measured with the OCP sensor at pad 3434 (left) and its conversion to pH (right) using the calibration result of part (B) (see Materials and Methods). (F) Spatiotemporal pH imaging during the stimulation of the single anodic ring around pad 3434. The temporal evolution of the pH heatmap shows a radial diffusion of protons generated by the anodic stimulation. The ceiling height is about 39 μm.
Fig. 3.
Fig. 3.. Array-wide pH localization.
(A) pH localization at a single concentric pixel. (B) OCP and pH measured with the OCP sensor at the center of the pixel of part (A) (red line) and peripheral OCP sensors (gray lines). (C) By altering the magnitude of anodic and cathodic currents in optimal ratio 1:−1, the localized pH value can be tuned. (D) Array-wide pH localization for all 256 pixels (top) and selected pixels (bottom). (E) OCP and corresponding pH measured at centers of randomly sampled pixels in the experiment of (D), top. (F) Distributions of measured potentials at anodes, cathodes, and pixel center OCP sensors during application of two sets of anodic and cathodic current pulses at all 256 pixels. Bin size = 5 mV. The distribution of the measured potentials for each electrode type remains almost identical from the first pulse to the second pulse, indicating that concentration overpotentials do not develop during the stimulation. The absence of concentration overpotentials indicates that the redox species (i.e., quinones) are not depleted, enabling a repeatable pH control. (G) pH converted version of the bottom of (F), i.e., distribution of localized pH values measured at pixel center OCP sensors during the current pulse stimulation. Bin size = 0.1. The distribution of localized pH values remains almost identical from the first pulse to the second pulse. The ceiling height is about 39 μm throughout the figure.
Fig. 4.
Fig. 4.. Parallelizing pH-gated molecular state encoding.
(A) Epifluorescence intensity versus pH for an aqueous fluorescein solution (10 μM). (B) On-chip measured pixel-center OCP and pH as a function of time in an example stimulated pixel. (C) Epifluorescence imaging and on-chip pH imaging juxtaposed side by side (left and middle). In each of the pixels selected for stimulation, an appreciable fraction of fluorescein molecules enter state “1” every time acidic pH voxels are formed (e.g., pH 5.54 converts approximately 20% to state 1), while nearly all molecules are left in state 0 in each of the unstimulated pixels. In the state matrix (right), matrix element 1 refers to a pixel’s collective status where an appreciable fraction of fluorescein molecules are in state 1, whereas matrix element 0 refers to the status where nearly all molecules are in state 0. The ceiling height is about 14 μm. a.u., arbitrary units.
Fig. 5.
Fig. 5.. Parallelizing pH-regulated enzymatic incorporation of nucleotides (ddATP) onto single-stranded DNA molecules.
(A) Schematic illustration of pH-regulated enzymatic incorporation of nucleotides to substrate DNA molecules on a glass ceiling with spatioselectivity. Localized pH control induces a spatioselective deprotection of DNA strands. These deprotected strands can then be enzymatically elongated with Cy5-labeled ddATP nucleotides in parallel. The ceiling height is about 14 μm. (B) After parallelized enzymatic incorporation of Cy5-labeled ddATP to spatioselectively deprotected sites, epifluorescence imaging shows that the Cy5 fluorescence pattern (right) matches the randomly selected current stimulation pattern (left) exactly, thus confirming the enzymatic incorporation of nucleotides at the spatioselectively deprotected sites. The pH map at the midpoint of the 80-s-long stimulation is shown in the middle.

References

    1. Thomas P. G., Russell A. J., Fersht A. R., Tailoring the pH dependence of enzyme catalysis using protein engineering. Nature 318, 375–376 (1985).
    1. Liu Q., Chen L., Zhang Z., Du B., Xiao Y., Yang K., Gong L., Wu L., Li X., He Y., pH-dependent enantioselectivity of d-amino acid oxidase in aqueous solution. Sci. Rep. 7, 2994 (2017). - PMC - PubMed
    1. Ludwig M.-G., Vanek M., Guerini D., Gasser J. A., Jones C. E., Junker U., Hofstetter H., Wolf R. M., Seuwen K., Proton-sensing G-protein-coupled receptors. Nature 425, 93–98 (2003). - PubMed
    1. Bullough P. A., Hughson F. M., Skehel J. J., Wiley D. C., Structure of influenza haemagglutinin at the pH of membrane fusion. Nature 371, 37–43 (1994). - PubMed
    1. Stegmann T., Booy F. P., Wilschut J., Effects of low pH on influenza virus. Activation and inactivation of the membrane fusion capacity of the hemagglutinin. J. Biol. Chem. 262, 17744–17749 (1987). - PubMed