. 2022 Jul 27;14(655):eabp8869.
doi: 10.1126/scitranslmed.abp8869. Epub 2022 Jul 27.

Association of a common genetic variant with Parkinson's disease is mediated by microglia

Affiliations

Association of a common genetic variant with Parkinson's disease is mediated by microglia

Rebekah G Langston et al. Sci Transl Med. .

Abstract

Studies of multiple neurodegenerative disorders have identified many genetic variants that are associated with risk of disease throughout a lifetime. For example, Parkinson's disease (PD) risk is attributed in part to both coding mutations in the leucine-rich repeat kinase 2 (LRRK2) gene and to a common noncoding variation in the 5' region of the LRRK2 locus, as identified by genome-wide association studies (GWAS). However, the mechanisms linking GWAS variants to pathogenicity are largely unknown. Here, we found that the influence of PD-associated noncoding variation on LRRK2 expression is specifically propagated through microglia and not by other cell types that express LRRK2 in the human brain. We find microglia-specific regulatory chromatin regions that modulate the LRRK2 expression in human frontal cortex and substantia nigra and confirm these results in a human-induced pluripotent stem cell-derived microglia model. We showed, using a large-scale clustered regularly interspaced short palindromic repeats interference (CRISPRi) screen, that a regulatory DNA element containing the single-nucleotide variant rs6581593 influences the LRRK2 expression in microglia. Our study demonstrates that cell type should be considered when evaluating the role of noncoding variation in disease pathogenesis and sheds light on the mechanism underlying the association of the 5' region of LRRK2 with PD risk.


Conflict of interest statement

Competing interests

Authors declare no competing interests.

Figures

Fig. 1.
Fig. 1.. Genotype at rs76904798 is correlated with microglial LRRK2 expression in human brain.
(A) Schematic depiction of experimental workflow. Nuclei isolated from human frontal cortex were subjected to single nuclei RNAseq (snRNAseq) and single nuclei ATACseq (snATACseq) analyses. Induced pluripotent stem cells (iPSC) generated from patient-derived peripheral blood mononuclear cells (PBMC) were differentiated to microglias (iMicroglia) and evaluated by single cell RNA sequencing (scRNAseq), bulk ATAC sequencing, and western blot and qRT-PCR assays following perturbations including a lysosome damaging treatment and CRISPR/Cas-directed genome manipulation. (B) UMAP visualization of cell clusters identified in an integrated snRNAseq dataset from 15 human frontal cortex samples, labeled by differential expression of cell type marker genes, with 113,520 nuclei represented. (C) LRRK2 expression in brain cell populations, grouped according to broad cell type (excitatory neuron, ExN; inhibitory neuron, InN; oligodendrocyte, ODC; oligodendrocyte precursor cell, OPC; vascular cell, VC; astrocyte, AST; microglia, MGL) and relative abundance of that cell population in the overall dataset. (D) Violin plot showing the distribution of LRRK2 expression in cell population MGL.13 by genotype at rs76904798. (E) Boxplot where each point represents the average LRRK2 expression in MGL.13 in each of the 15 donors where the number of minor alleles correlates with expression (Pearson’s R = 0.598; p = 0.019, t = 2.69, df = 13). Plots in (F) and (G) show the equivalent analyses for cell population ExN.17, Pearson’s R = −0.103 (p = 0.714, t = −0.37, df = 13). ****P<0.0001.
Fig. 2.
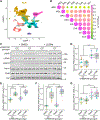
Fig. 2.. iMicroglia carrying PD risk haplotype captured by rs76904798-T have increased LRRK2 protein and activity.
(A) UMAP visualization of iMicroglia scRNAseq integrated with human frontal cortex snRNAseq and clusters labeled according to broad cell type (excitatory neuron, ExN; inhibitory neuron, InN; oligodendrocyte, ODC; oligodendrocyte precursor cell, OPC; vascular cell, VC; astrocyte, AST; microglia, MGL; iPSC-derived microglia, iMGL. (B) Matrix of correlation between average expression of 31,133 transcripts between iMGL and brain cells by Pearson’s correlation coefficient. For iMGL vs MGL, R = 0.741,t = 194.89 df = 31,131, p < 2.22 × 10⁻¹⁶. (C) Western blot analysis of a pair of differentiated iMicroglia, PPMI 3411 (rs76904798-CC) and PPMI 3953 (rs76904798-CT) immunoblotting for phospho-Ser935-LRRK2, total LRRK2, phospho-Rab10, total Rab10, cyclophilin b (CypB) and Iba1 −/+ 15-minute LLOMe treatment. (D-G) Quantifications of normalized mRNA or protein, shown relative to the mean values for each of six experiments with technical replicates averaged prior to statistical analysis. Tukey’s multiple comparisons test from Two-way ANOVA between treatment groups are shown where statistically significant. **P<0.01, ****P<0.0001.
Fig. 3.
Fig. 3.. Chromatin in the LRRK2 region is differentially accessible in brain microglia in human frontal cortex (FCtx) and human substantia nigra (SN).
(A) UMAP visualization of cell populations identified in twelve FCtx samples by snATACseq containing 38,474 nuclei. (B) Chromatin landscape of the LRRK2 promoter region representing accessibility of FCtx cells within each cluster. (C) Illustration of single nuclei Multiome sequencing (snMulti-seq) to generate ATAC and gene expression (GEX) libraries from the same nuclei. (D) UMAP visualization of cell populations for snMulti-seq in the SN, with a total of 8,001 nuclei represented. (E) Chromatin accessibility in the LRRK2 promoter region in SN cell types, with a violin plot showing the distribution of LRRK2 RNA expression in the same nuclei. In both (B) and (E) significantly accessible regions are indicated by bars. Asterisks indicate the cell types in which differentially increased accessibility compared to all other cell types was observed at the peak overlapping the LRRK2 transcription start site (TSS), highlighted in red.
Fig. 4.
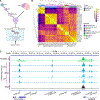
Fig. 4.. Chromatin architecture of iMicroglia resembles that of brain microglia in the LRRK2 region.
(A) Diagram illustrating the integrated analysis of bulk ATACseq of iMicroglia with snATACseq of human frontal cortex. (B) Heatmap showing differential peak counts for iPSC-derived or brain cell types, with hierarchical clustering of Pearson correlation values. For iMGLa vs FC-MGL.4, Pearson’s R = 0.820, df = 164,188, t = 579.49, p = 2.22 × 10⁻¹⁶. (C) Comparison of the chromatin landscape of the LRRK2 promoter region in brain microglia by snATACseq compared to iMicroglia and iFbn ATACseq using Integrative Genomics Viewer (71). Called peaks are represented by horizontal bars under each track. Locations of SNPs in high linkage disequilibrium with PD-risk SNP rs76904798 are shown. Dotted lines indicate the intersection of SNPs within peaks.
Fig. 5.
Fig. 5.. CRISPR/Cas editing single candidate PD risk SNPs does not alter LRRK2 expression in iMicroglia.
(A-B) Depictions of the guide RNA (gRNA) and donor templates used to make a Cas12a- or Cas9-directed single nucleotide substitution in the an iPSC line (genotype rs76904798-CC and rs1491942-CC), to produce edited iPSC lines with genotype rs76904798-TT or rs1491942-GG. IGV browser (72) view of the sequencing results are shown for the original PPMI cell line (“Parental”), a non-edited control (NEC) clone (“P1C9” or “P2B1”), and the correctly edited clone (“P2E6” or “P3C11”) used in differentiation experiments. (C) Western blot analysis of iMicroglia differentiated from the parental, edited, and NEC lines. Normalized quantifications of LRRK2 (D, F) and Iba1 (E, G) protein and LRRK2 (H, J) and AIF1 (I, K) mRNA are shown, N = 3–4 experiments with data points representing the average value of technical replicates. No significant differences in these measurements were detected by one-way ANOVA followed by Tukey’s multiple comparisons test.
Fig. 6.
Fig. 6.. Repression of the chromatin peak containing rs6581593 decreases LRRK2 expression in iMicroglia.
(A) Schematic of the CRISPRi screen workflow. iPSC constitutively expressing dCas9-KRAB were differentiated to iMicroglia, then transduced with a lentiviral-packaged sgRNA library containing sgRNA designed to tile across peaks of open chromatin in microglia that intersected known genetic variants. Transduced cells were labeled with CMOs, collected by FACS, and sc-gene expression (GEX), sgRNA, and CMO libraries sequenced. (B) pyGenomeTracks plot summarizing the results of repression across all guides directed at a single target genomic region. (C) pyGenomeTracks plot showing the results of repression at individual sgRNA binding sites. In the LRRK2 scaled expression track, the horizontal line represents the LRRK2 scaled expression in iMicroglia transduced with non-targeting control sgRNAs (sgNT). For the effect size track, the z test statistic is used to demonstrate the size of the effect of repression at each site. Statistical significance is represented by p value on a log scale; for guide measurements in (C), the dashed horizontal line indicates the statistically significant threshold after adjusting for multiple tests. (D) Peaks of open chromatin identified in frontal cortex microglia by snATACseq, with peak labels used for sgRNA library design shown. ENCODE candidate cis-regulatory elements (CREs) (E) as well as PD GWAS results (F) in the relevant region upstream of the LRRK2 gene are illustrated.

References

    1. Singleton A, Hardy J, A generalizable hypothesis for the genetic architecture of disease: pleomorphic risk loci. Hum. Mol. Genet 20, R158–162 (2011). - PMC - PubMed
    1. Cookson MR, The role of leucine-rich repeat kinase 2 (LRRK2) in Parkinson’s disease. Nat. Rev. Neurosci 11, 791–797 (2010). - PMC - PubMed
    1. Reed X, Bandrés-Ciga S, Blauwendraat C, Cookson MR, The role of monogenic genes in idiopathic Parkinson’s disease. Neurobiol. Dis 124, 230–239 (2019). - PMC - PubMed
    1. Nalls MA, Blauwendraat C, Vallerga CL, Heilbron K, Bandres-Ciga S, Chang D, Tan M, Kia DA, Noyce AJ, Xue A, Bras J, Young E, von Coelln R, Simón-Sánchez J, Schulte C, Sharma M, Krohn L, Pihlstrøm L, Siitonen A, Iwaki H, Leonard H, Faghri F, Gibbs JR, Hernandez DG, Scholz SW, Botia JA, Martinez M, Corvol J-C, Lesage S, Jankovic J, Shulman LM, Sutherland M, Tienari P, Majamaa K, Toft M, Andreassen OA, Bangale T, Brice A, Yang J, Gan-Or Z, Gasser T, Heutink P, Shulman JM, Wood NW, Hinds DA, Hardy JA, Morris HR, Gratten J, Visscher PM, Graham RR, Singleton AB, 23andMe Research Team, System Genomics of Parkinson’s Disease Consortium, International Parkinson’s Disease Genomics Consortium, Identification of novel risk loci, causal insights, and heritable risk for Parkinson’s disease: a meta-analysis of genome-wide association studies. The Lancet Neurology 18, 1091–1102 (2019). - PMC - PubMed
    1. Agarwal D, Sandor C, Volpato V, Caffrey TM, Monzón-Sandoval J, Bowden R, Alegre-Abarrategui J, Wade-Martins R, Webber C, A single-cell atlas of the human substantia nigra reveals cell-specific pathways associated with neurological disorders. Nature Communications 11 (2020). - PMC - PubMed

Publication types

MeSH terms

Substances