. 2022 Aug 3;39(8):msac152.
doi: 10.1093/molbev/msac152.

Evolutionary Genomics of a Subdivided Species

Affiliations

Evolutionary Genomics of a Subdivided Species

Takahiro Maruki et al. Mol Biol Evol. .

Abstract

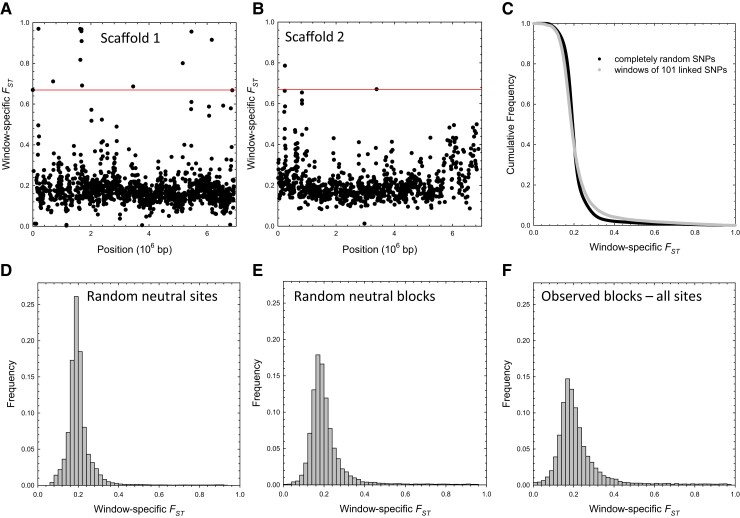
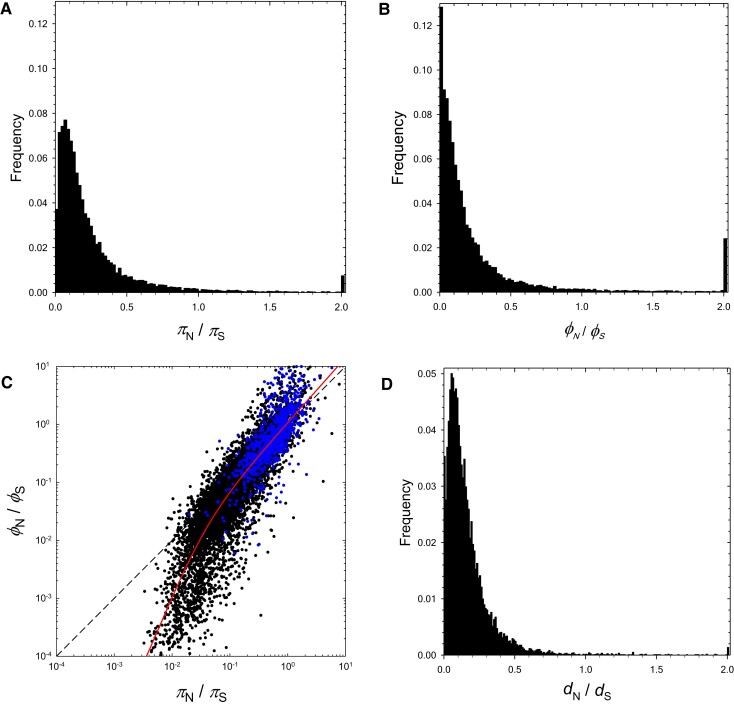
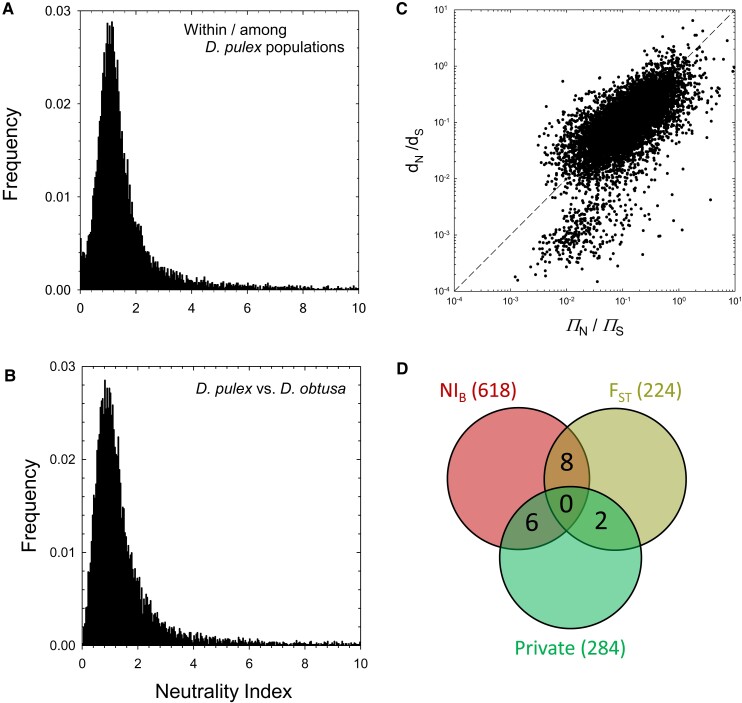
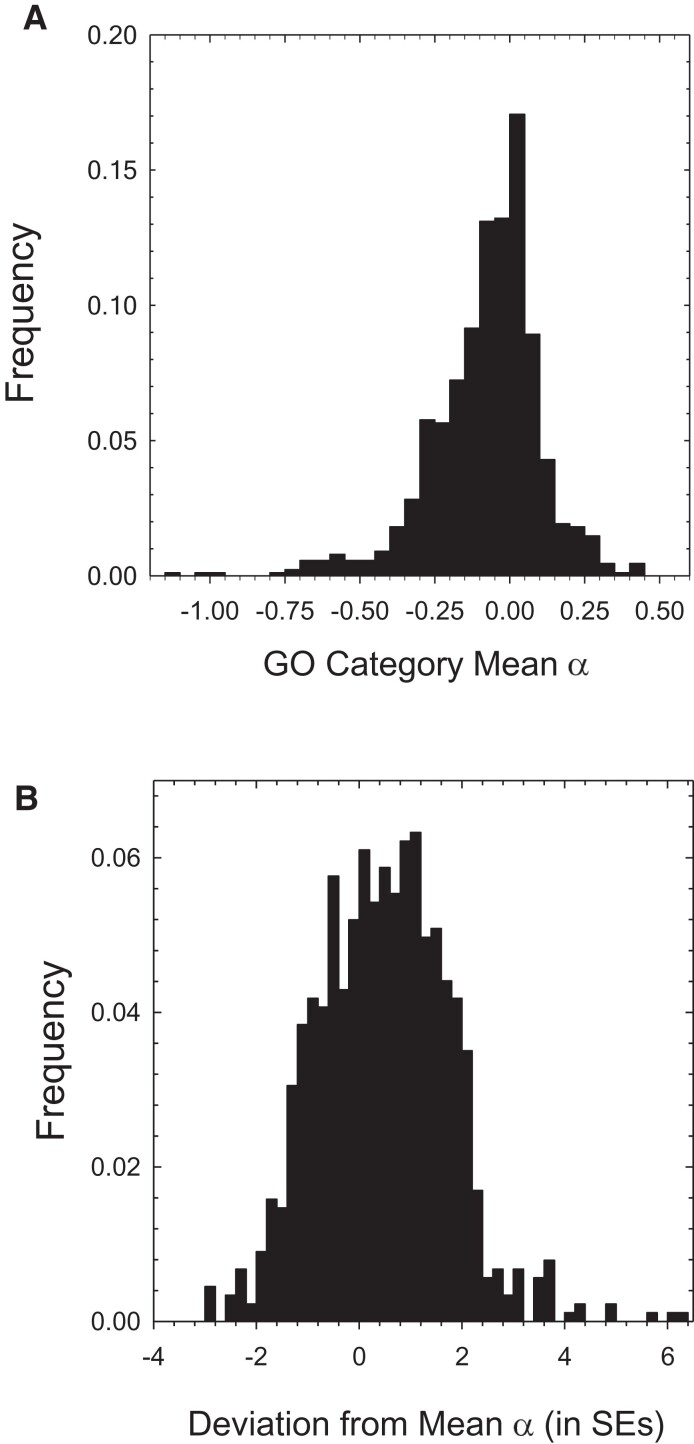
The ways in which genetic variation is distributed within and among populations is a key determinant of the evolutionary features of a species. However, most comprehensive studies of these features have been restricted to studies of subdivision in settings known to have been driven by local adaptation, leaving our understanding of the natural dispersion of allelic variation less than ideal. Here, we present a geographic population-genomic analysis of 10 populations of the freshwater microcrustacean Daphnia pulex, an emerging model system in evolutionary genomics. These populations exhibit a pattern of moderate isolation-by-distance, with an average migration rate of 0.6 individuals per generation, and average effective population sizes of ∼650,000 individuals. Most populations contain numerous private alleles, and genomic scans highlight the presence of islands of excessively high population subdivision for more common alleles. A large fraction of such islands of population divergence likely reflect historical neutral changes, including rare stochastic migration and hybridization events. The data do point to local adaptive divergence, although the precise nature of the relevant variation is diffuse and cannot be associated with particular loci, despite the very large sample sizes involved in this study. In contrast, an analysis of between-species divergence highlights positive selection operating on a large set of genes with functions nearly nonoverlapping with those involved in local adaptation, in particular ribosome structure, mitochondrial bioenergetics, light reception and response, detoxification, and gene regulation. These results set the stage for using D. pulex as a model for understanding the relationship between molecular and cellular evolution in the context of natural environments.

Keywords: Daphnia pulex; local adaptation; neutrality index; population genomics; population structure; population subdivision; private alleles; site-frequency spectrum.


Figures

Fig. 1.
Fig. 1.
Genome-wide heterozygosity estimates at sites in different functional categories. Intergenic sites are outside of untranslated regions (UTR), exons, and introns. Silent, replacement, and intron sites are, respectively, 4-fold redundant, 0-fold redundant and restricted intron (internal positions 8 to 34 from both ends; Lynch et al. 2017) sites. Tri- and tetra-allelic sites are excluded from the calculations, but make trivial contributions. The standard errors of the individual estimates are too small to visualize on the graph (6×10⁶ to 5×10⁵).
Fig. 2.
Fig. 2.
(A,B) Genome-wide distributions of the FIS and FST estimates, shown using bins of width 0.01. The results are based on 11,731,566 SNP sites with significant polymorphisms (determined by the ML allele-frequency estimator, using a 95% confidence cutoff level). The medians of the FIS and FST estimates are −0.01 and 0.08, respectively. (C) The profile of average FIS with respect to minor-allele frequency (MAF) class (standard errors denoted by the vertical bars), based on polymorphisms with maximum-likelihood MAF estimates significant at the 5% level. (D) The profile of average FST with respect to minor-allele frequency class (standard errors denoted by the vertical bars); dashed line is the statistical upper bound for FST obtained using equation (5) of Alcala and Rosenberg (2017).
Fig. 3.
Fig. 3.
Pairwise FST estimates and private-allele statistics. (A) Neighbor-joining tree based on pairwise FST. The letters in parentheses denote the US state/Canadian province abbreviation, with specific locations shown to the right; the scale bar is for the FST estimates. (B) The relationship of population-pairwise FST (for sites with MAF0.1) with geographic distance (results for amino-acid replacement and silent sites are given by the solid points/solid line and open points/dashed line, respectively). The results for both types of sites are very similar (SEs in parentheses): silent sites – intercept = 0.20 (0.02), slope = 0.0088 (0.0028), r2=0.429, P=0.0033; replacement sites – intercept = 0.20 (0.02), slope = 0.0095 (0.0027), r2=0.475, P=0.0010. (C) Conditional on the minor-allele frequency (MAF) in the entire metapopulation, the proportion of SNPs in each population that are private to the population and significantly more abundant than expected based on random sampling of a panmictic metapopulation. The plotted lines are the least-squares regressions for MAFs in the range of 0.02–0.10; the inset numbers denote the average frequencies of private alleles per population, and the total numbers of private alleles in each population that are significantly more frequent than expected by chance under a model of no subdivision.
Fig. 4.
Fig. 4.
(A) Site-frequency spectra at the metapopulation level, obtained by pooling samples from all populations, for various functional categories of genomic sites. The dashed lines denote the expected scaling of the SFS under neutrality for a single panmictic population. The heights of these curves are arbitrarily placed for visual comparison against the observed SFSs, showing that alleles with low to moderate frequencies are in excess of expectations relative to high-frequency alleles. (B) A comparison of silent- and intron-site SFSs at the metapopulation level with the average of the 10 within-population SFSs. Again, lines denote the neutral expectations, in this case for three effective population sizes (given the D. pulex mutation rate) under the assumption of single panmictic populations. The SFS at the metapopulation level is much more strongly bowed than that at the within-population level, which itself is less bowed than expected under the null model.
Fig. 5.
Fig. 5.
Window-specific genomic scans of FST, using sites with MAF0.1. (A,B) Example results for the two largest scaffolds; horizontal red lines denote Bonferroni-corrected cutoffs for the 0.05 probability level for upper outliers. (C) Cumulative frequency distribution of the window-specific estimates compared with the expectations based on random SNPs; the difference is a result of linkage disequilibrium (LD). (D) The genome-wide expected distribution for windows based on neutral (silent and intron) sites alone, under the assumption of global linkage equilibrium. (E) The empirical distribution obtained when only silent sites are used with linkage relationships retained. (F) The empirical distribution based on full sets of SNPs.
Fig. 6.
Fig. 6.
Distributions of the within- and among-population ratios πN/πS and ϕN/ϕS, and the between-species ratio over all protein-coding genes. In (A), (B), and (D), the final peaks to the right are the sums of all ratios exceeding 2.0. In (C), the black and blue points denote, respectively, genes with and without apparent orthologs in the outgroup D. obtusa, and the diagonal dashed line denotes points of equality. The red line is a least-squares fitted function: log(y)=0.028+[log(x)/(0.014+x)](0.025+1.12x); under this model, y=ϕN/ϕS scales with the 1.79 power of x=πN/πS when the latter is small, but with the 1.12 power when the latter is large, with the inflection point between the two scalings falling at πN/πS=0.014.
Fig. 7.
Fig. 7.
(A) The distribution of the metapopulation neutrality index, NIW, for the set of 11,623 protein-coding genes with sufficient coverage data from at least four D. pulex populations; not included in the graph are 5.1% of all genes with NIW10 (i.e., under strong purifying selection). (B) The distribution of the between-species neutrality index, NIB, for the set of 11,652 protein-coding genes with identifiable orthologs in D. obtusa; 3.0% of all genes have NIB10. (C) The relationship between dN/dS and ΠN/ΠS. (D) A Venn diagram of the outlier genes identified by three different methods.
Fig. 8.
Fig. 8.
(A) Distribution of the mean adaptive-evolution index (α) for 885 GO classes of genes. (B) Distribution of the 885 group-specific α estimates measured as a deviation from the mean of the overall distribution in A, each normalized by its sampling standard error.

References

    1. Thousand Genomes Project Consortium, Abecasis GR, Altshuler D, Auton A, Brooks LD, Durbin RM, Gibbs RA, Hurles ME, McVean GA. 2010. A map of human genome variation from population-scale sequencing. Nature 467:1061–1073. - PMC - PubMed
    1. Ackerman MS, Johri P, Spitze K, Xu S, Doak TG, Young K, Lynch M. 2017. Estimating seven coefficients of pairwise relatedness using population genomic data. Genetics 206:105–118. - PMC - PubMed
    1. Aeschbacher S, Selby JP, Willis JH, Coop G. 2017. Population-genomic inference of the strength and timing of selection against gene flow. Proc Natl Acad Sci USA. 114:7061–7066. - PMC - PubMed
    1. Agar WE. 1920. The genetics of a Daphnia hybrid during parthenogenesis. J Genet. 10:303–330.
    1. Akey JM, Zhang G, Zhang K, Jin L, Shriver MD. 2002. Interrogating a high-density SNP map for signatures of natural selection. Genome Res. 12:1805–1814. - PMC - PubMed

Publication types