. 2022 Sep 29;140(13):1533-1548.
doi: 10.1182/blood.2022016033.

Proteomic and phosphoproteomic landscapes of acute myeloid leukemia

Affiliations

Proteomic and phosphoproteomic landscapes of acute myeloid leukemia

Michael H Kramer et al. Blood. .

Abstract

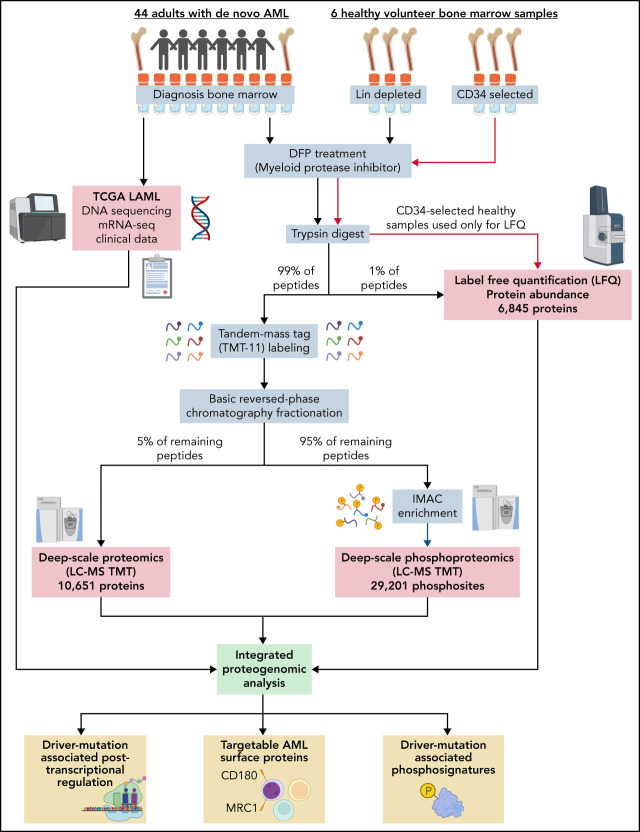
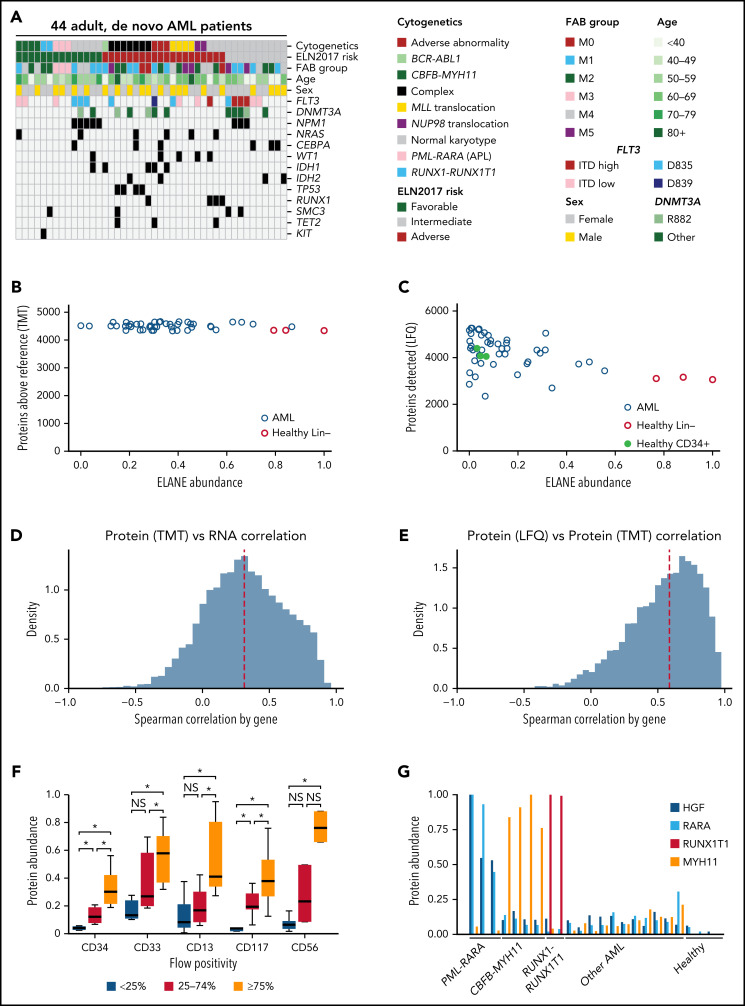
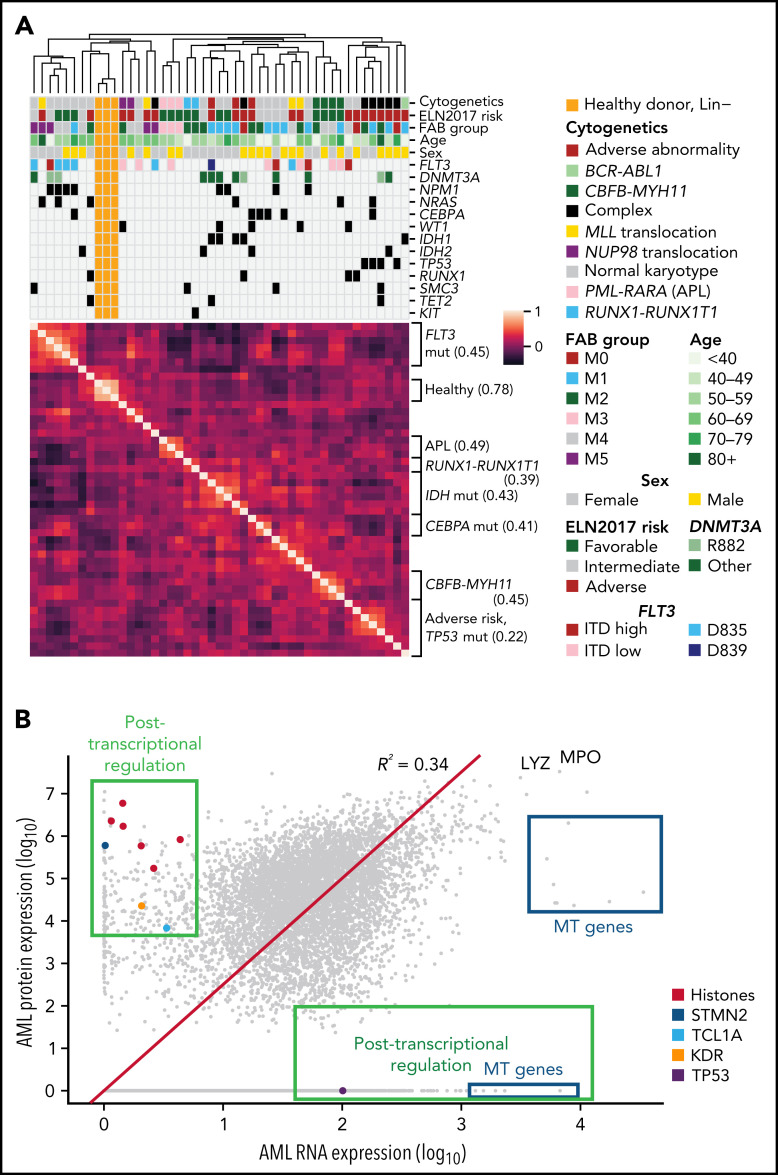
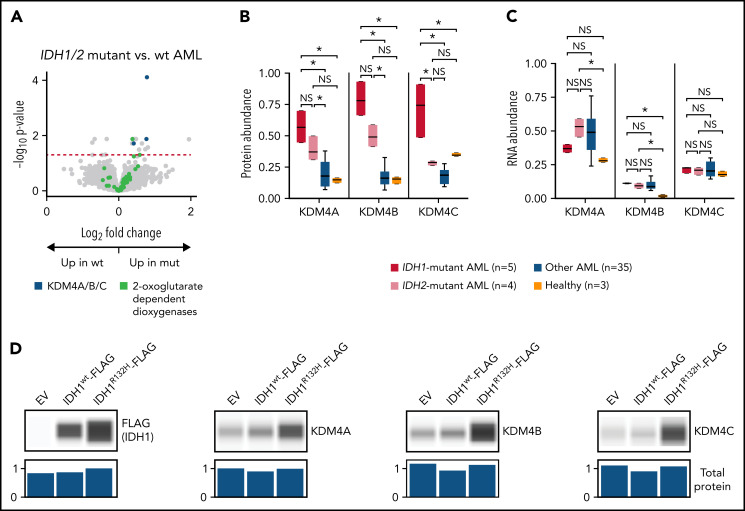
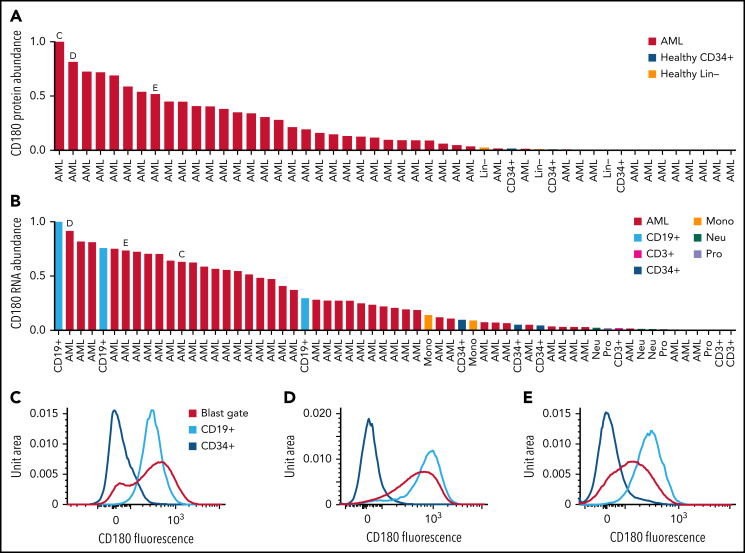
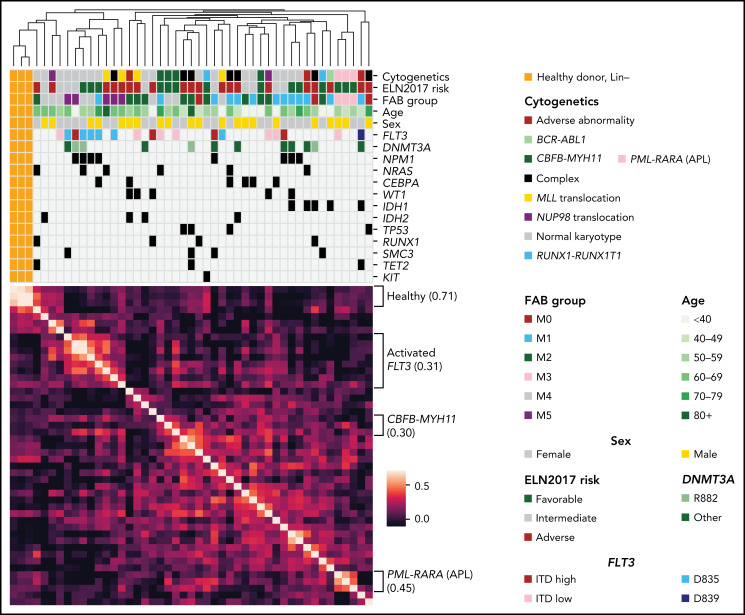
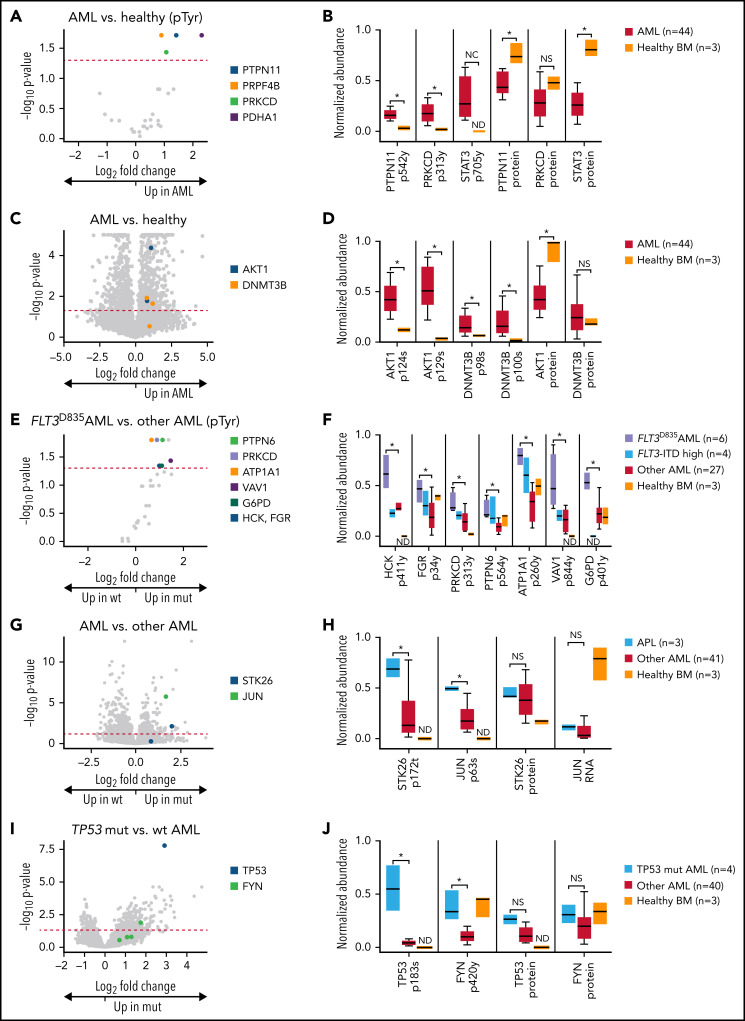
We have developed a deep-scale proteome and phosphoproteome database from 44 representative acute myeloid leukemia (AML) patients from the LAML TCGA dataset and 6 healthy bone marrow-derived controls. After confirming data quality, we orthogonally validated several previously undescribed features of AML revealed by the proteomic data. We identified examples of posttranscriptionally regulated proteins both globally (ie, in all AML samples) and also in patients with recurrent AML driver mutations. For example, samples with IDH1/2 mutations displayed elevated levels of the 2-oxoglutarate-dependent histone demethylases KDM4A/B/C, despite no changes in messenger RNA levels for these genes; we confirmed this finding in vitro. In samples with NPMc mutations, we identified several nuclear importins with posttranscriptionally increased protein abundance and showed that they interact with NPMc but not wild-type NPM1. We identified 2 cell surface proteins (CD180 and MRC1/CD206) expressed on AML blasts of many patients (but not healthy CD34+ stem/progenitor cells) that could represent novel targets for immunologic therapies and confirmed these targets via flow cytometry. Finally, we detected nearly 30 000 phosphosites in these samples; globally, AML samples were associated with the abnormal phosphorylation of specific residues in PTPN11, STAT3, AKT1, and PRKCD. FLT3-TKD samples were associated with increased phosphorylation of activating tyrosines on the cytoplasmic Src-family tyrosine kinases FGR and HCK and related signaling proteins. PML-RARA-initiated AML samples displayed a unique phosphorylation signature, and TP53-mutant samples showed abundant phosphorylation of serine-183 on TP53 itself. This publicly available database will serve as a foundation for further investigations of protein dysregulation in AML pathogenesis.


Figures

None
Graphical abstract
Figure 1.
Figure 1.
Characteristics of the AML patients in the study and data quality. (A) Relevant clinical parameters and common genetic findings in TCGA patients selected for this study. (B) Number of proteins detected at above-average abundance (greater than reference pool) for each patient or healthy donor sample compared with the normalized protein abundance of the neutrophil elastase (ELANE) serine protease in each sample (defined by TMT). Similar distributions were noted for the other abundant myeloid serine proteases (cathepsin G [CTSG] and proteinase 3 [PRTN3]). Note that high levels of ELANE are not correlated with reduced numbers of detected proteins, suggesting that tryptic peptides are not being cleaved by endogenous proteases during sample preparation. (C) Number of proteins detected for each sample compared with the normalized protein abundance of ELANE using label-free quantification (LFQ). (D-E) Distribution of gene-wise Spearman correlation between proteomic (TMT) and bulk RNA sequencing data (D) and between LFQ and TMT platforms (E). For both panels D and E, only genes quantifiable by both technologies in at least 20% of AML samples were included in the analysis. Dashed red lines represent median values. (F) Measured protein abundance (TMT) for each of the identified cell surface proteins in patients grouped by the percentage of cells from their presentation marrow sample that displayed the same respective marker using clinical flow cytometry. Protein abundance is calculated based on summed reporter ion intensity, which was normalized and median-centered across TMT plexes to a reference sample. Each protein expression value is then scaled to have a maximum value across all measured samples of 1, and a minimum value of 0, for this display. *P < .05 by 1-sided Mann-Whitney U test between groups. (G) Measured protein abundance (TMT) for each of 4 proteins known to be expressed in only 1 AML subtype. Shown are 3 AMLs with PML-RARA fusions, 4 with CBFB-MYH11 fusions, and 2 with RUNX1-RUNX1T1 fusions; 11 other representative AML samples and 3 healthy adult donor bone marrow samples are shown. HGF and RARA are overexpressed only in PML-RARA–initiated AML, MYH11 is overexpressed only in CBFB-MYH11 initiated AML, and RUNX1T1 is overexpressed only in RUNX-RUNX1T1 AML. ITD, internal tandem duplication; NS, not significant.
Figure 2.
Figure 2.
Protein expression levels are often correlated with clinical features and reveal evidence for posttranscriptional regulation. (A) Unsupervised clustering of proteomic profiles, revealing distinct clusters of samples, many of which correlate with known molecular covariates, including cytogenetic alterations, FAB subgroups, and recurrent mutations. The heatmap shows a Pearson correlation of protein expression levels among all patients using TMT proteomic measurements. Clustering was based on the unweighted pair group method with arithmetic mean algorithm, with similarity scores as shown in the heatmap. Brackets on the side of the heatmap indicate subgroups with shared clinical or molecular features; the value in parentheses indicates the mean Pearson correlation among members of that subgroup. (B) Mean log10 expression values of protein and RNA abundance for 7916 proteins measured in the bone marrow samples of 44 de novo, primary AML patients at time of diagnosis. RNA expression was quantified using transcripts per million from RNA sequencing after log10 transformation. Protein expression was measured using LFQ tandem mass spectrometry with normalized precursor ion intensities representing protein abundance after log10 transformation. The red line shows a line of best fit using linear regression with no intercept. Proteins displaying evidence for posttranscriptional regulation (high protein expression with low RNA expression or vice versa) are boxed in green and include the labeled histones H1-3, H1-4, H1-5, H2AC21, H3C1, and H3C15, as well as STMN2, the AKT co-activator/oncogene TCL1A, the protein tyrosine kinase receptor KDR, and the key tumor suppressor TP53. High protein, low RNA green box includes proteins with at least half of the maximal protein expression detected (log10 scale) and at most 15% of the maximal RNA expression. High RNA, low protein green box includes proteins with <25% of the maximal protein expression and at least median RNA expression. All proteins in the blue boxes are mitochondrially (MT) encoded and have lower-than-expected protein expression values as predicted by RNA expression. LYZ and MPO are known highly abundant proteins in myeloid cells. mut, mutant.
Figure 3.
Figure 3.
AML samples with IDH1/2 mutations are associated with increased abundance of KDM4A/B/C histone demethylases. (A) Volcano plot showing protein abundance in IDH1/IDH2-mutated vs wt AML samples. P values are calculated using the t test and corrected for multiple-hypothesis testing with the Benjamini-Hochberg method. Dashed red line shows P = .05. IDH1 and IDH2 mutations in AML cause dysregulation of 2-oxoglutarate metabolism, and KDM4A/B/C are some of the known 2-oxoglutarate–dependent dioxygenases. (B-C) Normalized abundance of KDM4A/B/C classified by IDH1/2 mutation status in TMT data (B) and bulk RNA sequencing (C). *P < .05 by t test between groups. (D) K562 cells were transfected in vitro with pcDNA3-EV, pcDNA3-FLAG-IDH1wt, or pcDNA3-FLAG-IDH1R132H plasmids and cultured for 2 days prior to cell lysis. Western blots show 1 of 3 representative biologic replicates using antibodies specific for the indicated proteins. Normalized total protein values as a loading control were calculated using the protein normalization module on the Jess western blotting system. EV, empty vector; mut, mutant; NS, not significant.
Figure 4.
Figure 4.
AML samples with the NPMc mutation are associated with increased abundance of several nuclear importins, and NPMc interacts directly with several family members. (A) Volcano plot showing protein abundance in NPM1-mutated vs wt AML samples. P values are calculated using the t test and corrected for multiple-hypothesis testing with Benjamini-Hochberg method. Dashed red line shows P = .05. (B-C) Normalized abundance of the nuclear importins organized by NPM1 mutation status in TMT data (B) and bulk RNA sequencing data (C). *P < .05 by t test between groups. (D) TurboID vectors were created with no fused complementary DNA (cDNA) (“TurboID only”) or fused at either the N or C terminus of wt NPM1 or mutant NPMc (T-NPM1 and T-NPMc indicate N-terminal fusions, whereas NPM1-T and NPMc-T indicate C-terminal fusions). Each vector was stably transduced into primary mouse hematopoietic stem/progenitor cells and, after 4 days, cultured in the presence of biotin for 4 hours. Biotin-labeled proteins were then enriched with streptavidin beads and stringently washed, and tryptic peptides were released from the beads and identified by mass spectrometry. Z-scores are calculated based on spectral counts across 10 TurboID-only biological replicates and 3 biological replicates for each of the other indicated vectors. The 30 interacting proteins with the greatest fold change for the NPM1-TurboID constructs are shown; all display significant differences (t test, multiple-hypothesis correction by Benjamini-Hochberg method with P < .05) from samples expressing TurboID only and NPMc-TurboID. Similarly, 30 proteins with the greatest fold change were selected for the NPMc-TurboID vector, and all displayed significant differences from both wt NPM1 and TurboID only. KPNA3 and KPNA4, 2 members of the nuclear importin family, are highlighted in green. (E) Spectral counts detected in the TurboID experiments for each of the displayed nuclear importins are normalized for display between 0 and 1. *P < .05 by t test between groups. N- and C-terminal TurboID constructs are analyzed together for the NPM1 and NPMc vectors. (F) Western blotting of protein abundance for the indicated proteins in cell lysates created from the stably transduced mouse bone marrow cells prior to streptavidin pulldown. Normalized total protein for each lane is shown as a loading control as determined on the Jess western blotting system. In this short-term expression system, the abundance of the nuclear importins is not increased, suggesting that the detection of interactions with NPMc is not due to an increase in total importin protein abundance. One representative example from 3 biologic replicates is shown. mut, mutant; NS, not significant.
Figure 5.
Figure 5.
CD180 and MRC1 are highly expressed on AML blasts from some patients but not on CD34 stem/progenitor cells. (A) Normalized protein abundance of CD180 in LFQ data for AML patient bone marrow samples, lineage-depleted bone marrow from healthy donors (Healthy Lin), and CD34-selected bone marrow from healthy donors (Healthy CD34+). (B) Normalized RNA abundance of CD180 in AML patient samples and the indicated cell types purified from healthy donor bone marrow samples. In both panels A and B, the letters C, D, and E indicate patient samples selected for flow cytometry as shown in the indicated panels. (C-E) Flow cytometry results with staining for CD180 on both AML cells in the blast gate and CD19+ B cells (cells that normally express CD180, as a positive control) in the indicated patient samples. Staining of CD34+ cells from healthy donor marrow is also shown. (F) Normalized protein abundance of MRC1 in LFQ data for AML patient bone marrow samples, lineage-depleted bone marrow cells from healthy donors (Healthy Lin), and CD34-enriched bone marrow cells from healthy donors (Healthy CD34+). (G) Normalized RNA abundance of MRC1 in AML patient samples, and the indicated cell types from healthy donor bone marrow, are shown. In both panels F and G, the letters H, I, and J indicate patient samples selected for flow cytometry and are shown in the indicated panels. (H-J) Flow cytometry results with staining for MRC on AML cells in the blast gate in the indicated patient samples. Staining of CD34+ cells and monocytes (cells that normally express MRC1, as a positive control) is shown from healthy donor marrow.
Figure 5.
Figure 5.
CD180 and MRC1 are highly expressed on AML blasts from some patients but not on CD34 stem/progenitor cells. (A) Normalized protein abundance of CD180 in LFQ data for AML patient bone marrow samples, lineage-depleted bone marrow from healthy donors (Healthy Lin), and CD34-selected bone marrow from healthy donors (Healthy CD34+). (B) Normalized RNA abundance of CD180 in AML patient samples and the indicated cell types purified from healthy donor bone marrow samples. In both panels A and B, the letters C, D, and E indicate patient samples selected for flow cytometry as shown in the indicated panels. (C-E) Flow cytometry results with staining for CD180 on both AML cells in the blast gate and CD19+ B cells (cells that normally express CD180, as a positive control) in the indicated patient samples. Staining of CD34+ cells from healthy donor marrow is also shown. (F) Normalized protein abundance of MRC1 in LFQ data for AML patient bone marrow samples, lineage-depleted bone marrow cells from healthy donors (Healthy Lin), and CD34-enriched bone marrow cells from healthy donors (Healthy CD34+). (G) Normalized RNA abundance of MRC1 in AML patient samples, and the indicated cell types from healthy donor bone marrow, are shown. In both panels F and G, the letters H, I, and J indicate patient samples selected for flow cytometry and are shown in the indicated panels. (H-J) Flow cytometry results with staining for MRC on AML cells in the blast gate in the indicated patient samples. Staining of CD34+ cells and monocytes (cells that normally express MRC1, as a positive control) is shown from healthy donor marrow.
Figure 6.
Figure 6.
Phosphoproteomic analysis of AML samples reveals associations with some initiating events and with FLT3 mutations. Unsupervised clustering of phosphoproteomic data from 44 AML samples and 3 healthy control bone marrow samples using the unweighted pair group method with arithmetic mean algorithm. The heatmap shows Pearson correlation of total phosphosite abundance between each patient. Clinical correlates are noted as in Figure 1.
Figure 7.
Figure 7.
Phosphoproteomic analyses of AML samples associated with specific mutations. (A) Volcano plot showing phosphorylated tyrosine sites in AML samples vs lineage-depleted bone marrow from healthy donors. P values are calculated using the Mann-Whitney U test and corrected for multiple-hypothesis testing with Benjamini-Hochberg method. Dashed red line shows P = .05. (B) Normalized abundance of selected tyrosine phosphosites with differences between AML and healthy samples, including the activating site tyrosine-546 on the phosphatase PTPN11/SHP2, the activating site tyrosine-313 on PRKCD, and the activating site tyrosine-705 on STAT3. Total protein abundance for all 3 proteins is shown as well, indicating that increased phosphorylation of these sites is not due to changes in overall protein abundance in AML samples. *P < .05 represent significantly different sites after multiple hypothesis correction as calculated in panel A. All sites were normalized to between 0 and 1 for display. (C) Volcano plot showing all phosphorylated sites in AML samples vs lineage-depleted bone marrow from healthy donors. P values are calculated using the t test and corrected for multiple-hypothesis testing with Benjamini-Hochberg method. Dashed red line shows P = .05. (D) Normalized abundance of selected phosphosites with differences between AML and healthy samples, including the serine-124 in the linker domain involved in optimal activation of AKT1 and multiple sites on DNMT3B of unknown function. Total protein abundance of AKT1 and DNMT3B are shown as well. *P < .05 after multiple-hypothesis correction as in panel C. (E) Volcano plot showing tyrosine phosphorylation sites comparing between FLT3D835-mutant AML samples and FLT3 wt AML samples as determined by 1-sided Mann-Whitney U test with multiple-hypothesis correction by Benjamin-Hochberg method. (F) Normalized abundance for each of the indicated phosphosites in the indicated patient groups. *P < .05 represents significantly different tyrosine phosphorylation sites between FLT3D835-mutant AML samples and FLT3 wt AML samples as determined in panel E. ND indicates a phosphosite was not detected in that group. Only FLT3-ITD samples with high variant allele frequency are shown. (G) Volcano plot showing differentially phosphorylated sites in samples initiated by PML-RARA (APL) vs other AML. P values are calculated using the t test and corrected for multiple-hypothesis testing with Benjamini-Hochberg method. (H) Normalized abundance of phosphorylated threonine-172 in the activation loop site on the kinase STK26 in APL vs other AML and healthy bone marrow. Total STK26 protein abundance is also shown. Normalized abundance of phosphorylation of the known activating site serine-63 on the transcription factor JUN in APL vs other AML and healthy bone marrow. Normalized abundance of JUN RNA is shown, since total JUN protein was below the limits of detection in this dataset. (I) Volcano plot showing differentially phosphorylated sites in TP53-mutant vs wt AML. P values are calculated using the t test and corrected for multiple-hypothesis testing with Benjamini-Hochberg method. (J) Abundance of the degradation related site serine-183 on TP53 and the activating site tyrosine-420 on FYN. NC, not calculable due to site being not detected in healthy samples; BM, bone marrow; ND, not detected; NS, not significant.

References

    1. Clark DJ, Dhanasekaran SM, Petralia F, et al. ; Clinical Proteomic Tumor Analysis Consortium . Integrated proteogenomic characterization of clear cell renal cell carcinoma [published correction appears in Cell. 2019;179(4):964–983.e31]. Cell. 2020;180(1): 207. - PMC - PubMed
    1. Dou Y, Kawaler EA, Cui Zhou D, et al. ; Clinical Proteomic Tumor Analysis Consortium . Proteogenomic characterization of endometrial carcinoma. Cell. 2020;180(4):729-748.e26. - PMC - PubMed
    1. Gillette MA, Satpathy S, Cao S, et al. ; Clinical Proteomic Tumor Analysis Consortium . Proteogenomic characterization reveals therapeutic vulnerabilities in lung adenocarcinoma. Cell. 2020;182(1): 200-225.e35. - PMC - PubMed
    1. Huang C, Chen L, Savage SR, et al. ; Clinical Proteomic Tumor Analysis Consortium . Proteogenomic insights into the biology and treatment of HPV-negative head and neck squamous cell carcinoma. Cancer Cell. 2021;39(3):361-379.e16. - PMC - PubMed
    1. Krug K, Jaehnig EJ, Satpathy S, et al. ; Clinical Proteomic Tumor Analysis Consortium . Proteogenomic landscape of breast cancer tumorigenesis and targeted therapy. Cell. 2020;183(5):1436-1456.e31. - PMC - PubMed

Publication types