. 2022 Sep 21;110(18):3000-3017.e8.
doi: 10.1016/j.neuron.2022.06.026. Epub 2022 Jul 26.

VMHvllCckar cells dynamically control female sexual behaviors over the reproductive cycle

Affiliations

VMHvllCckar cells dynamically control female sexual behaviors over the reproductive cycle

Luping Yin et al. Neuron. .

Abstract

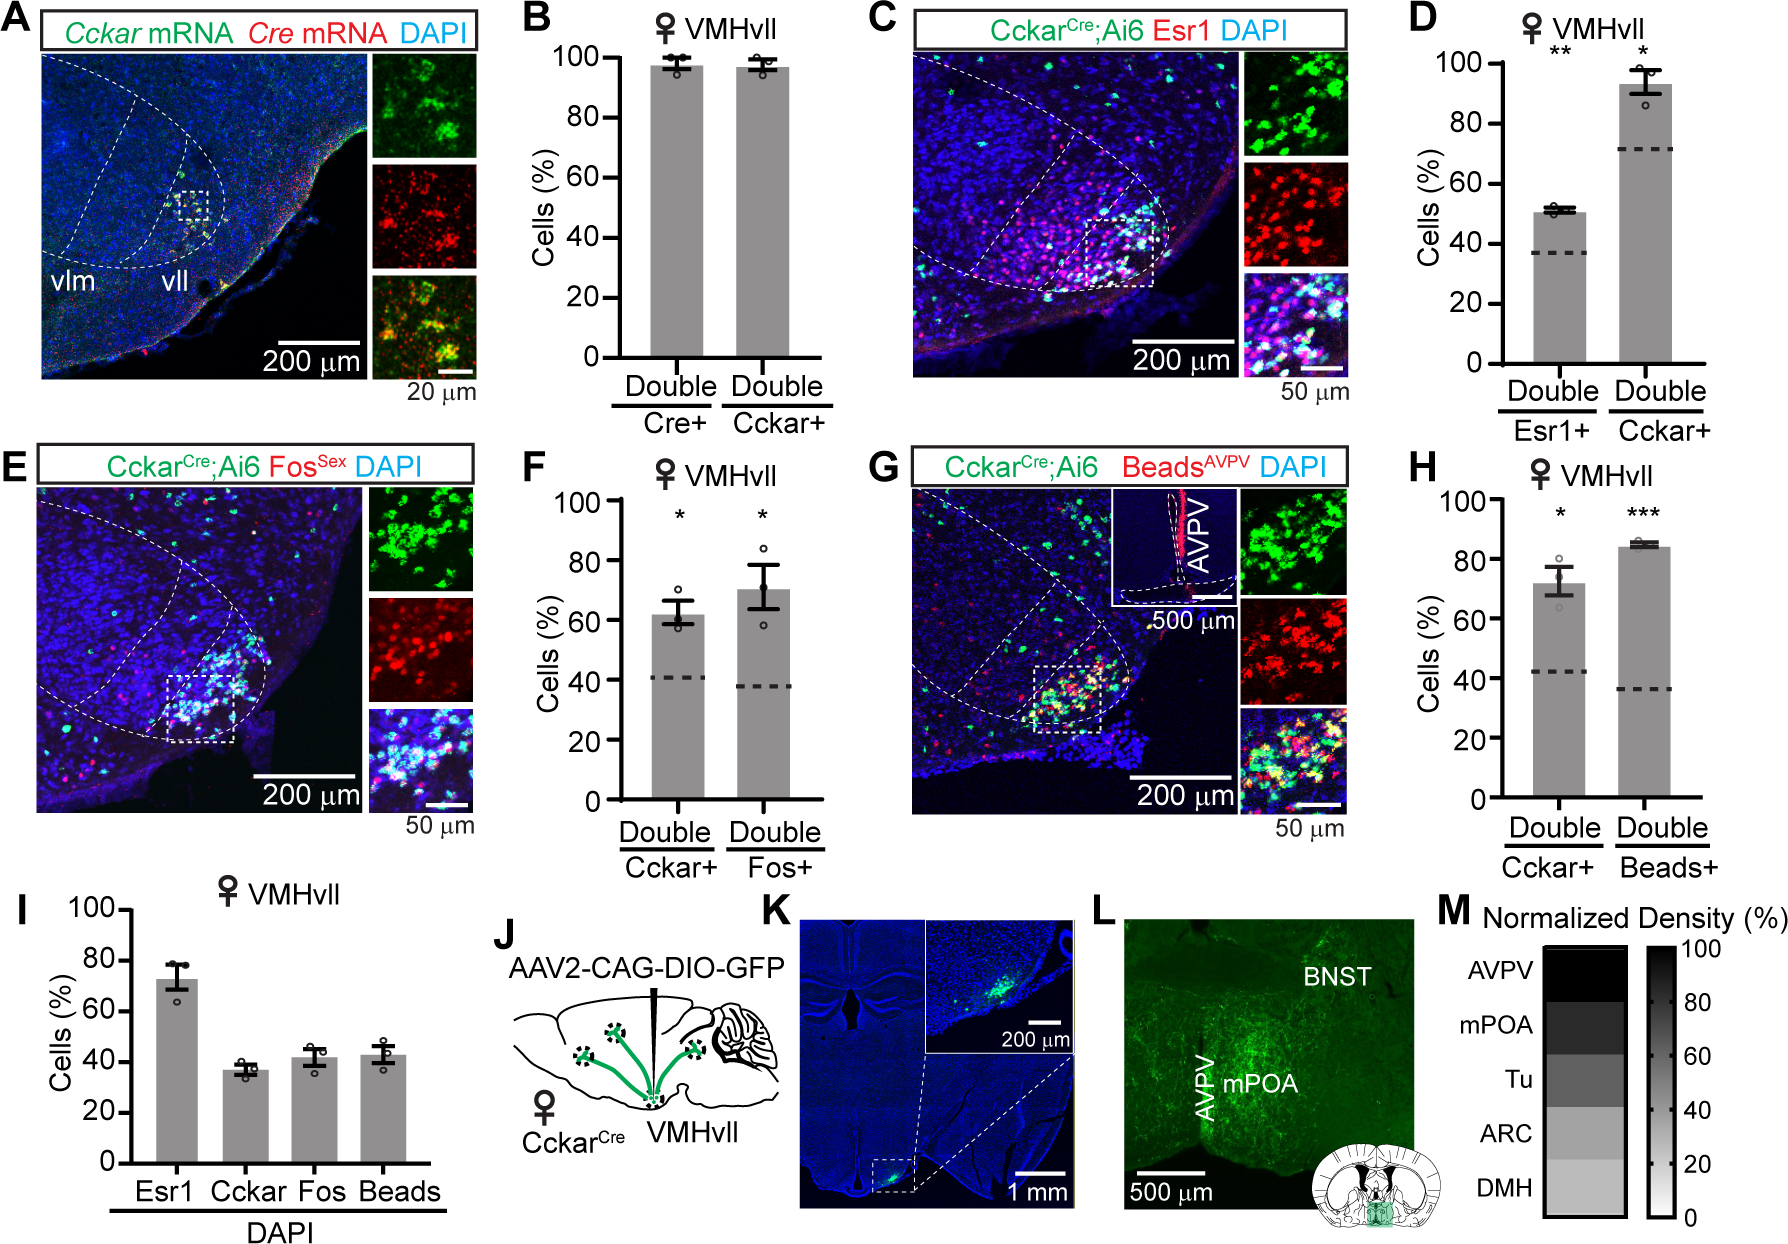
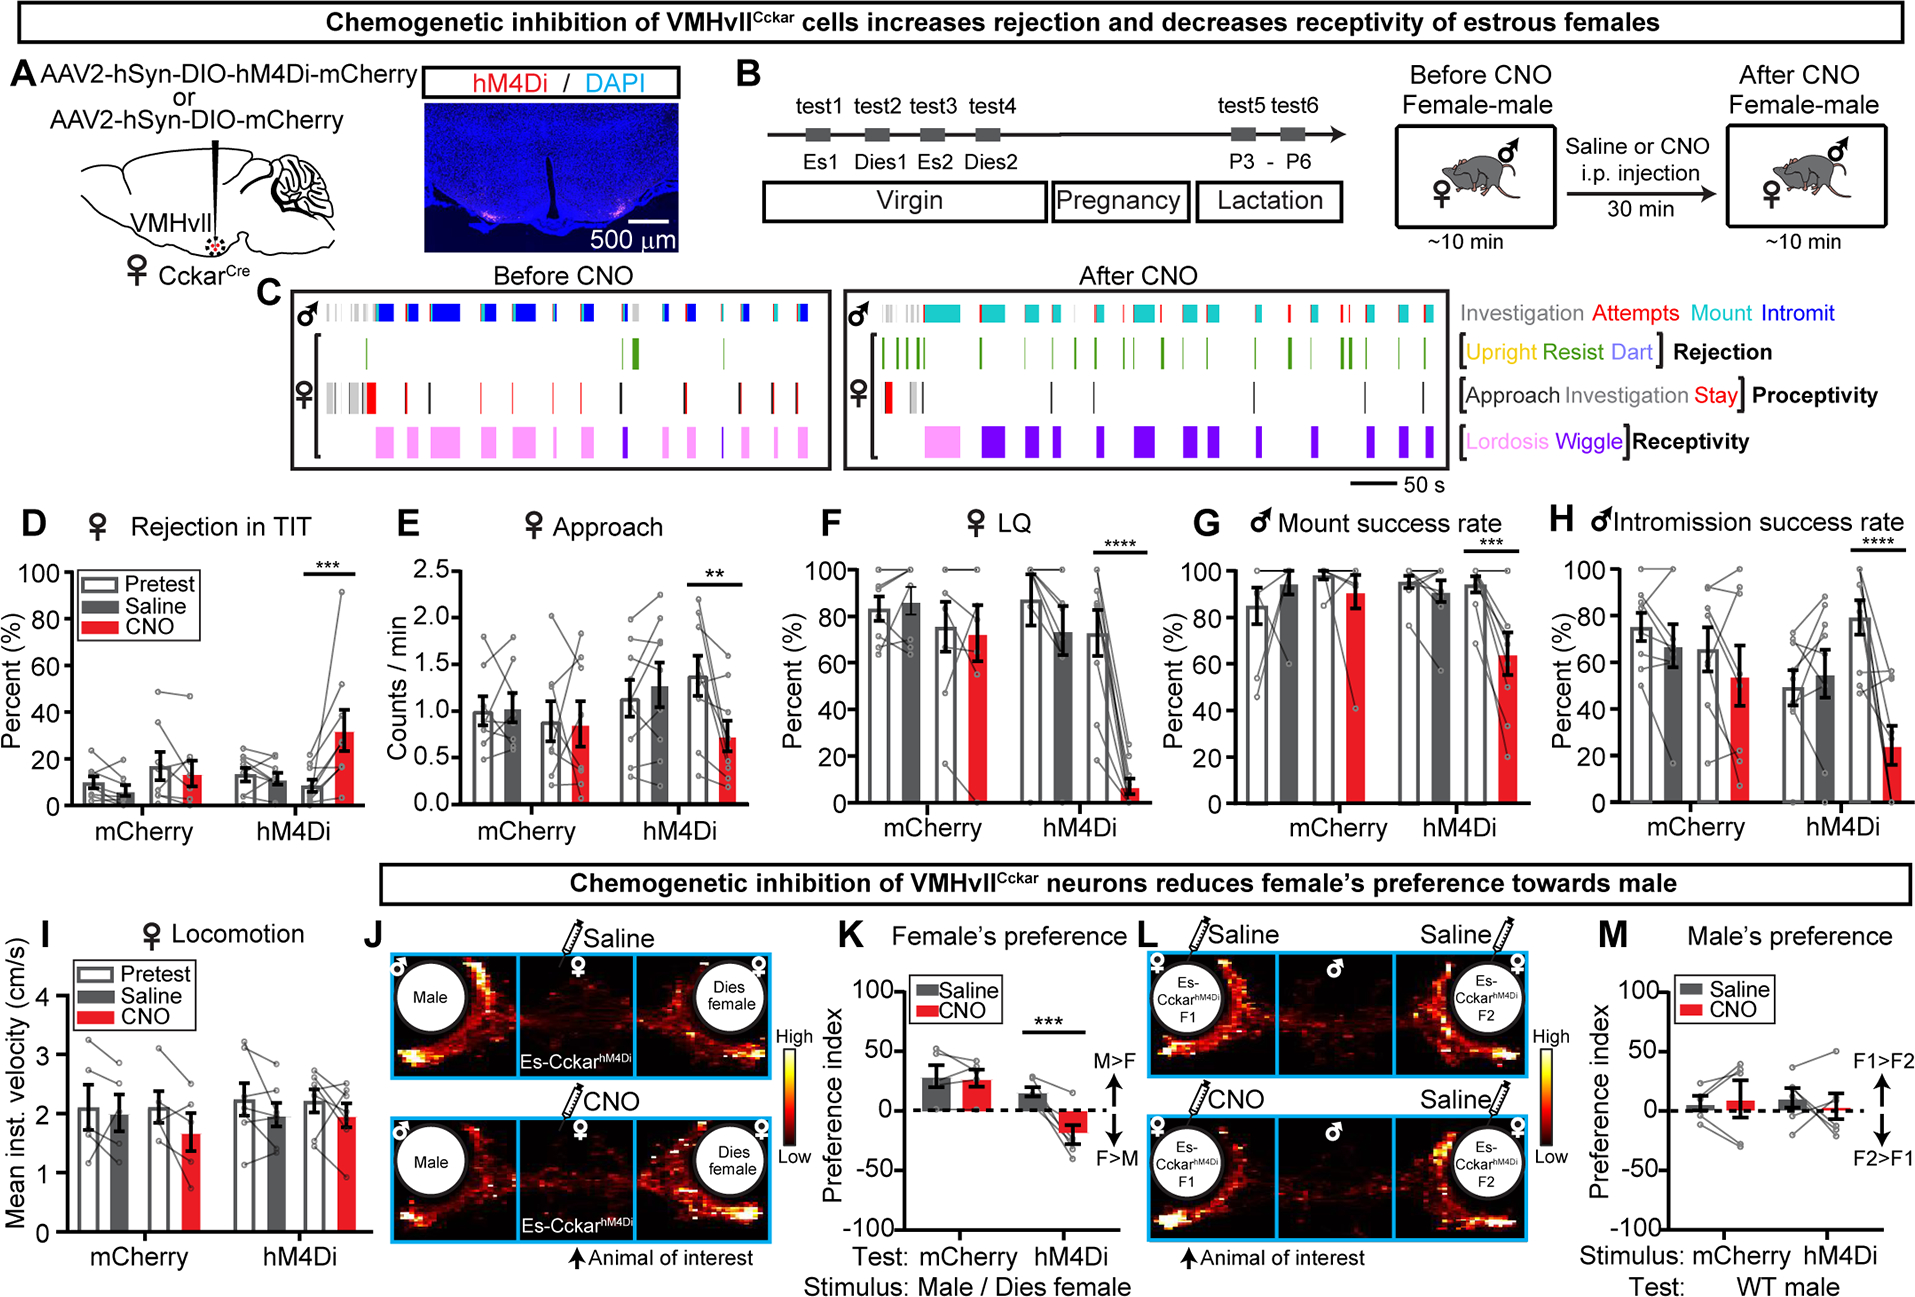
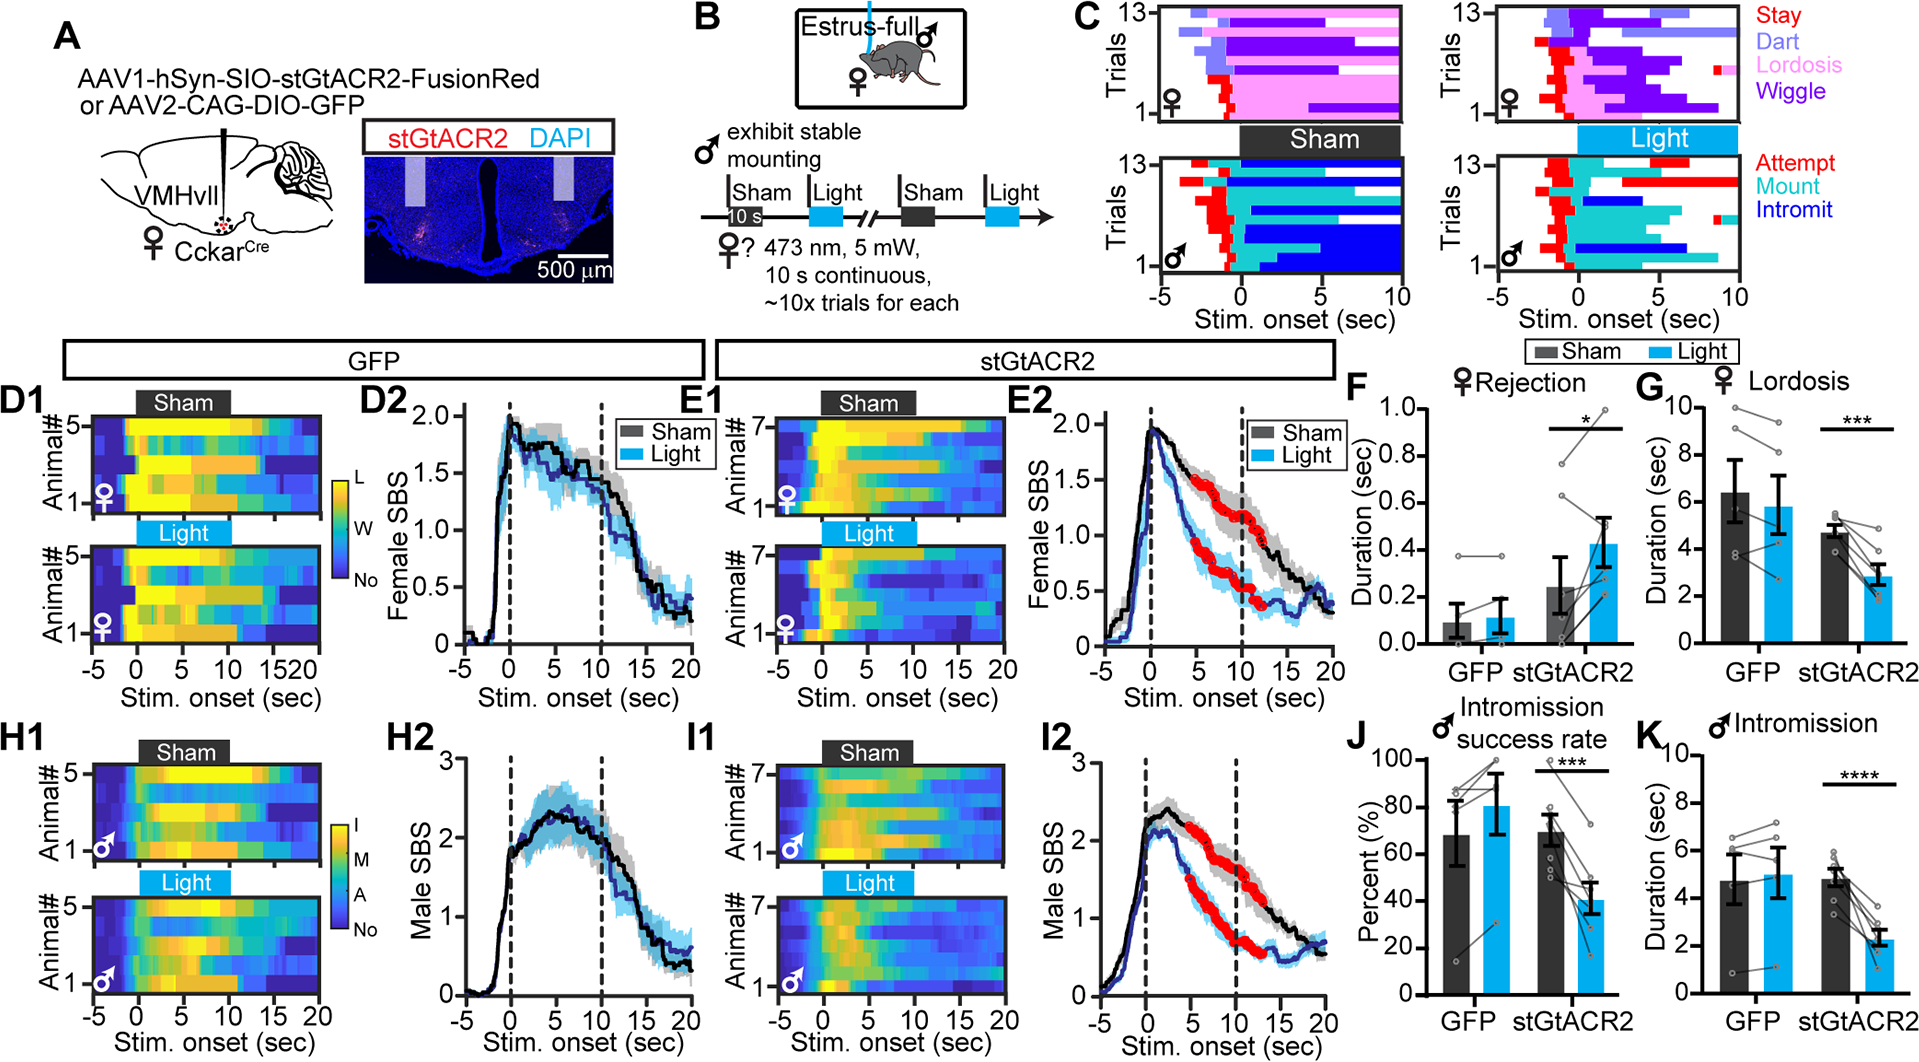
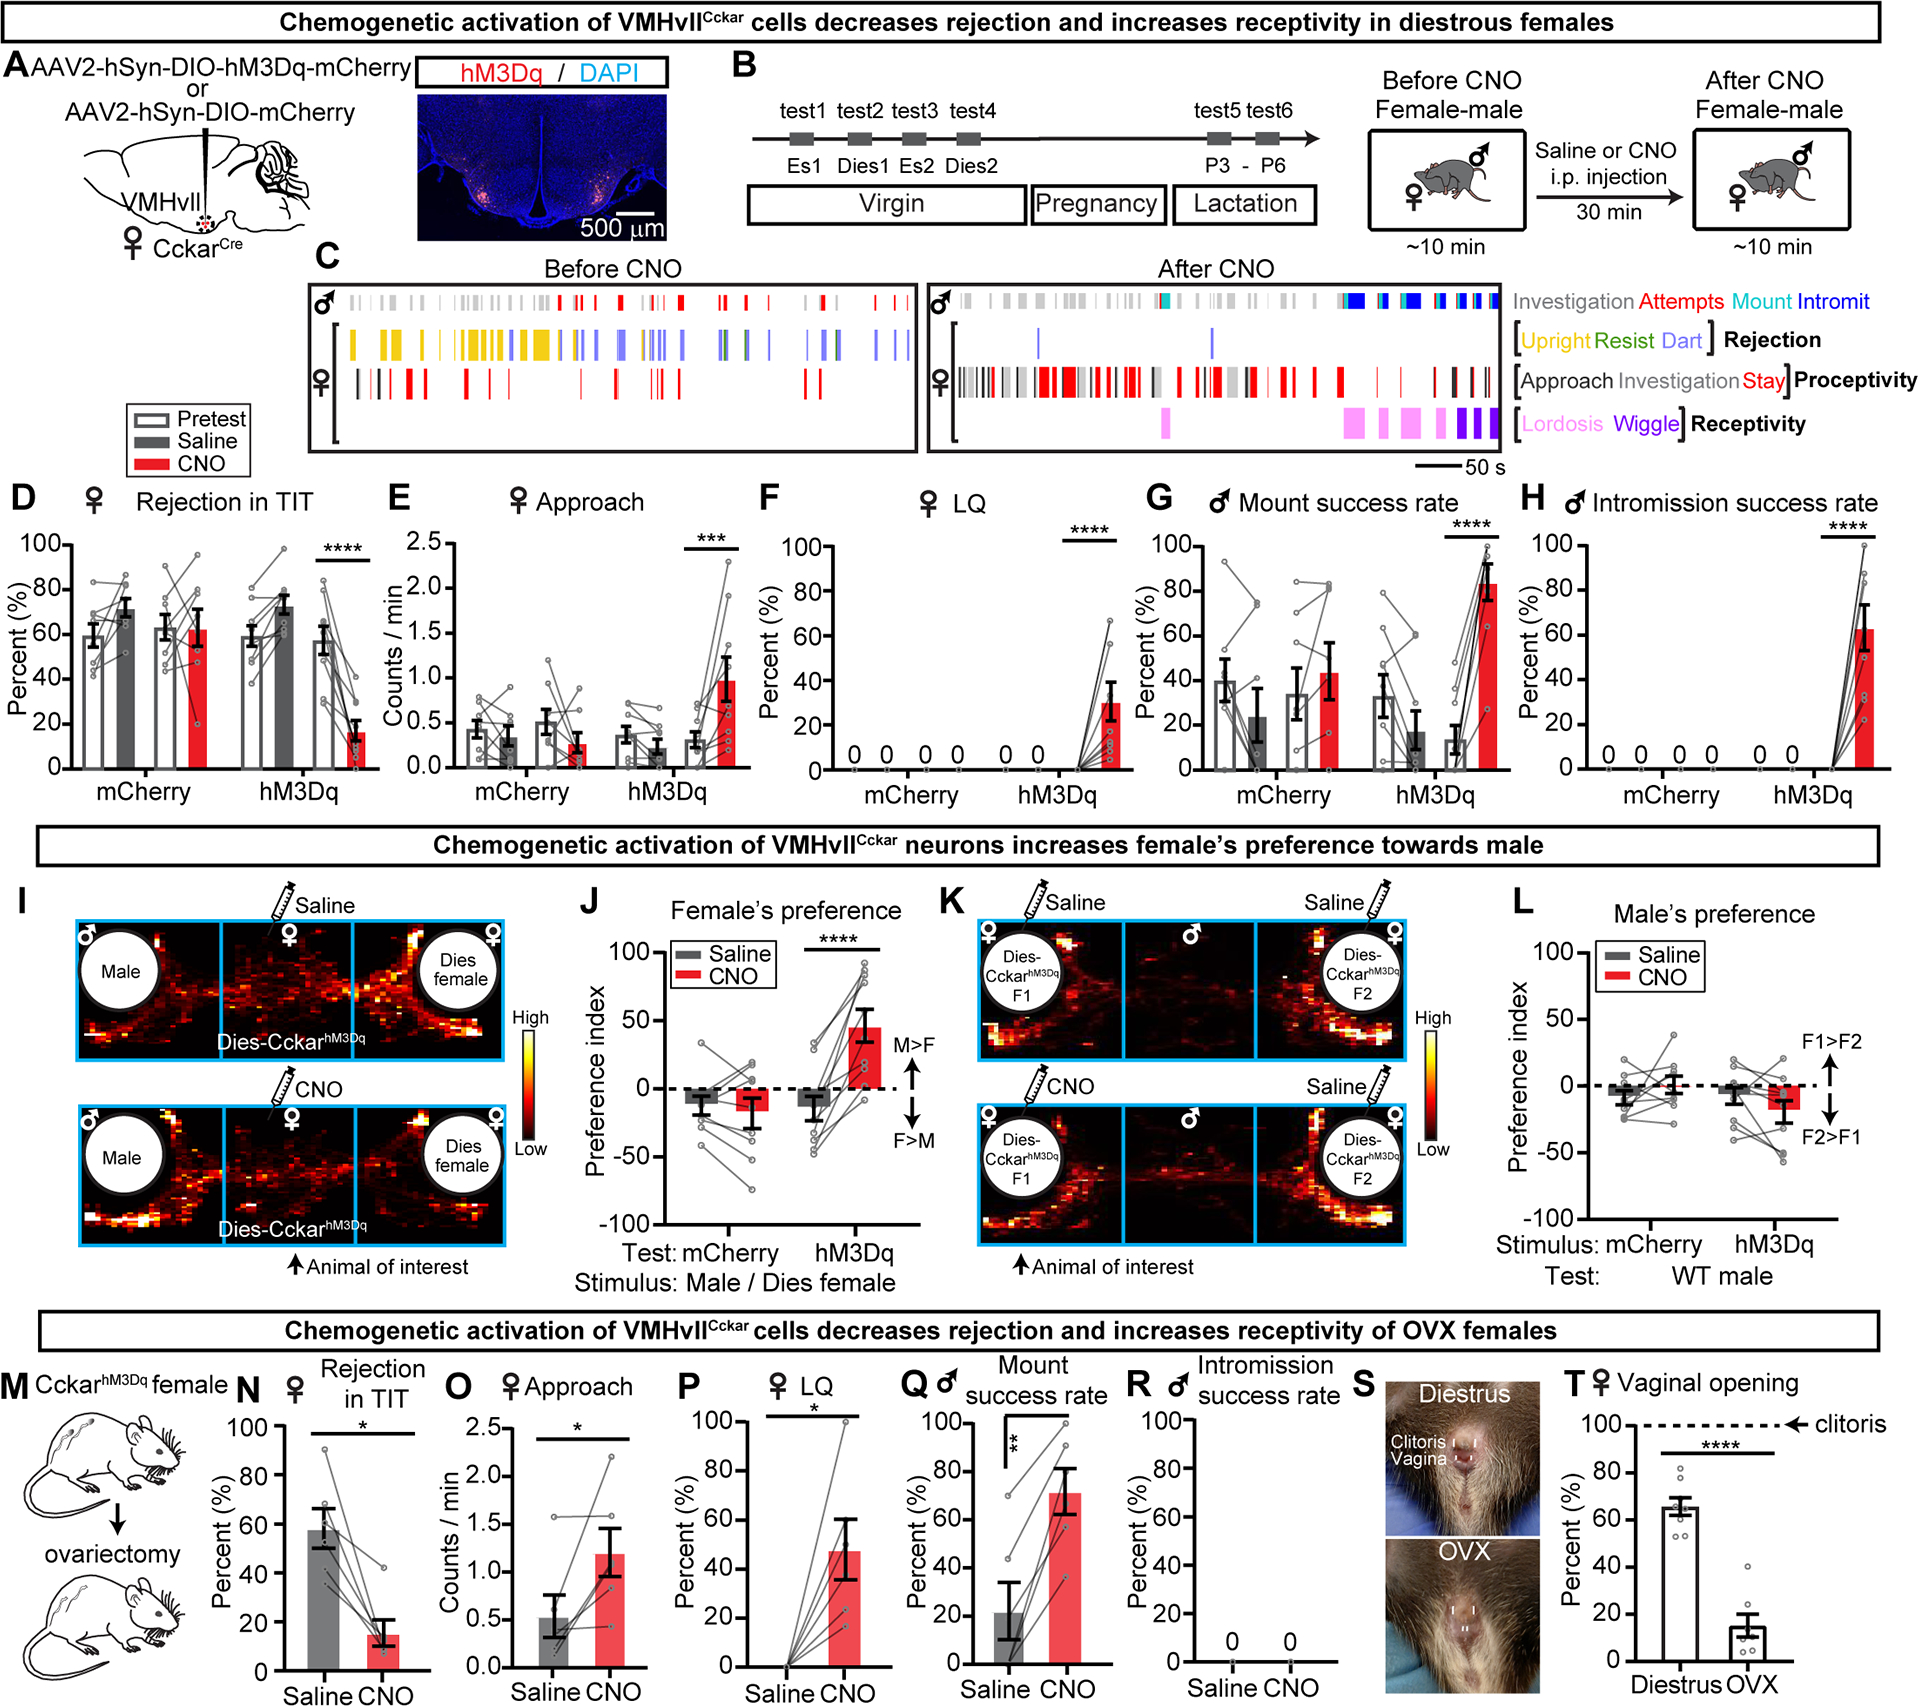
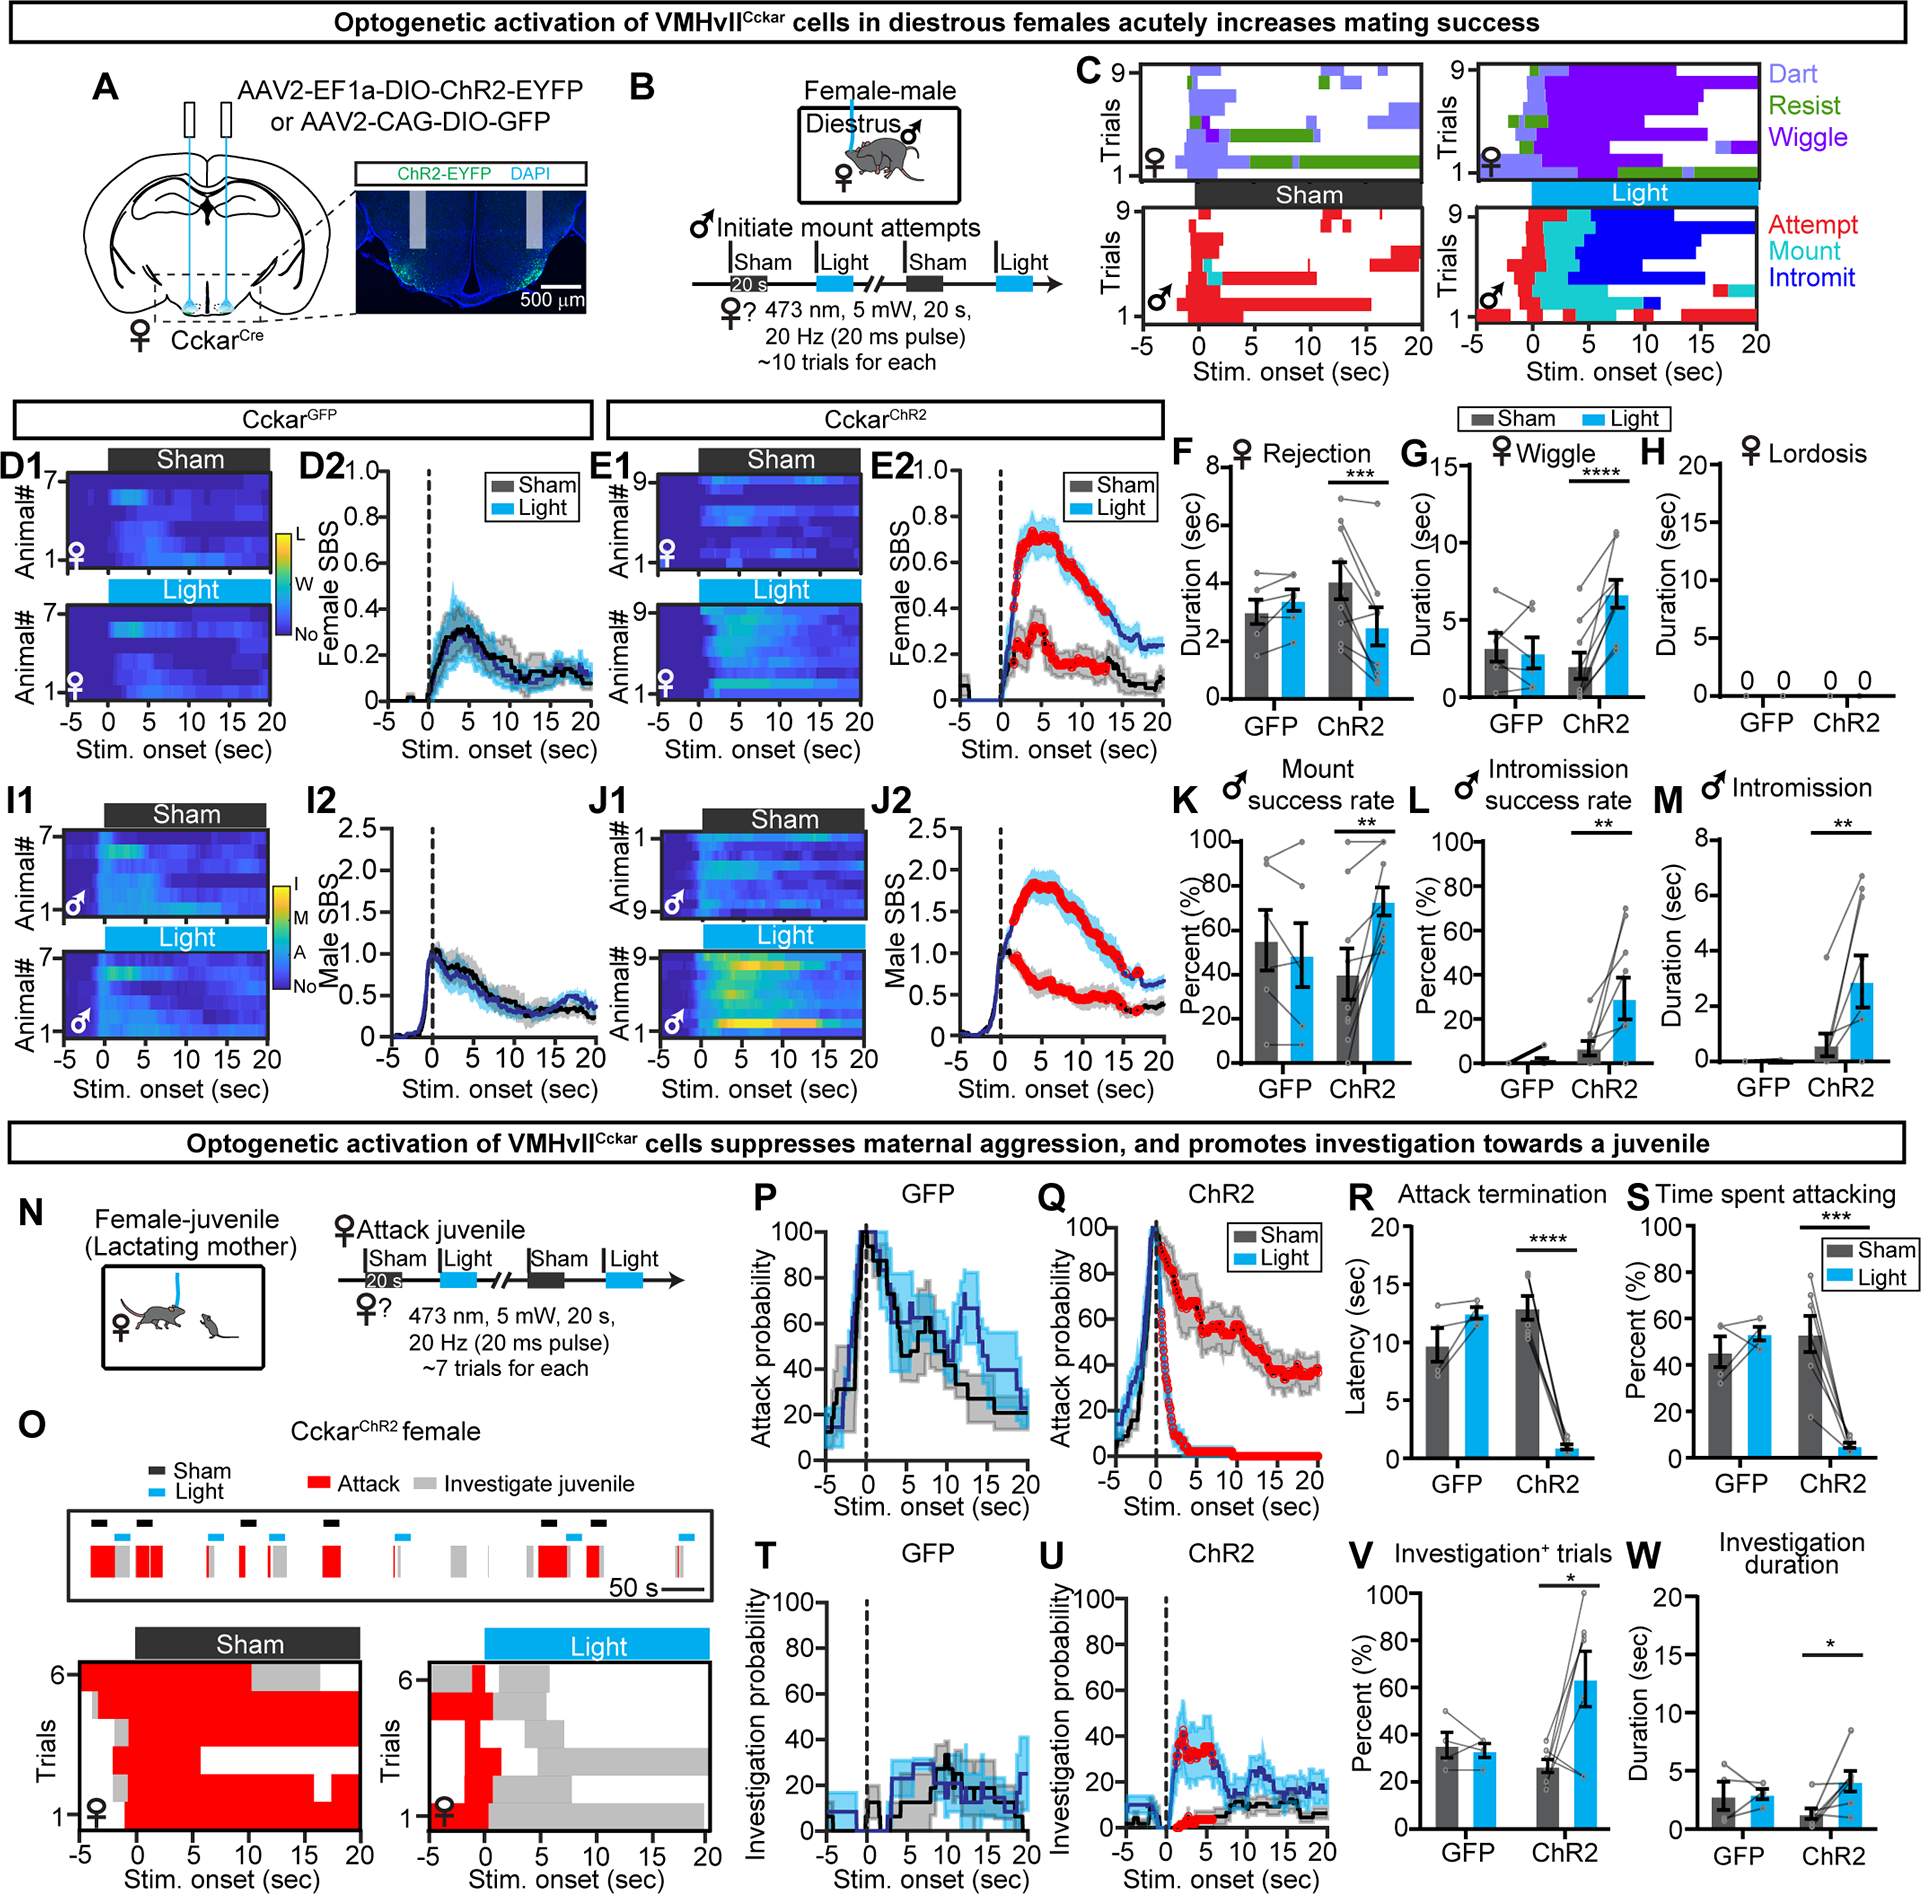
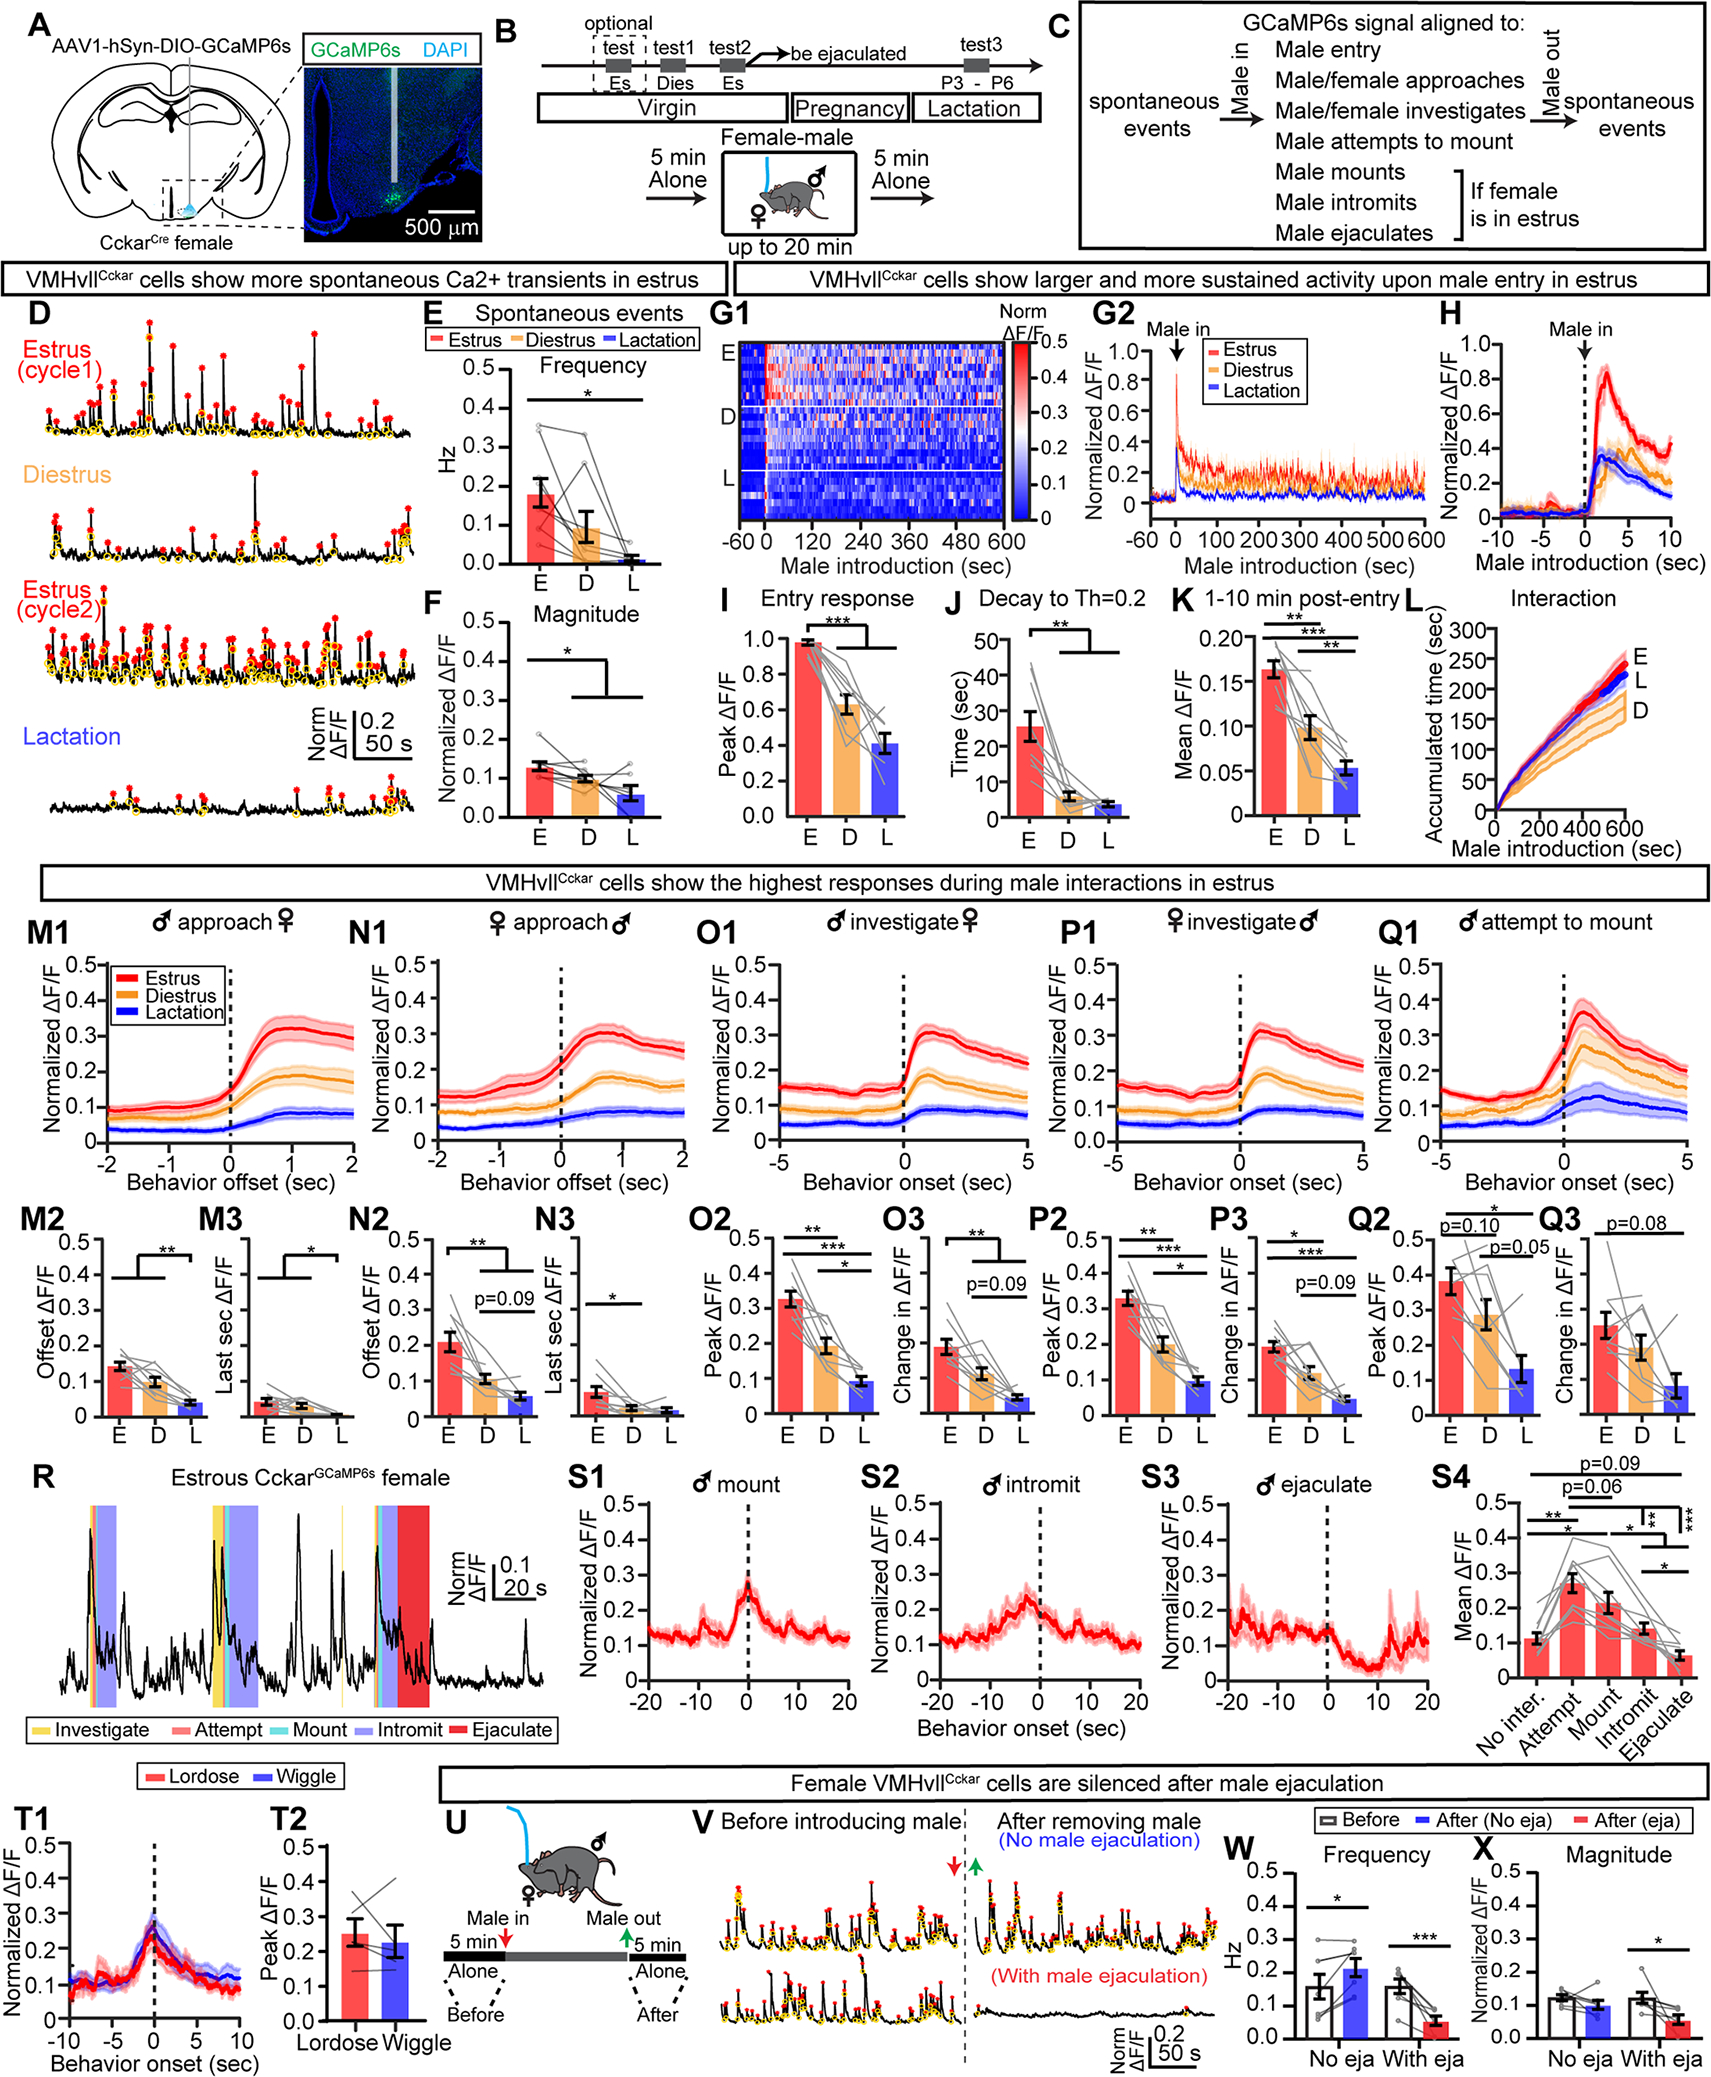
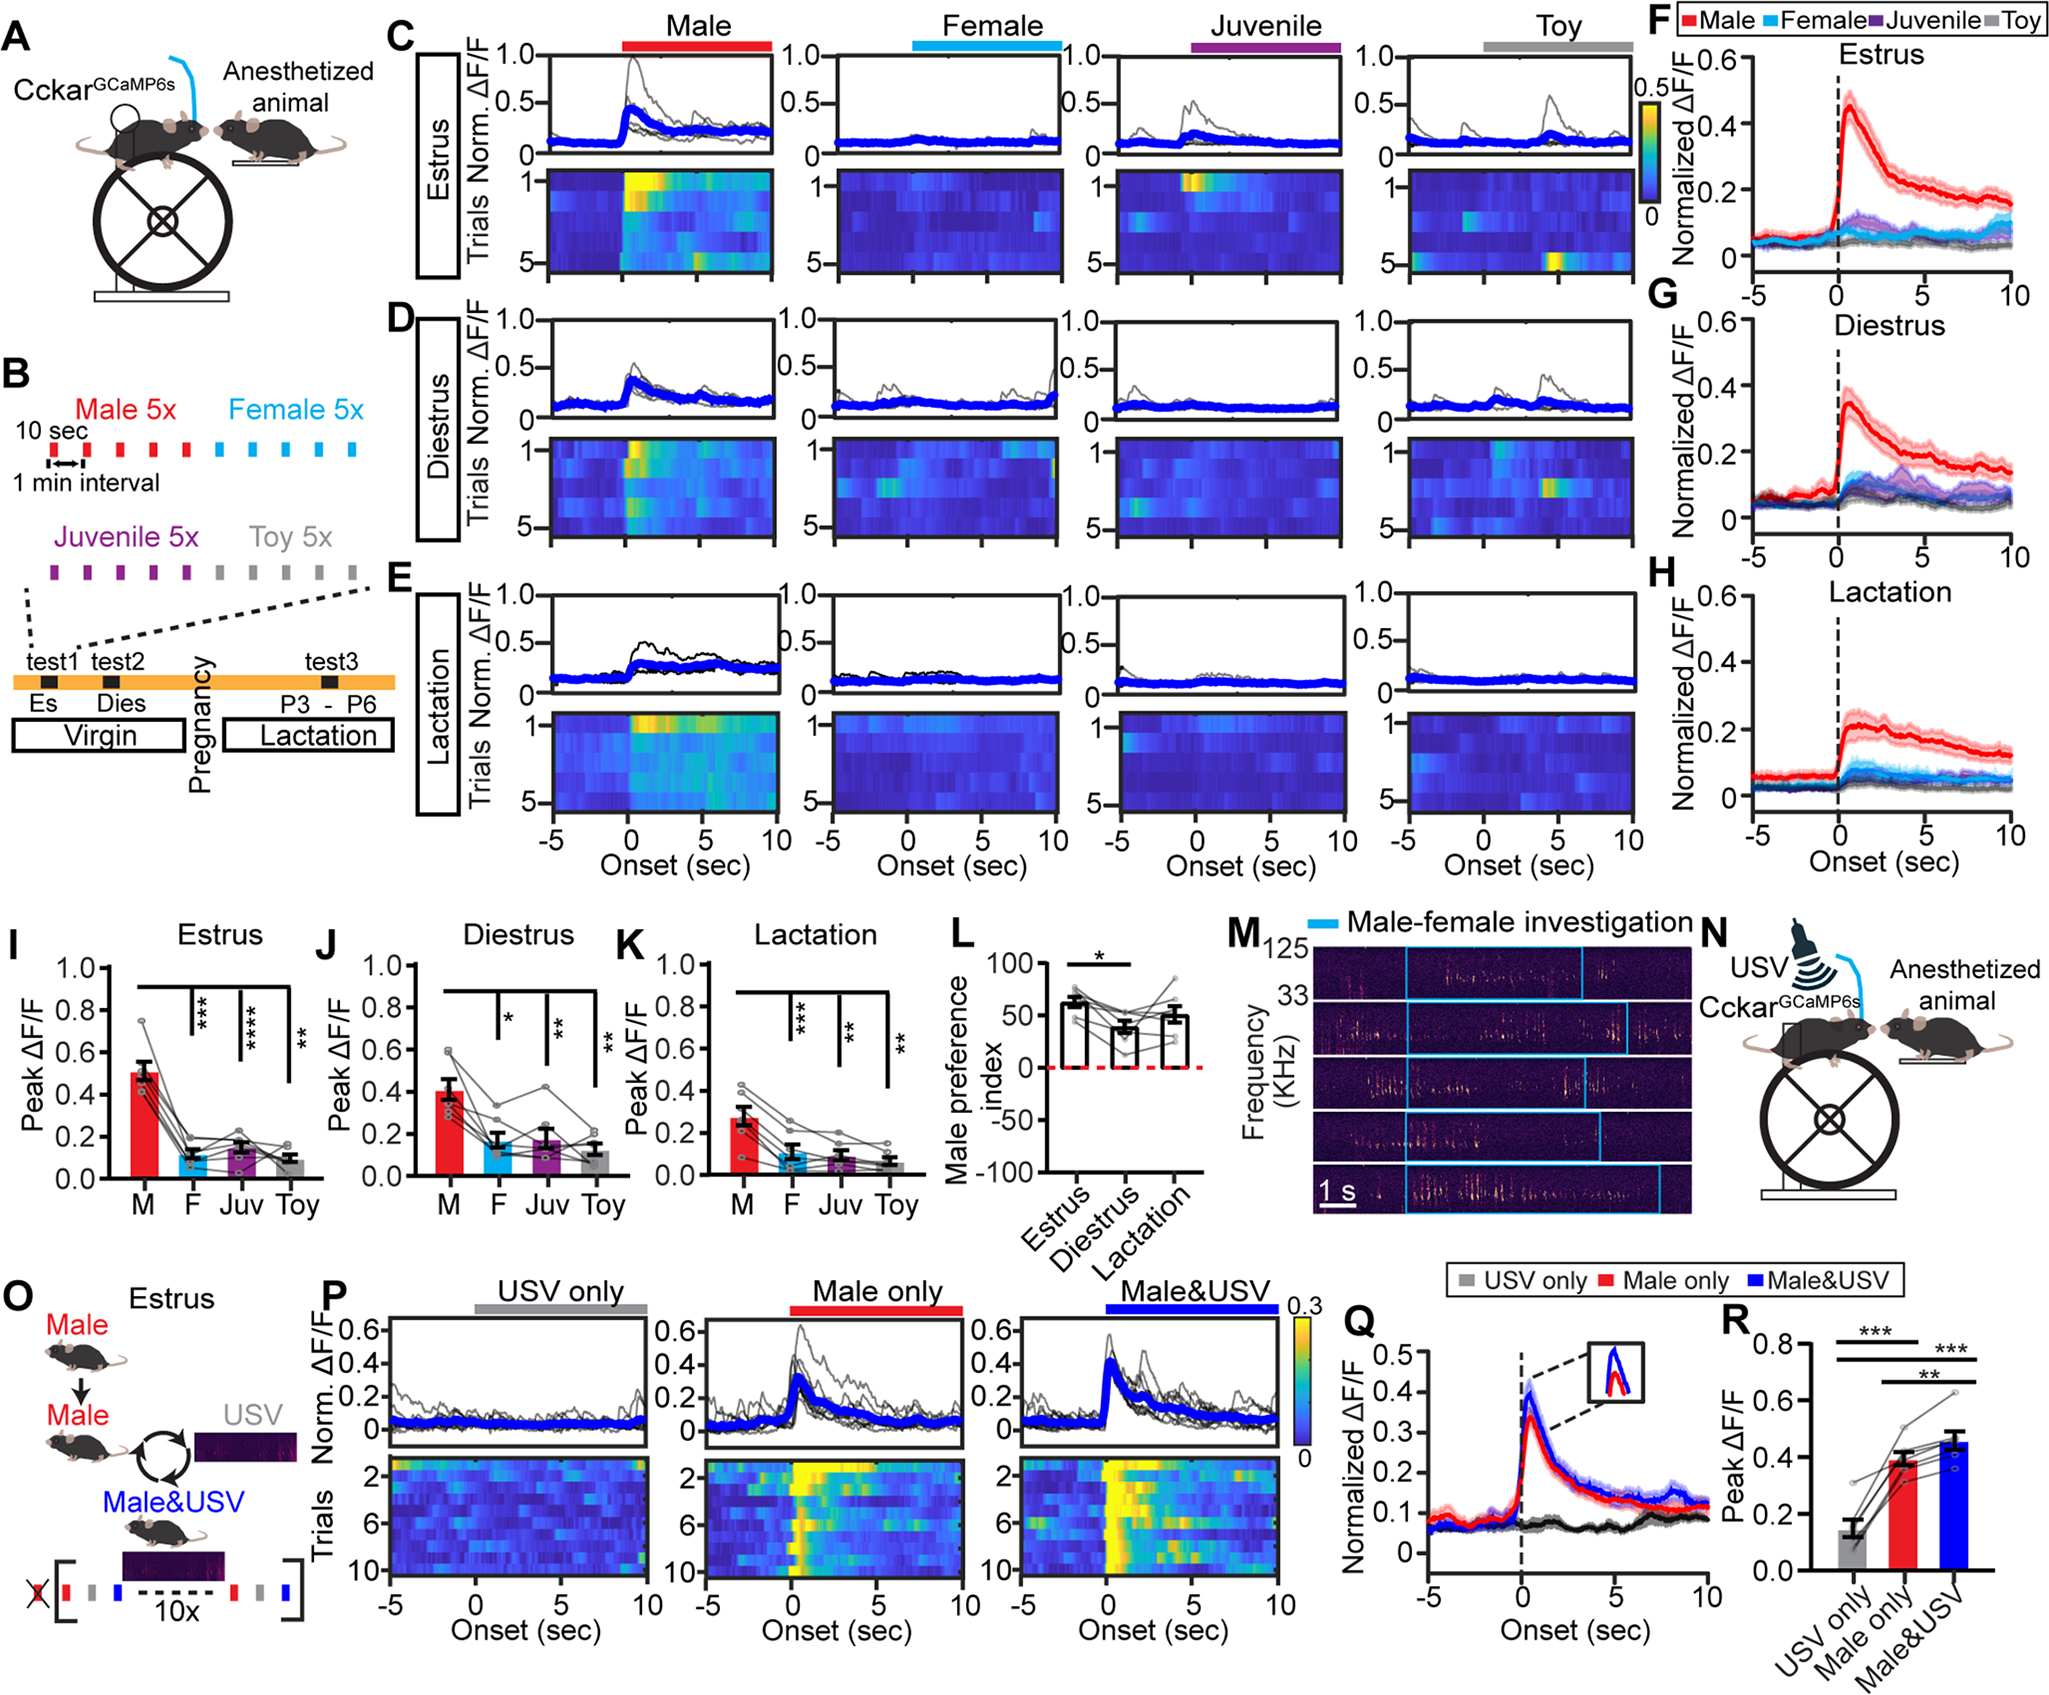
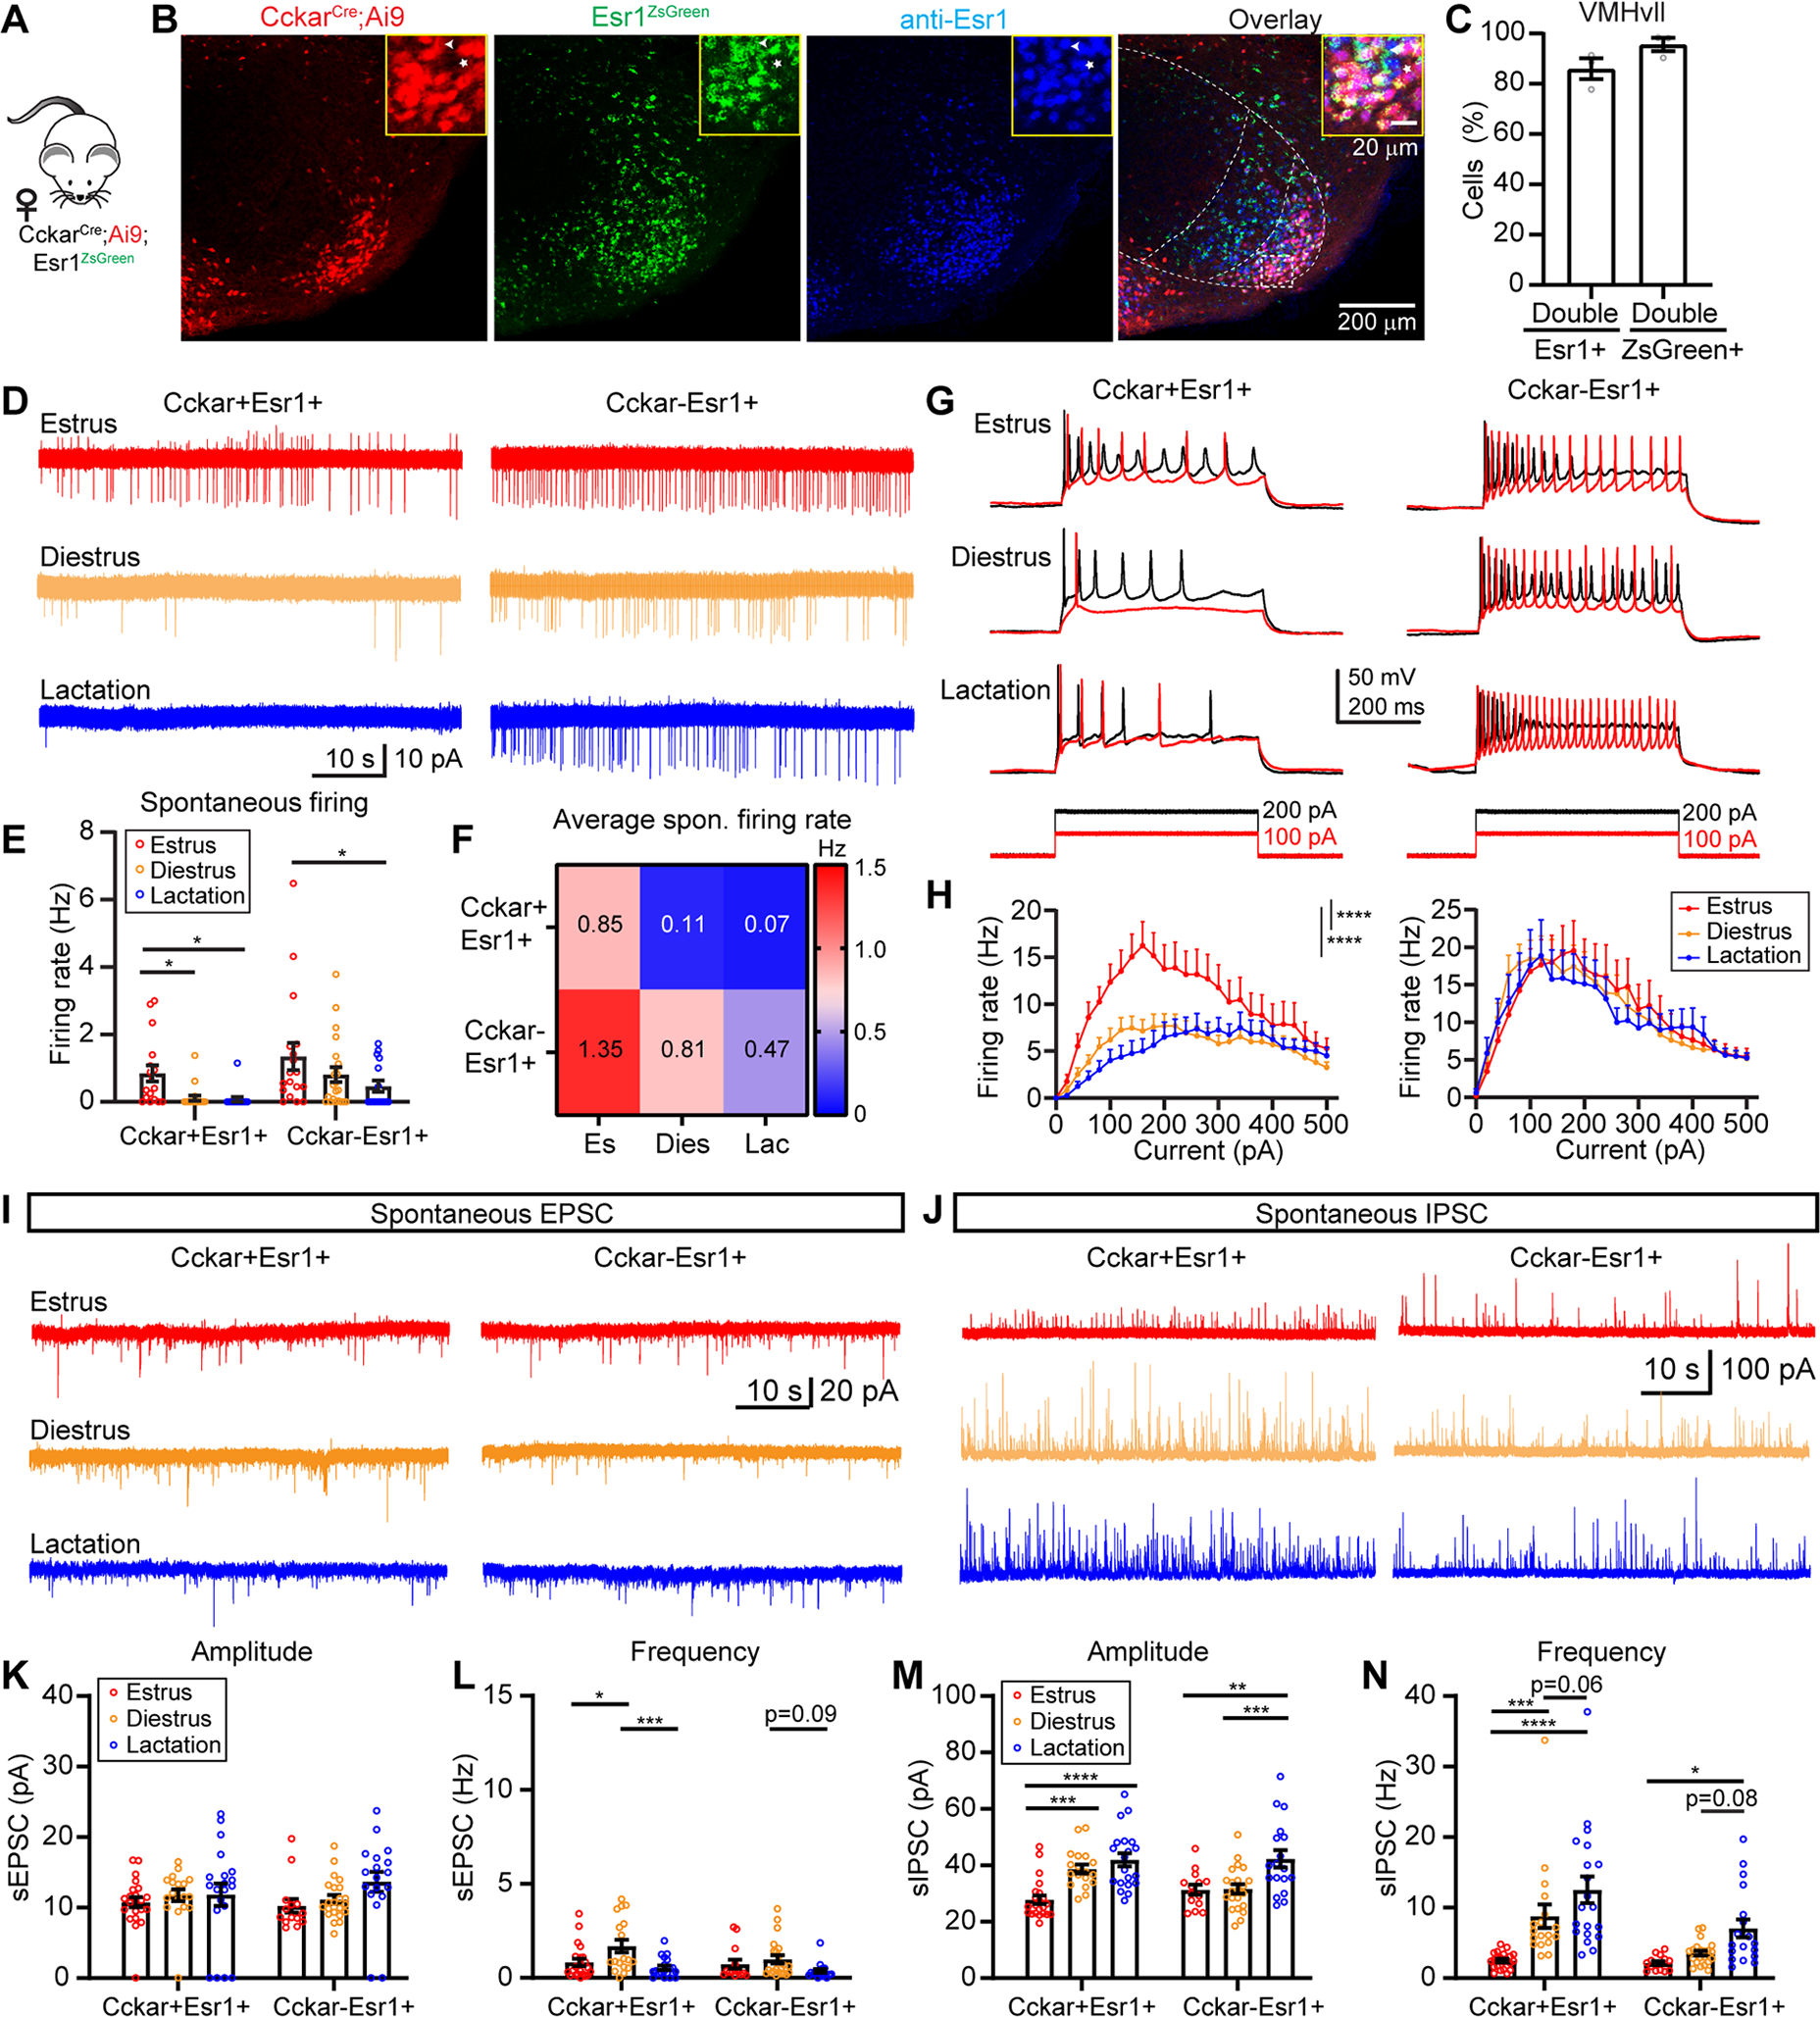
Sexual behavior is fundamental for the survival of mammalian species and thus supported by dedicated neural substrates. The ventrolateral part of ventromedial hypothalamus (VMHvl) is an essential locus for controlling female sexual behaviors, but recent studies revealed the molecular complexity and functional heterogeneity of VMHvl cells. Here, we identify the cholecystokinin A receptor (Cckar)-expressing cells in the lateral VMHvl (VMHvllCckar) as the key controllers of female sexual behaviors. The inactivation of VMHvllCckar cells in female mice diminishes their interest in males and sexual receptivity, whereas activating these cells has the opposite effects. Female sexual behaviors vary drastically over the reproductive cycle. In vivo recordings reveal reproductive-state-dependent changes in VMHvllCckar cell spontaneous activity and responsivity, with the highest activity occurring during estrus. These in vivo response changes coincide with robust alternation in VMHvllCckar cell excitability and synaptic inputs. Altogether, VMHvllCckar cells represent a key neural population dynamically controlling female sexual behaviors over the reproductive cycle.

Keywords: cholecystokinin A receptor; female sexual behavior; maternal aggression; neural plasticity; reproductive cycle; ventrolateral part of ventromedial hypothalamus.


Conflict of interest statement

Declaration of interests The authors declare no competing interests.

Figures

Figure 1.
Figure 1.. Characterization of VMHvllCckar cells
(A) Cckar and Cre mRNA in the VMHvl of a CckarCre female mouse. (B) Overlap between VMHvll Cre and Cckar mRNA. (C) Esr1 staining in the VMHvl of a CckarCre;Ai6 female mouse. (D) Overlap between VMHvll Esr1 and Cckar. (E) Immunostaining of sexual behavior induced Fos (FosSex) in the VMHvl of a CckarCre;Ai6 female mouse. (F) Overlap between VMHvll Cckar and FosSex. (G) Retrobead-labeled VMHvll cells from AVPV of a CckarCre;Ai6 female mouse. Insert shows injection site. (H) Overlap between Cckar and retrobead cells in VMHvll. (I) The percentage of Esr1, Cckar, FosSex and retrobeads cells in VMHvll in DAPI+ cells. (J) Viral strategy for axon tracing of VMHvllCckar cells. (K) GFP expression in the VMHvllCcka cells. Inset, the zoom-in view of the boxed area. (L) GFP expressing terminals from VMHvllCckar at AVPV, BNST and mPOA. (M) The top five brain regions that receive inputs from VMHvllCckar. In (A, C, E, G), right shows the enlarged view of the boxed area. Dotted lines demarcate VMH subdivisions. In (D, F, H), horizontal dashed lines indicate the chance level of overlap. Data are mean ± s.e.m. (D, F, H) One sample t test. *p<0.05; **p<0.01; ***p<0.001. n = 3 animals (B, D, F, H, I, M). See also Figures S1–S3.
Figure 2.
Figure 2.. Chemogenetic inhibition of VMHvllCckar cells suppresses female sexual behaviors
(A) Viral strategy and histology. (B) Experimental timeline. (C) Behavior raster plots of a male and an estrous CckarhM4Di female before and after CNO injection to the female. (D-I) Percentage of time female spent on rejecting the male (summation of upright, resist and dart) during total interaction time (D), frequency of approach initiated by females (E), lordosis quotient (LQ) (F), male mount success rate (G), male intromission success rate (H), average locomotion velocity of solitary females calculated over 30 minutes (I) before and after saline or CNO injection. (J) The distribution of female’s body center location after saline or CNO injection. (K) Test female’s preference index (PI). Positive values indicate male preference. (L) The distribution of the male’s body center location. The stimulus animals are injected either both with saline (top) or one with CNO and one with saline (bottom). (M) Comparison of male’s preference index. Positive values indicate preference of CNO injected females. Data are mean ± s.e.m. (D-I, K, M) Two-way ANOVA followed by Sidak’s multiple comparisons test. **p<0.01; ***p<0.001; ****p<0.0001. n = number of animals. mCherry: n=8 (D-H), 5 (I, K, M); hM4Di: n=9 (D-H), 7 (I), 6 (K, M). See also Figures S4–S8.
Figure 3.
Figure 3.. Optogenetic inhibition of VMHvllCckar cells impairs female sexual receptivity
(A) Viral strategy and histology. Shades indicate optic fiber tracks. (B) Behavioral paradigm and stimulation protocol. (C) Behavior raster plots of a female (top) and its paired male (bottom) during sham and light trials. (D) Heatmaps (D1) and PSTHs (D2) showing female SBS aligned to sham or light onset of all CckarGFP females. L: lordosis; W: wiggle: No: no mating. (E) Same as (D), but for all CckarstGtACR2 females. (F and G) The average duration females spent on rejecting the male (F) and lordosis (G) during sham and light stimulation of CckarGFP and CckarstGtACR2 females. (H-I) Male SBS aligned to the onsets of sham or light stimulation delivered to the paired CckarGFP (H) or CckarstGtACR2 females (I). I: intromission; M: mount: A: attempt to mount; No: no mating. (J and K) Male intromission success rate (J) and the average male intromission duration (K) during sham and light trials when the male was paired with CckarGFP or CckarstGtACR2 females. Data are mean ± s.e.m. (D2, E2, H2, I2) Two-way ANOVA with repeated measures, followed by Sidak’s multiple comparisons test. Red dots indicate periods when SBS differ significantly (p<0.05) between sham and light trials. Dashes vertical lines indicate sham and light periods. (F, G, J, K) Two-way ANOVA followed by Sidak’s multiple comparisons test. *p<0.05; ***p<0.001; ****p<0.0001. n = 5 animals for GFP group, and 7 for stGtACR2 group.
Figure 4.
Figure 4.. Chemogenetic activation of VMHvllCckar cells promotes female proceptivity and receptivity
(A) Viral strategy and histology. (B) Experimental timeline. (C) Behavior raster plots of a male and a diestrous CckarhM3Dq female before and after CNO injection to females. (D-H) Percentage of time female spent on rejecting the male (D), frequency of female initiated approach (E), LQ (F), male mount success rate (G), male intromission success rate (H) before and after saline or CNO injection. (I) Distribution of female’s body center location before and after saline or CNO. (J) Female’s PI. Positive values indicate male preference. (K) Distribution of a male’s body center location. (L) Male’s PI. Positive values indicate preference for CNO-injected female. (M) Ovariectomy. (N-R) Percentage of time female spent on rejecting the male (N), female-initiated approaches frequency (O), LQ (P), male mount success rate (Q), male intromission success rate (R) before and after saline or CNO injection to females. (S) Female vaginal opening in diestrous and OVX females. Upper and lower short lines denote clitoris and vaginal opening, respectively. (T) Width of female vaginal opening normalized to that of clitoris in diestrous and OVX females. Data are mean ± s.e.m. (D-H, J, L) Two-way ANOVA followed by Sidak’s multiple comparisons test. (N-O) Two-tailed Wilcoxon matched-pairs signed rank test. (P) One-sample t test, with hypothetical value as 0. (Q) Two-tailed paired t test. (T) Two-tailed unpaired t test. *p<0.05; **p<0.01; ***p<0.001; ****p<0.0001. n = number of animals. n=8 (D-H) and 9 (J, L) mCherry females; n=9 (D-H) and n=10 (J, L) hM3Dq females; n=6 (N-R) OVX-hM3Dq females; n=8 (T) for diestrous and n=7 (T) for OVX-hM3Dq females. See also Figures S4, S5, S8–S10.
Figure 5.
Figure 5.. Optogenetic activation of VMHvllCckar cells increases mating success and suppresses maternal aggression in females
(A) Viral strategy and histology. Shades indicate optic fiber tracks. (B) Behavioral paradigm and stimulation protocol. (C) Behavior raster plots of a female (top) and its paired male (bottom) during sham and light stimulation of the female. (D) Heatmaps (D1) and PSTHs (D2) showing female SBS aligned to the onset of sham or light stimulation of all diestrous CckarGFP females. L: lordosis; W: wiggle: No: no mating. (E) Same as (D), but for CckarChR2 females. (F-H) The average duration females spent on rejecting the male (F), wiggle (G) and lordosis (H) during sham and light stimulation of CckarGFP and CckarChR2 females. (I-J) Male SBS aligned to the onset of sham or light delivered to the paired CckarGFP (I) or CckarChR2 females. I: intromission; M: mount: A: attempt to mount; No: no mating. (K-M) Male mount success rate (K), intromission success rate (L), and average male intromission duration (M) during sham and light trials when the male was paired with CckarGFP or CckarChR2 females. (N) Behavioral paradigm and stimulation protocol. Stimulation started upon attack initiation. (O) Behavior raster plots of a lactating CckarChR2 female with a juvenile intruder upon sham and light simulation. (P and Q) PSTHs of attack probability of lactating CckarGFP (P) and CckarChR2 (Q) females aligned to sham and light stimulation onset. (R) The latency to terminate attack from the light or sham onset. (S) The percent of time the females spent on attacking the juvenile during the sham and light periods. (T and U) PSTHs of investigation probability of lactating CckarGFP (T) and CckarChR2 (U) females aligned to sham and light onset. (V) Percentage of sham and light trials with female investigation of a juvenile. (W) Juvenile investigation duration during sham and light trials. Data are mean ± s.e.m. (D2, E2, I2, J2, P and Q, T and U) Two-way ANOVA with repeated measures, followed by Sidak’s multiple comparisons test. Red dots indicate periods when SBS differ significantly (p<0.05) between sham and light trials. (F-G, K-M, R-S, V-W) Two-way ANOVA with Sidak’s multiple comparisons test. *p<0.05; **p<0.01; ***p<0.001; ****p<0.0001; n = number of animals. GFP: n=6 (D-M), 4 (P, R-S, T, V-W); ChR2: n=9 (D-M), 7 (Q, R-S, U, V-W). See also Figure S11.
Figure 6.
Figure 6.. Reproductive-state dependent responses of female VMHvllCckar cells during male interaction
(A) Fiber photometry recording and histology. Shade indicates optic fiber track. (B) Recording timeline. (C) Parameters analyzed in the figure. (D) Representative traces of Ca2+ signal of VMHvllCckar cells in a solitary females during different reproductive states. Red: transient peaks. Yellow: transient troughs. (E-F) Frequency (E) and magnitude (F) of spontaneous Ca2+ events during estrus diestrus and lactation. (G) Heatmap of Ca2+ traces from individual females (G1) and the average of all females under a specific reproductive state (G2) during male-female interaction. For each animal, signals were normalized to 0–1 by the maximum Ca2+ signal across all recording sessions of that animal. (H) Male entry aligned PETHs of Ca2+ signals from all animals under a specified reproductive state. (I) Peak ΔF/F within the first 60 s after male entry. (J) The time for the normalized ΔF/F to reach 0.2 after peaking during the male entry. (K) Mean ΔF/F from 1–10 minutes after male entry. (L) The accumulated male-female interaction time over 10 minutes when the females were under different reproductive states. (M1-M3) PETHs of normalized ΔF/F aligned to the offset of male-initiated approach towards the female (M1), value at the offset of approach (M2), change in normalized ΔF/F during the last second of approach (M3). (N1-N3) Same as (M1-M3) but for female-initiated approach. (O1-O3) PETHs of normalized ΔF/F aligned to the onset of male investigation of the recording female (O1), Peak ΔF/F during male investigation (O2), and the difference between the peak response and the mean ΔF/F at the preceding baseline (−3 to −1 s) (O3). (P-Q) Same as (O). Signal aligned to the onset of female investigation of the male (P1-P3) and onset of male mounting attempts (Q1-Q3). (R) Trace of normalized ΔF/F from an estrous female during copulation. Color shades indicate male behaviors. (S1-S3) PETHs of normalized ΔF/F aligned to the onset of male mounting (S1), intromission (S2) and ejaculation (S3). (S4) Mean signal during various male sexual behaviors. (T1) PETHs of normalized ΔF/F aligned to the onset of female lordosis (red) and wiggling (blue). (T2) Peak signal during wiggling and lordosis. (U) The time windows for spontaneous Ca2+ transient analysis. (U) Example traces of Ca2+ signals before male introduction (left) and after male removal (right). Top: no ejaculation. Bottom: with ejaculation. (W and X) Frequency (W) and magnitude (X) of spontaneous Ca2+ transients. Data are mean ± s.e.m. (E, F, I-K, M2-Q2, M3-Q3, S4) One-way ANOVA with repeated measures, followed by Tukey’s multiple comparisons test. (L) Two-way ANOVA, followed by Tukey’s multiple comparisons test, red and blue dots indicate periods when accumulated time differed significantly (p<0.05) between E and D vs. L and D, respectively. (T2) Two-tailed paired t test. (W, X) Two-way ANOVA, followed by Sidak’s multiple comparisons test. *p<0.05; **p<0.01; ***p<0.001. n = number of animals. (D-Q3) n=9 estrous, 9 diestrous and 7 lactating females. (S) n=9 estrous females. (T2) n=5 females. (W-X) n=7 estrous females. See also Figures S12–S15.
Figure 7.
Figure 7.. VMHvllCckar cells preferentially respond to male cues
(A) Head-fixed recording. (B) Stimulus presentation schedule. (C-E) Representative PETHs (top) and heatmaps (bottom) of normalized ΔF/F aligned to presentation of an anaesthetized male, female, juvenile, and a toy mouse. Traces are from the same female mouse during estrus(C), diestrus (D) and lactation (E). Blue shows the average. (F-H) Average PETHs of all animals aligned to the presentation onset of various stimuli when the recording females are in estrus (F), diestrus (G) and lactation (H). (I-K) Peak ΔF/F during presentation of various stimuli when the recording females are in estrus (I), diestrus (J) and lactation (K). (L) Male preference index under different reproductive states. Index: (male Peak ΔF/F)/Peak ΔF/F (male + female + juvenile) × 100%. (M) Representative USV during male investigation of a female (blue box). (N) Recording schematics to probe VMHvllCckar cell responses to male USV. (O) Stimulus presentation schedule. (P) Representative PETHs (top) and heatmaps (bottom) of normalized ΔF/F aligned to presentation of male USV, an anaesthetized male, and anaesthetized male + USV. Traces from the same estrous female. (Q) Average PETHs of all animals aligned to the presentation of various stimuli. (R) Peak responses to various stimuli. Data are mean ± s.e.m. (I-L, R) One-way ANOVA, followed by Tukey’s multiple comparisons test. *p<0.05; **p<0.01; ***p<0.001. n = number of animals. (F-L, Q-R), n=7 for each group.
Figure 8.
Figure 8.. VMHvllCckar cells change physiological properties over reproductive cycle
(A) Mice used for slice recording. (B) Left to right showing tdTomato+, Cckar, ZsGreen, anti-Esr1 and overlay of all signals in the VMHvl. Dotted lines demarcate VMH. Inset, magnified region of the boxed area. (C) Percentage of overlap between Esr1 and ZsGreen. (D) Representative traces of cell-attached recording of VMHvllCckar+Esr1+ and VMHvllCckar−Esr1+ cells. (E-F) Bar plots (E) and heatmap (F) showing the spontaneous firing rate under three reproductive states. (G) Representative recording traces with 100 pA and 200 pA current injections. (H) F-I curves of female VMHvllCckar+Esr1+ (left) and VMHvllCckar−Esr1+ cells (right). (I-J) Representative traces of spontaneous EPSCs (I) and IPSCs (J). (K, L, M, N) Amplitude and frequency of sEPSC (K and L) and sIPSC (M and N). Data are mean ± s.e.m. (E, H, K-N) Two-way ANOVA followed by Tukey’s multiple comparisons test. *p<0.05; **p<0.01; ***p<0.001; ****p<0.0001. n = number of animals. (C) n=3 animals. (E-H) 17, 19, 16 VMHvllCckar+Esr1+ cells and 18, 22, 16 VMHvllCckar−Esr1+ cells from 3 females of each reproductive state. (K-N) 22, 18, 20 VMHvllCckar+Esr1+ cells and 14, 22, 18 VMHvllCckar−Esr1+ cells from 3 females of each reproductive state. See also Figure S16.

Comment in

References

    1. Ajayi AF, and Akhigbe RE (2020). Staging of the estrous cycle and induction of estrus in experimental rodents: an update. Fertil Res Pract 6, 5. - PMC - PubMed
    1. Andermann ML, and Lowell BB (2017). Toward a Wiring Diagram Understanding of Appetite Control. Neuron 95, 757–778. - PMC - PubMed
    1. Armbruster BN, Li X, Pausch MH, Herlitze S, and Roth BL (2007). Evolving the lock to fit the key to create a family of G protein-coupled receptors potently activated by an inert ligand. 104, 5163–5168. - PMC - PubMed
    1. Babcock AM, Bloch GJ, and Micevych PE (1988). Injections of cholecystokinin into the ventromedial hypothalamic nucleus inhibit lordosis behavior in the rat. Physiology behavior 43, 195–199. - PubMed
    1. Beach FA (1976). Sexual attractivity, proceptivity, and receptivity in female mammals. Horm Behav 7, 105–138. - PubMed

Publication types

Substances

LinkOut - more resources