. 2022 Sep 12;32(17):3704-3719.e7.
doi: 10.1016/j.cub.2022.07.003. Epub 2022 Jul 26.

EGFR signaling activates intestinal stem cells by promoting mitochondrial biogenesis and β-oxidation

Affiliations

EGFR signaling activates intestinal stem cells by promoting mitochondrial biogenesis and β-oxidation

Chenge Zhang et al. Curr Biol. .

Abstract

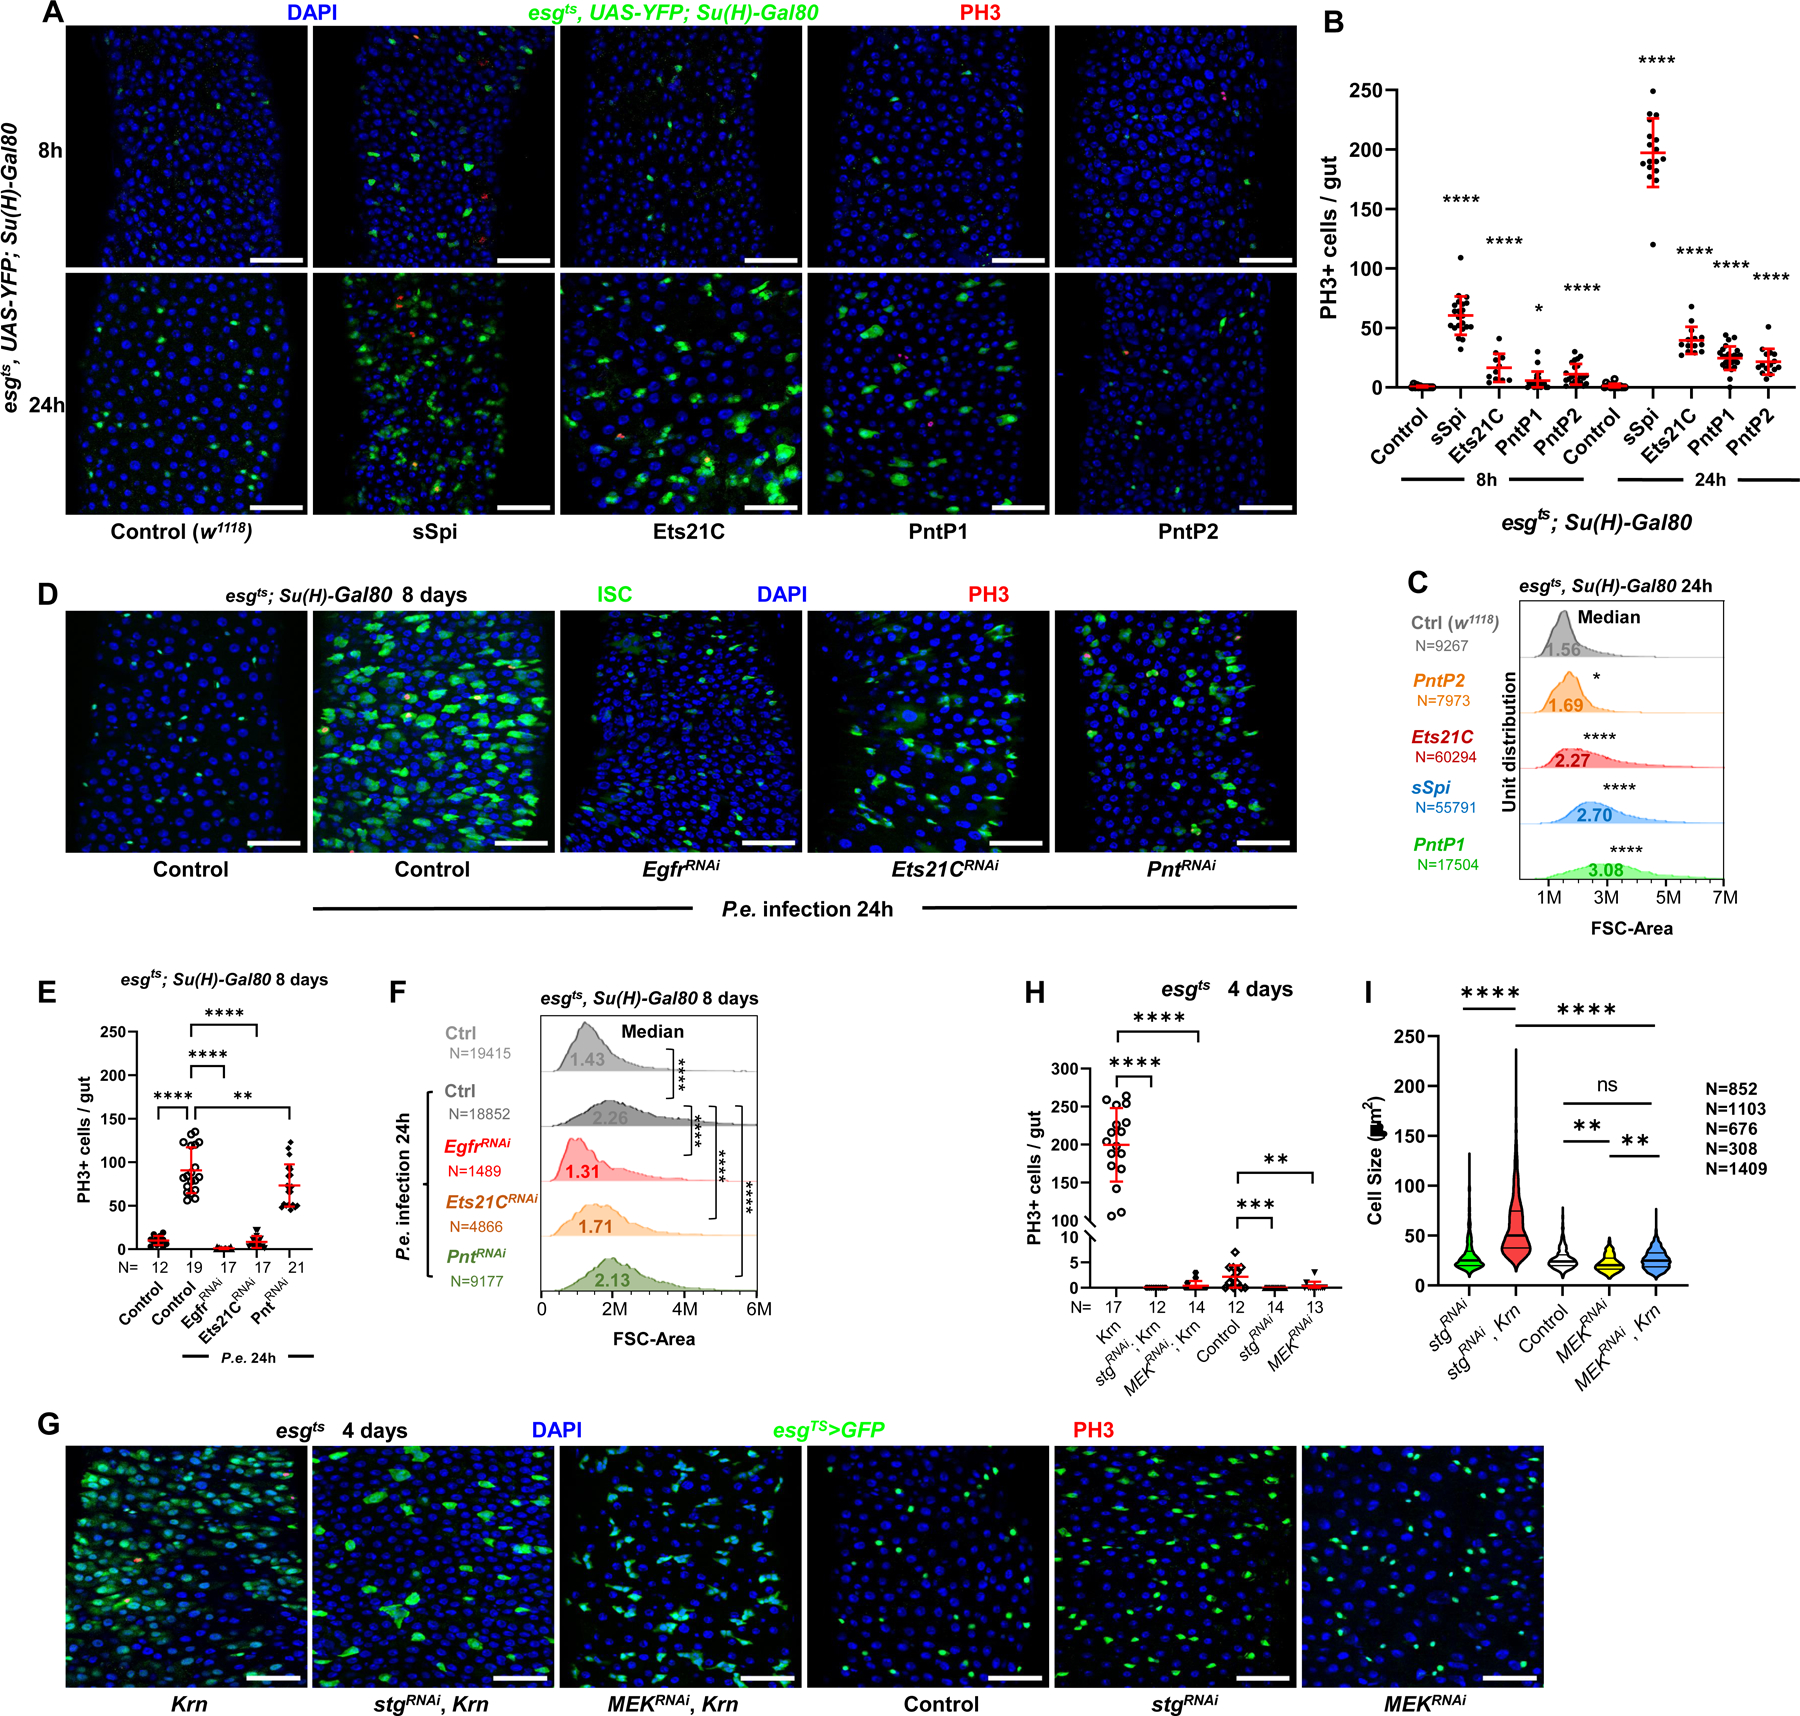
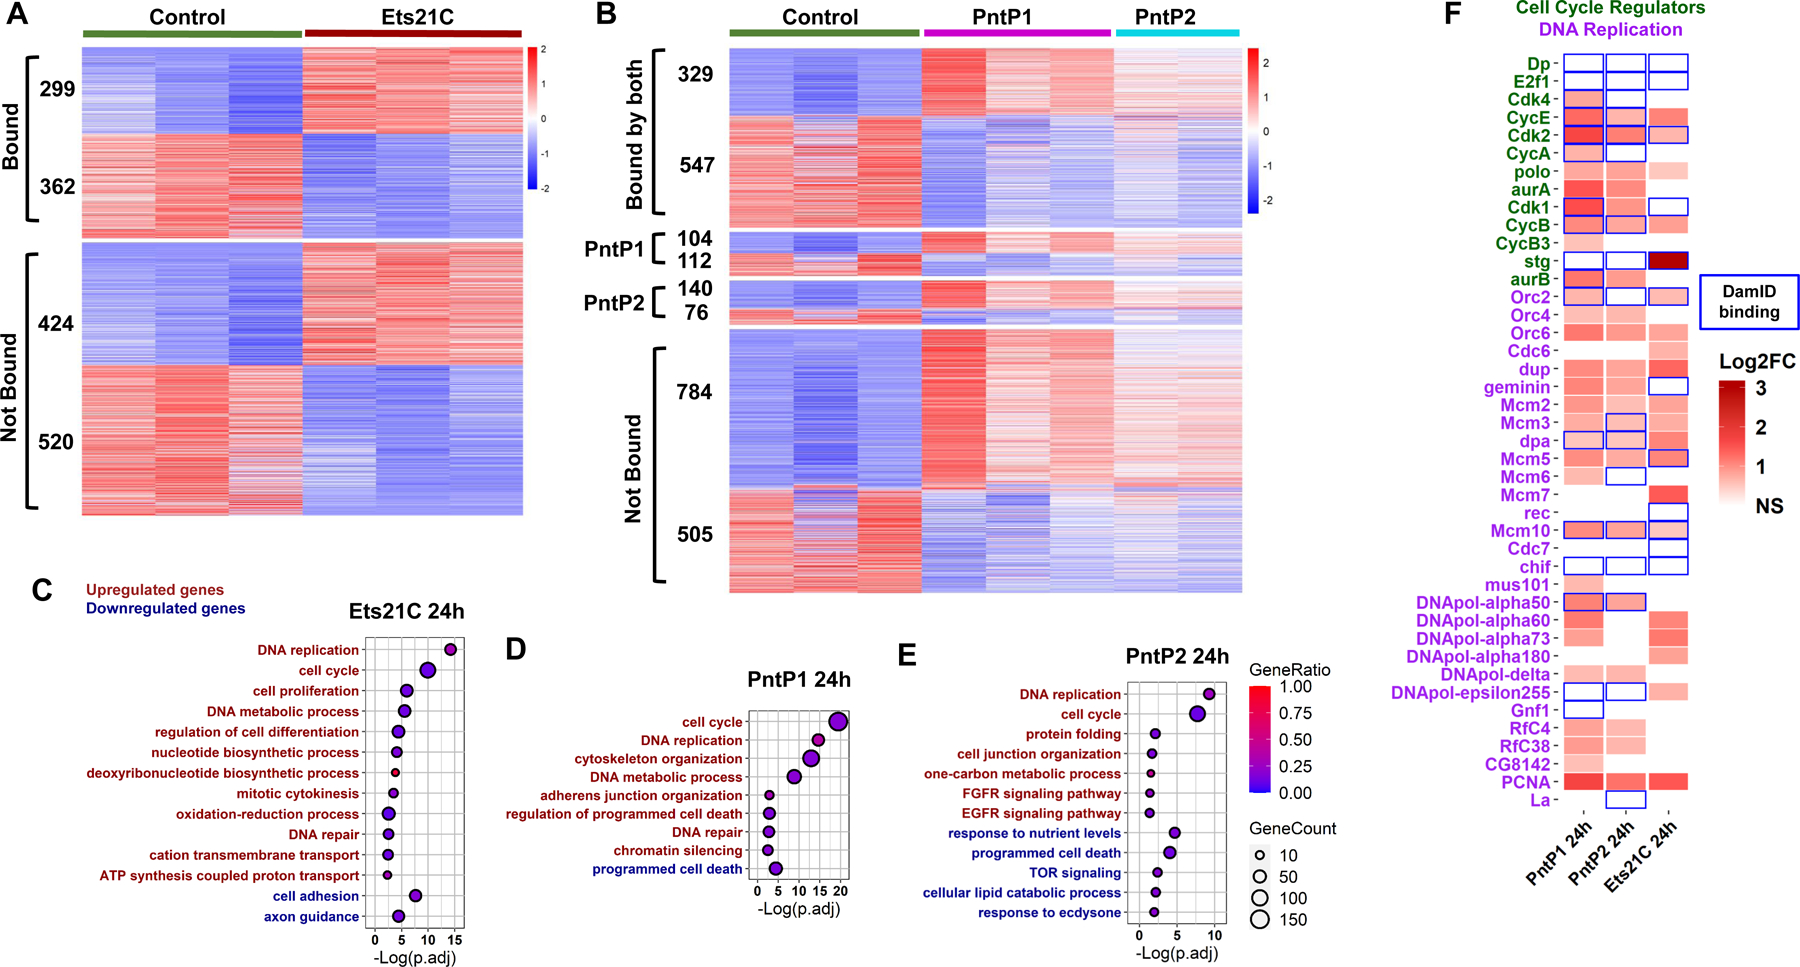
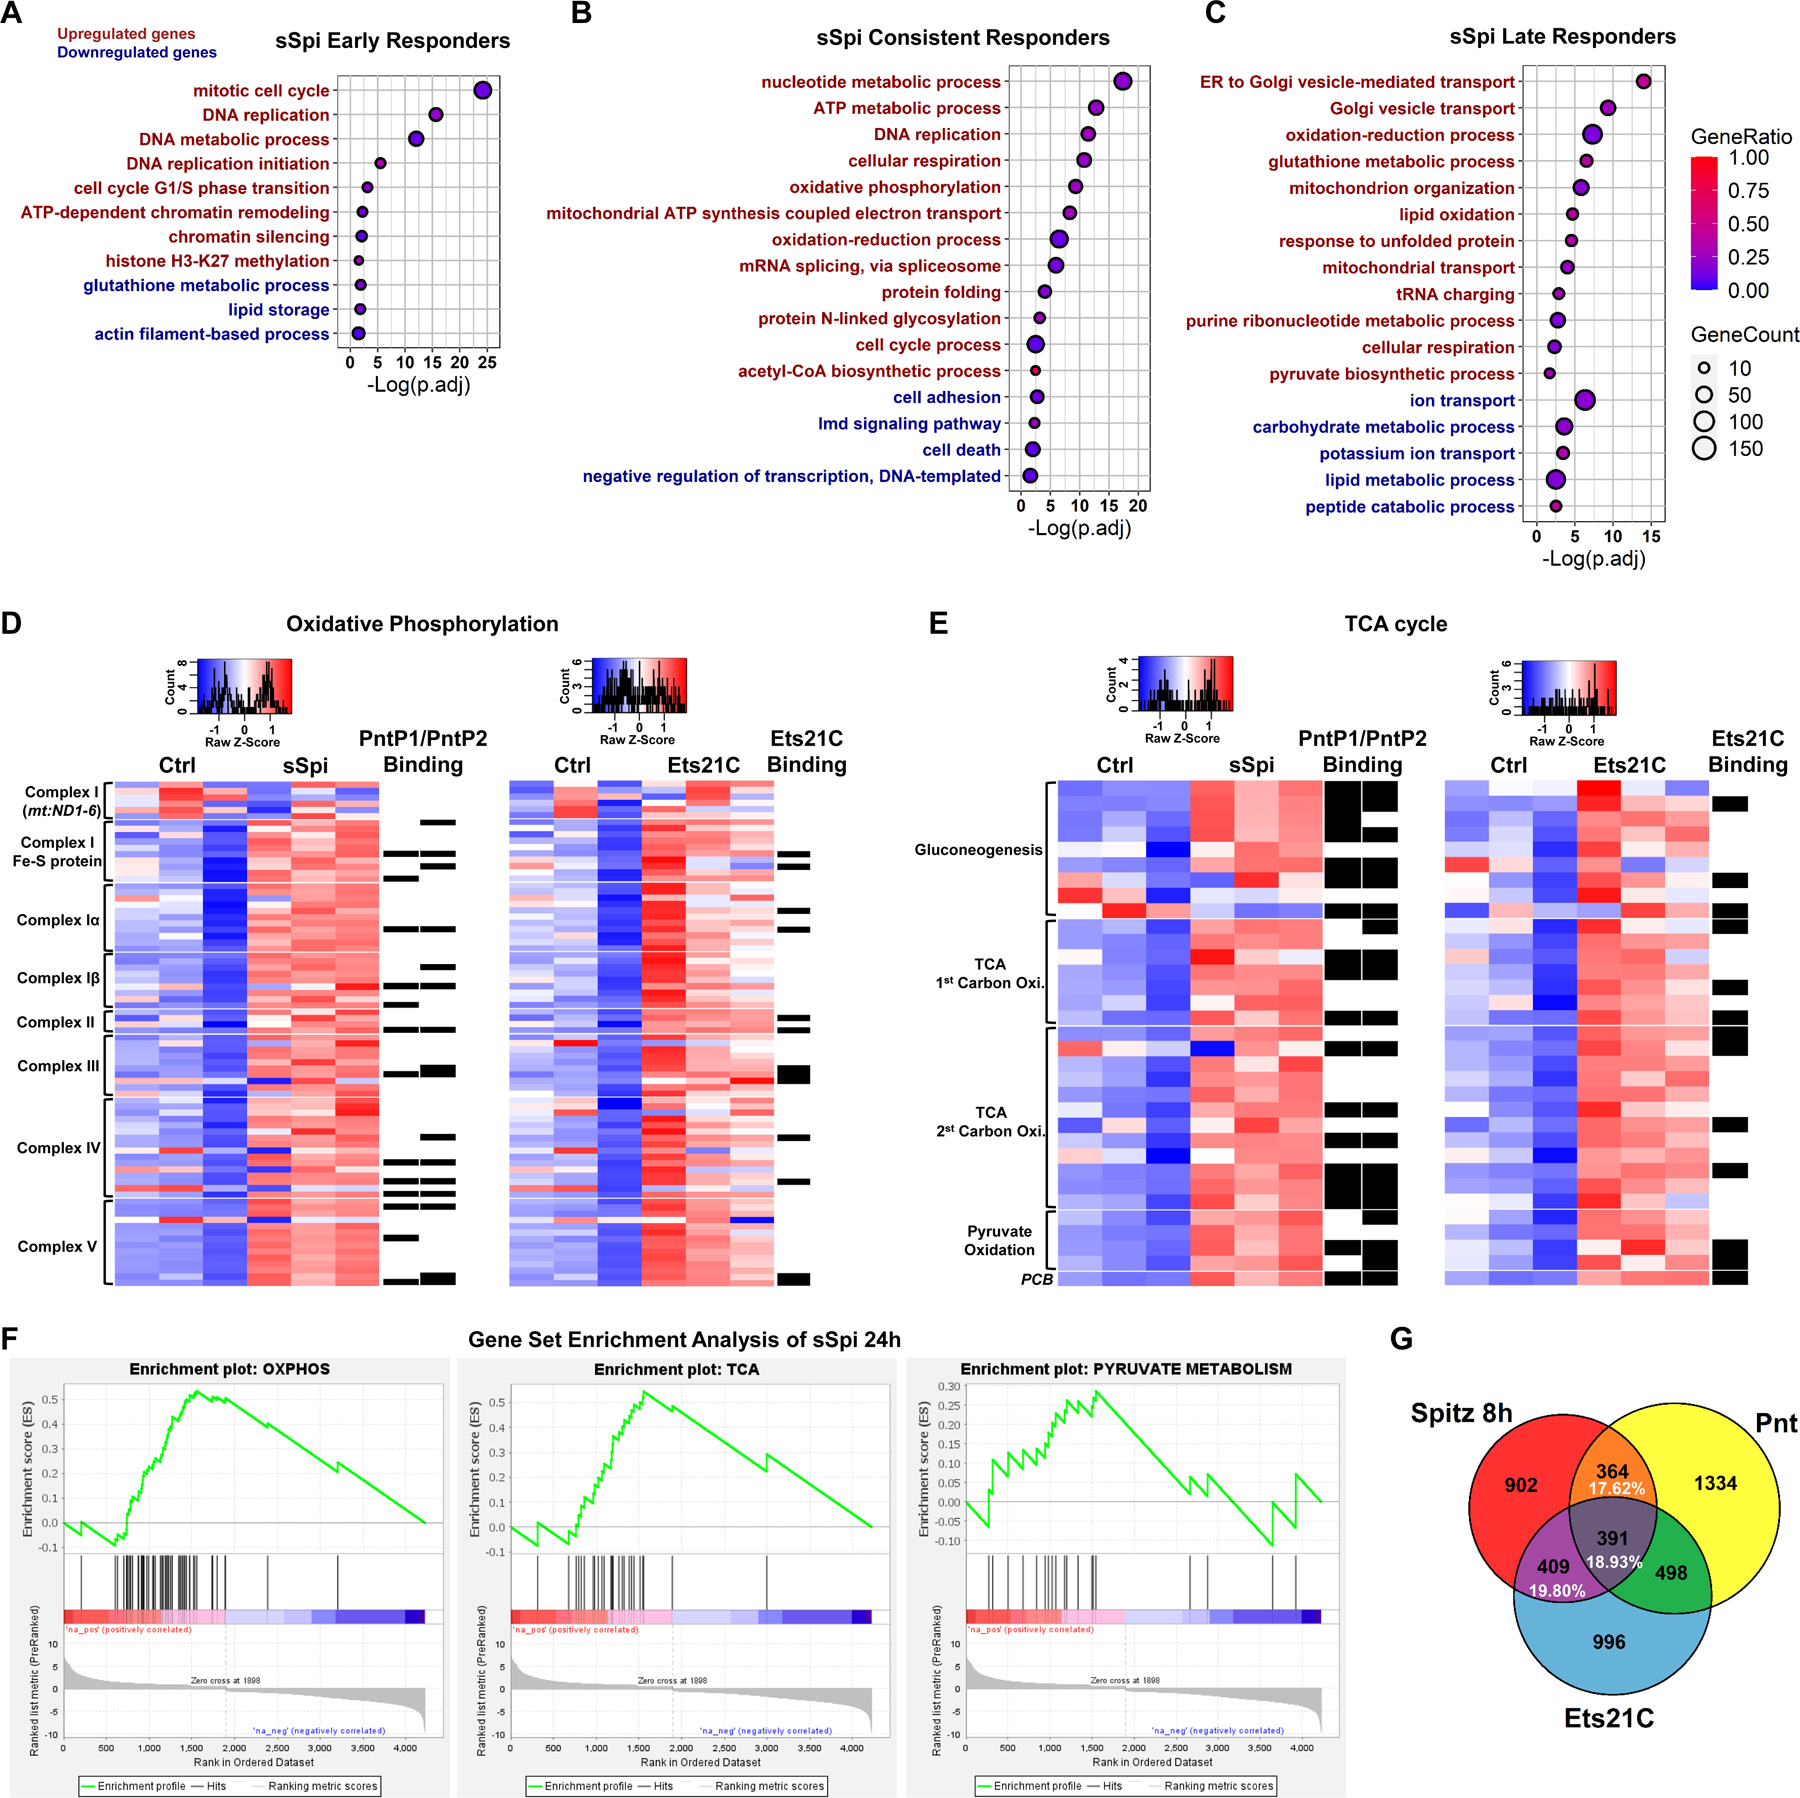
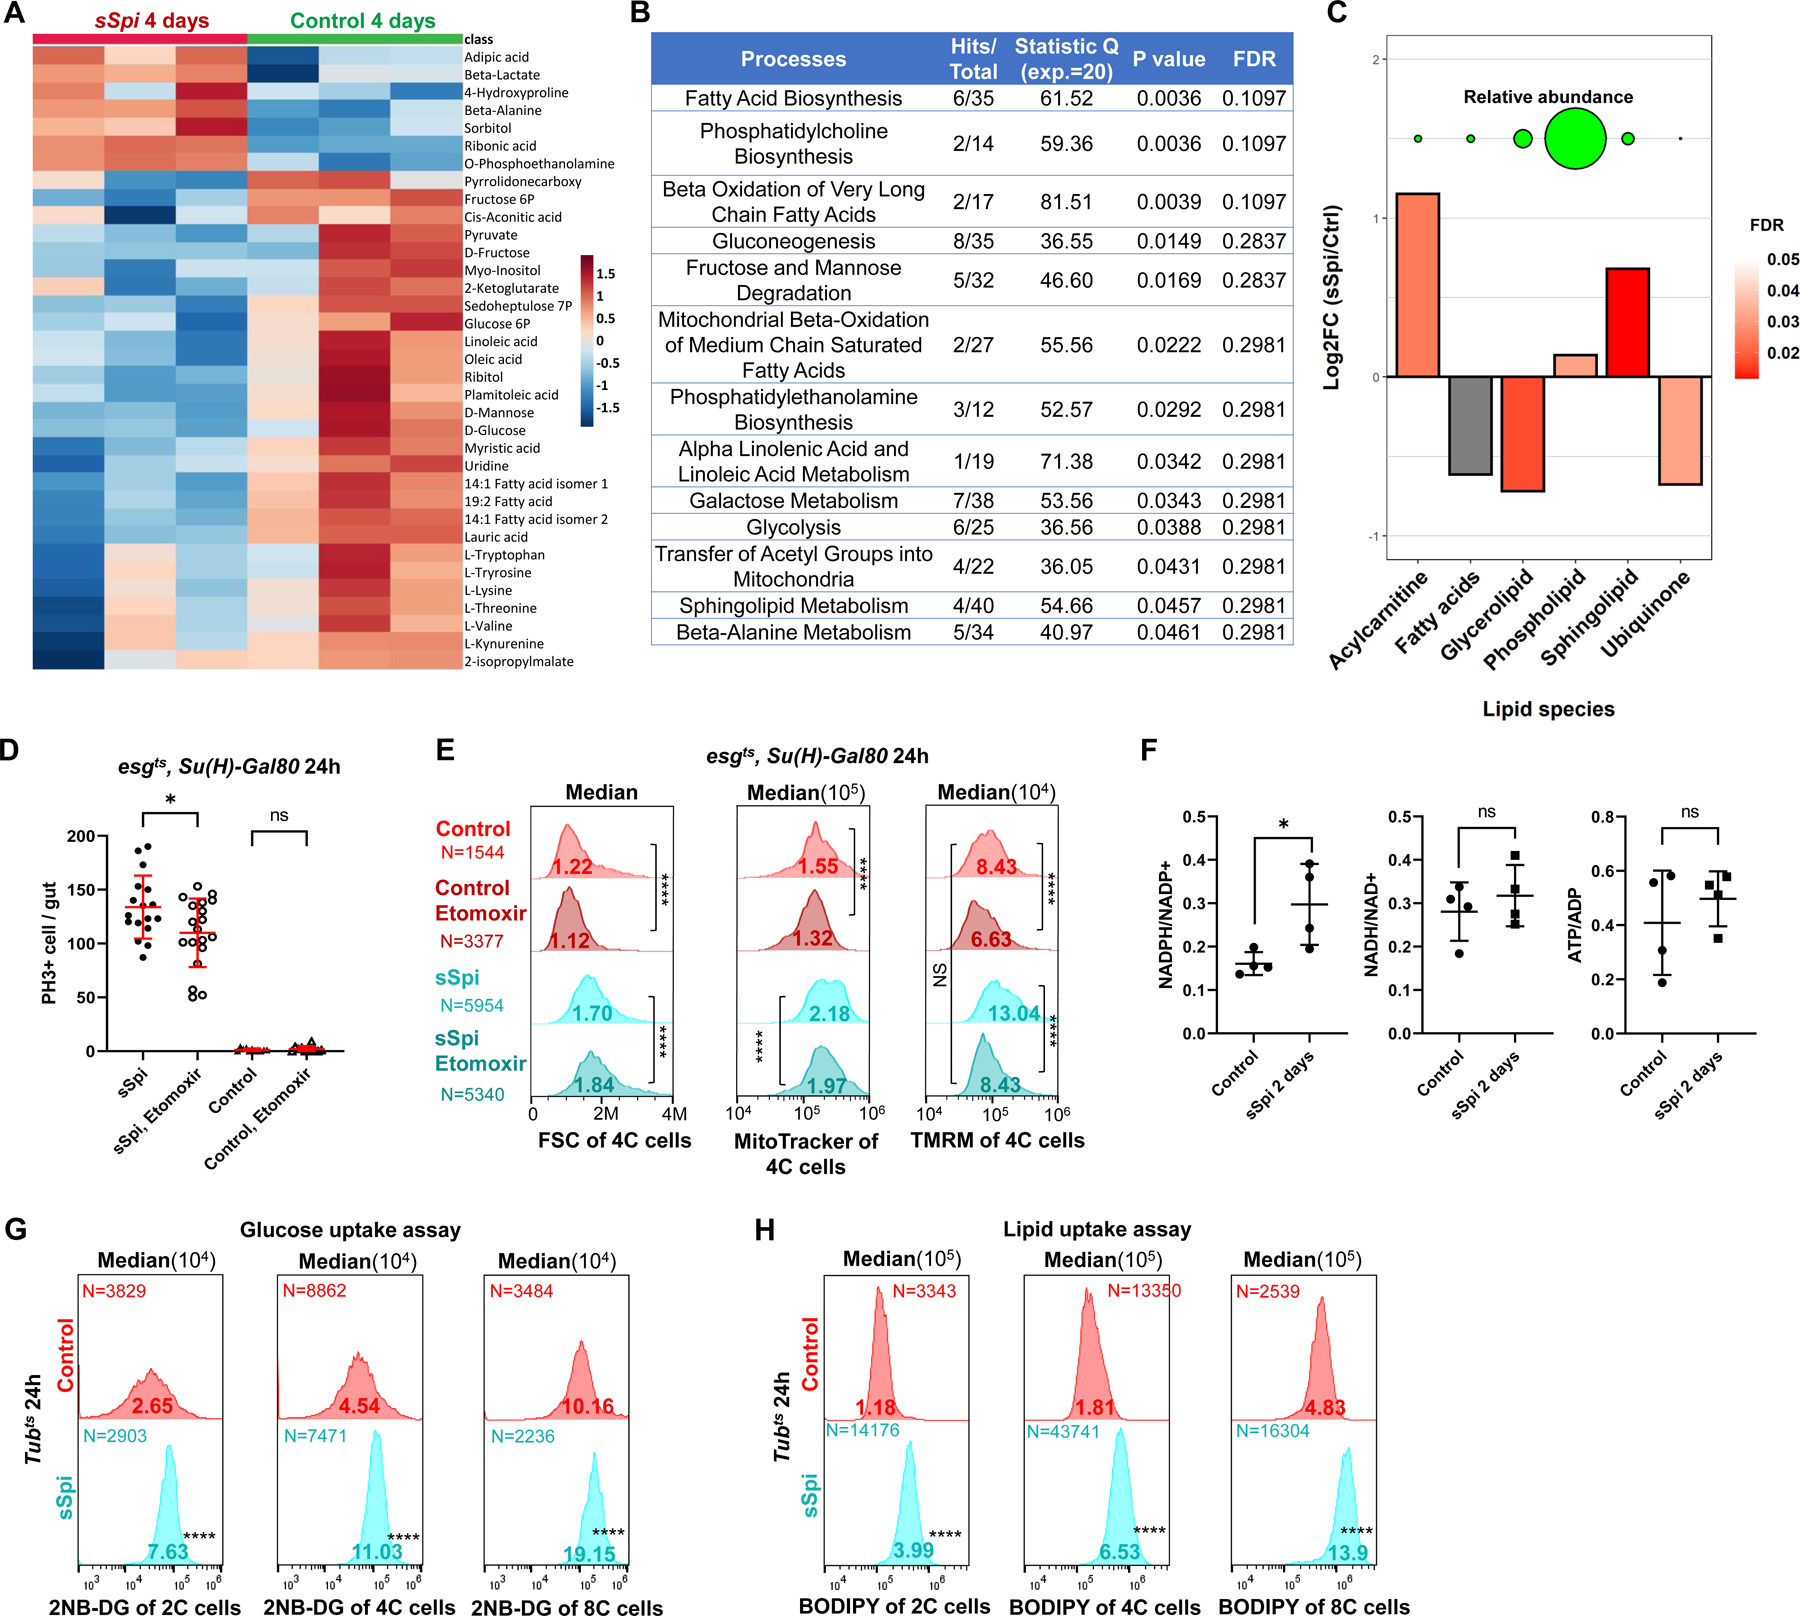
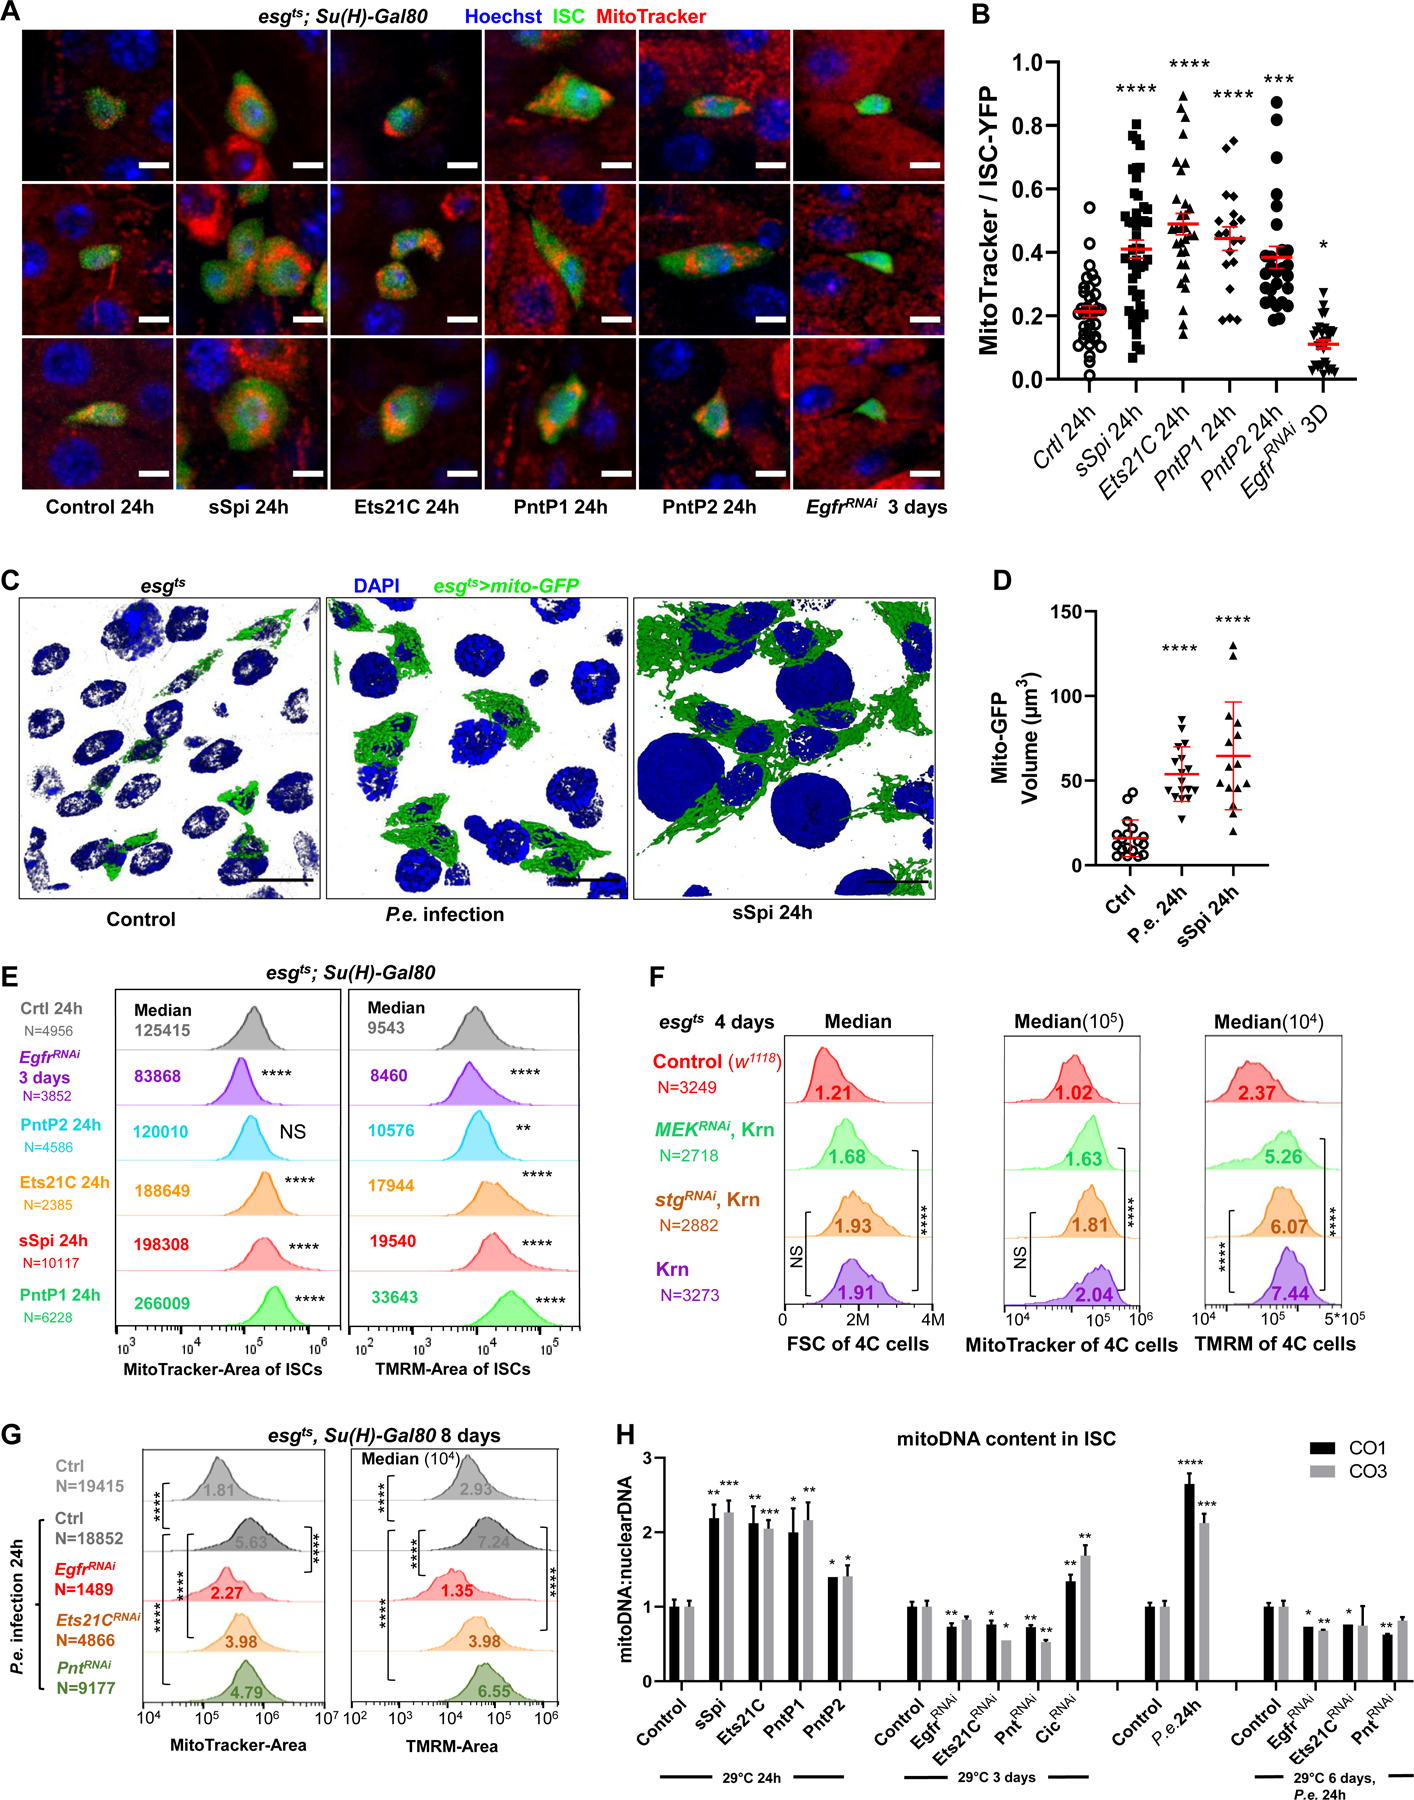
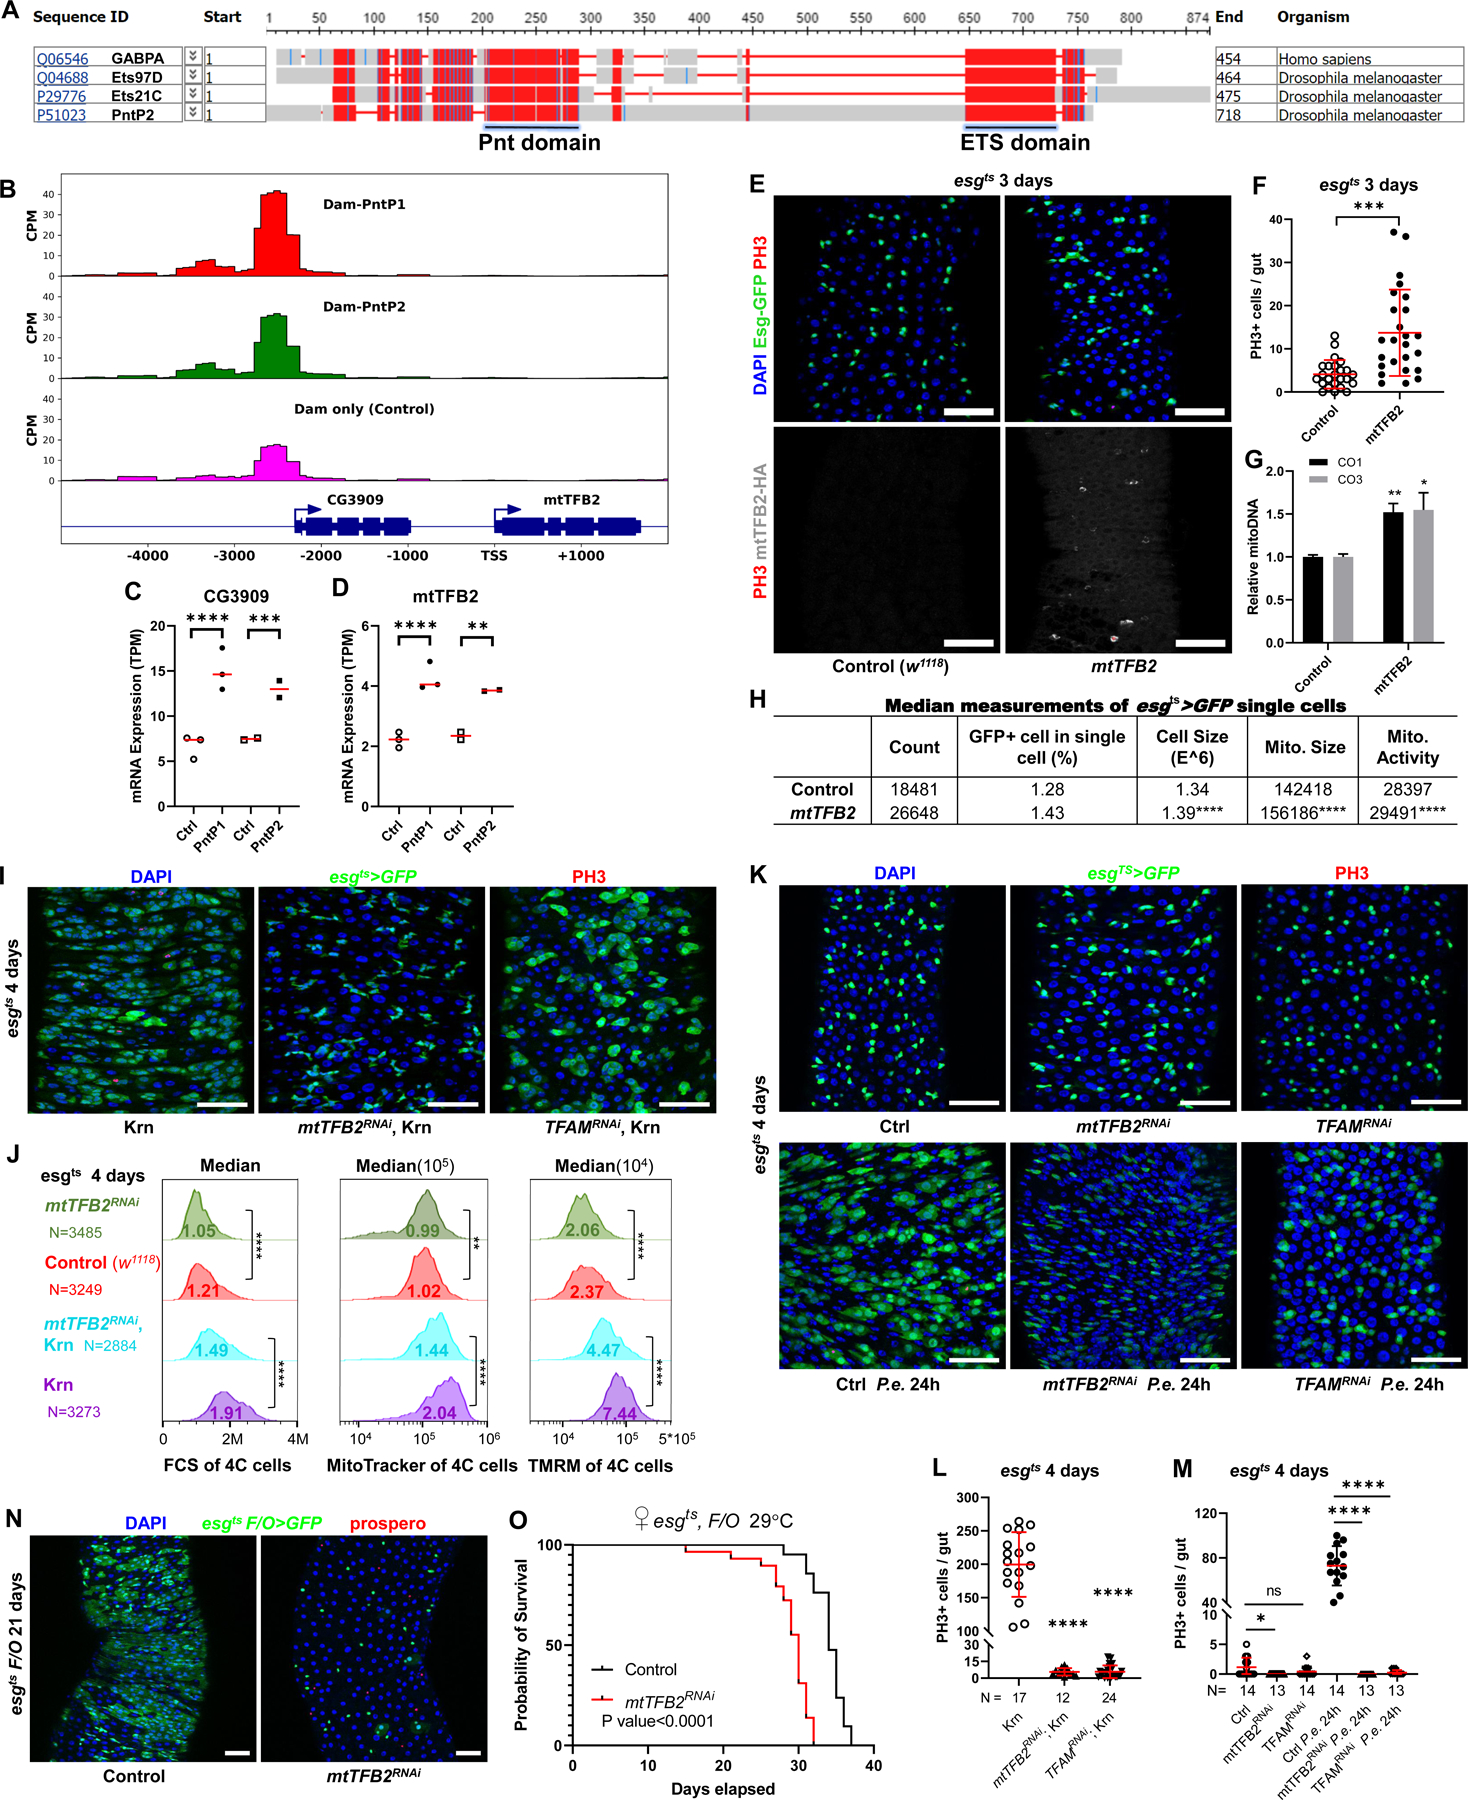
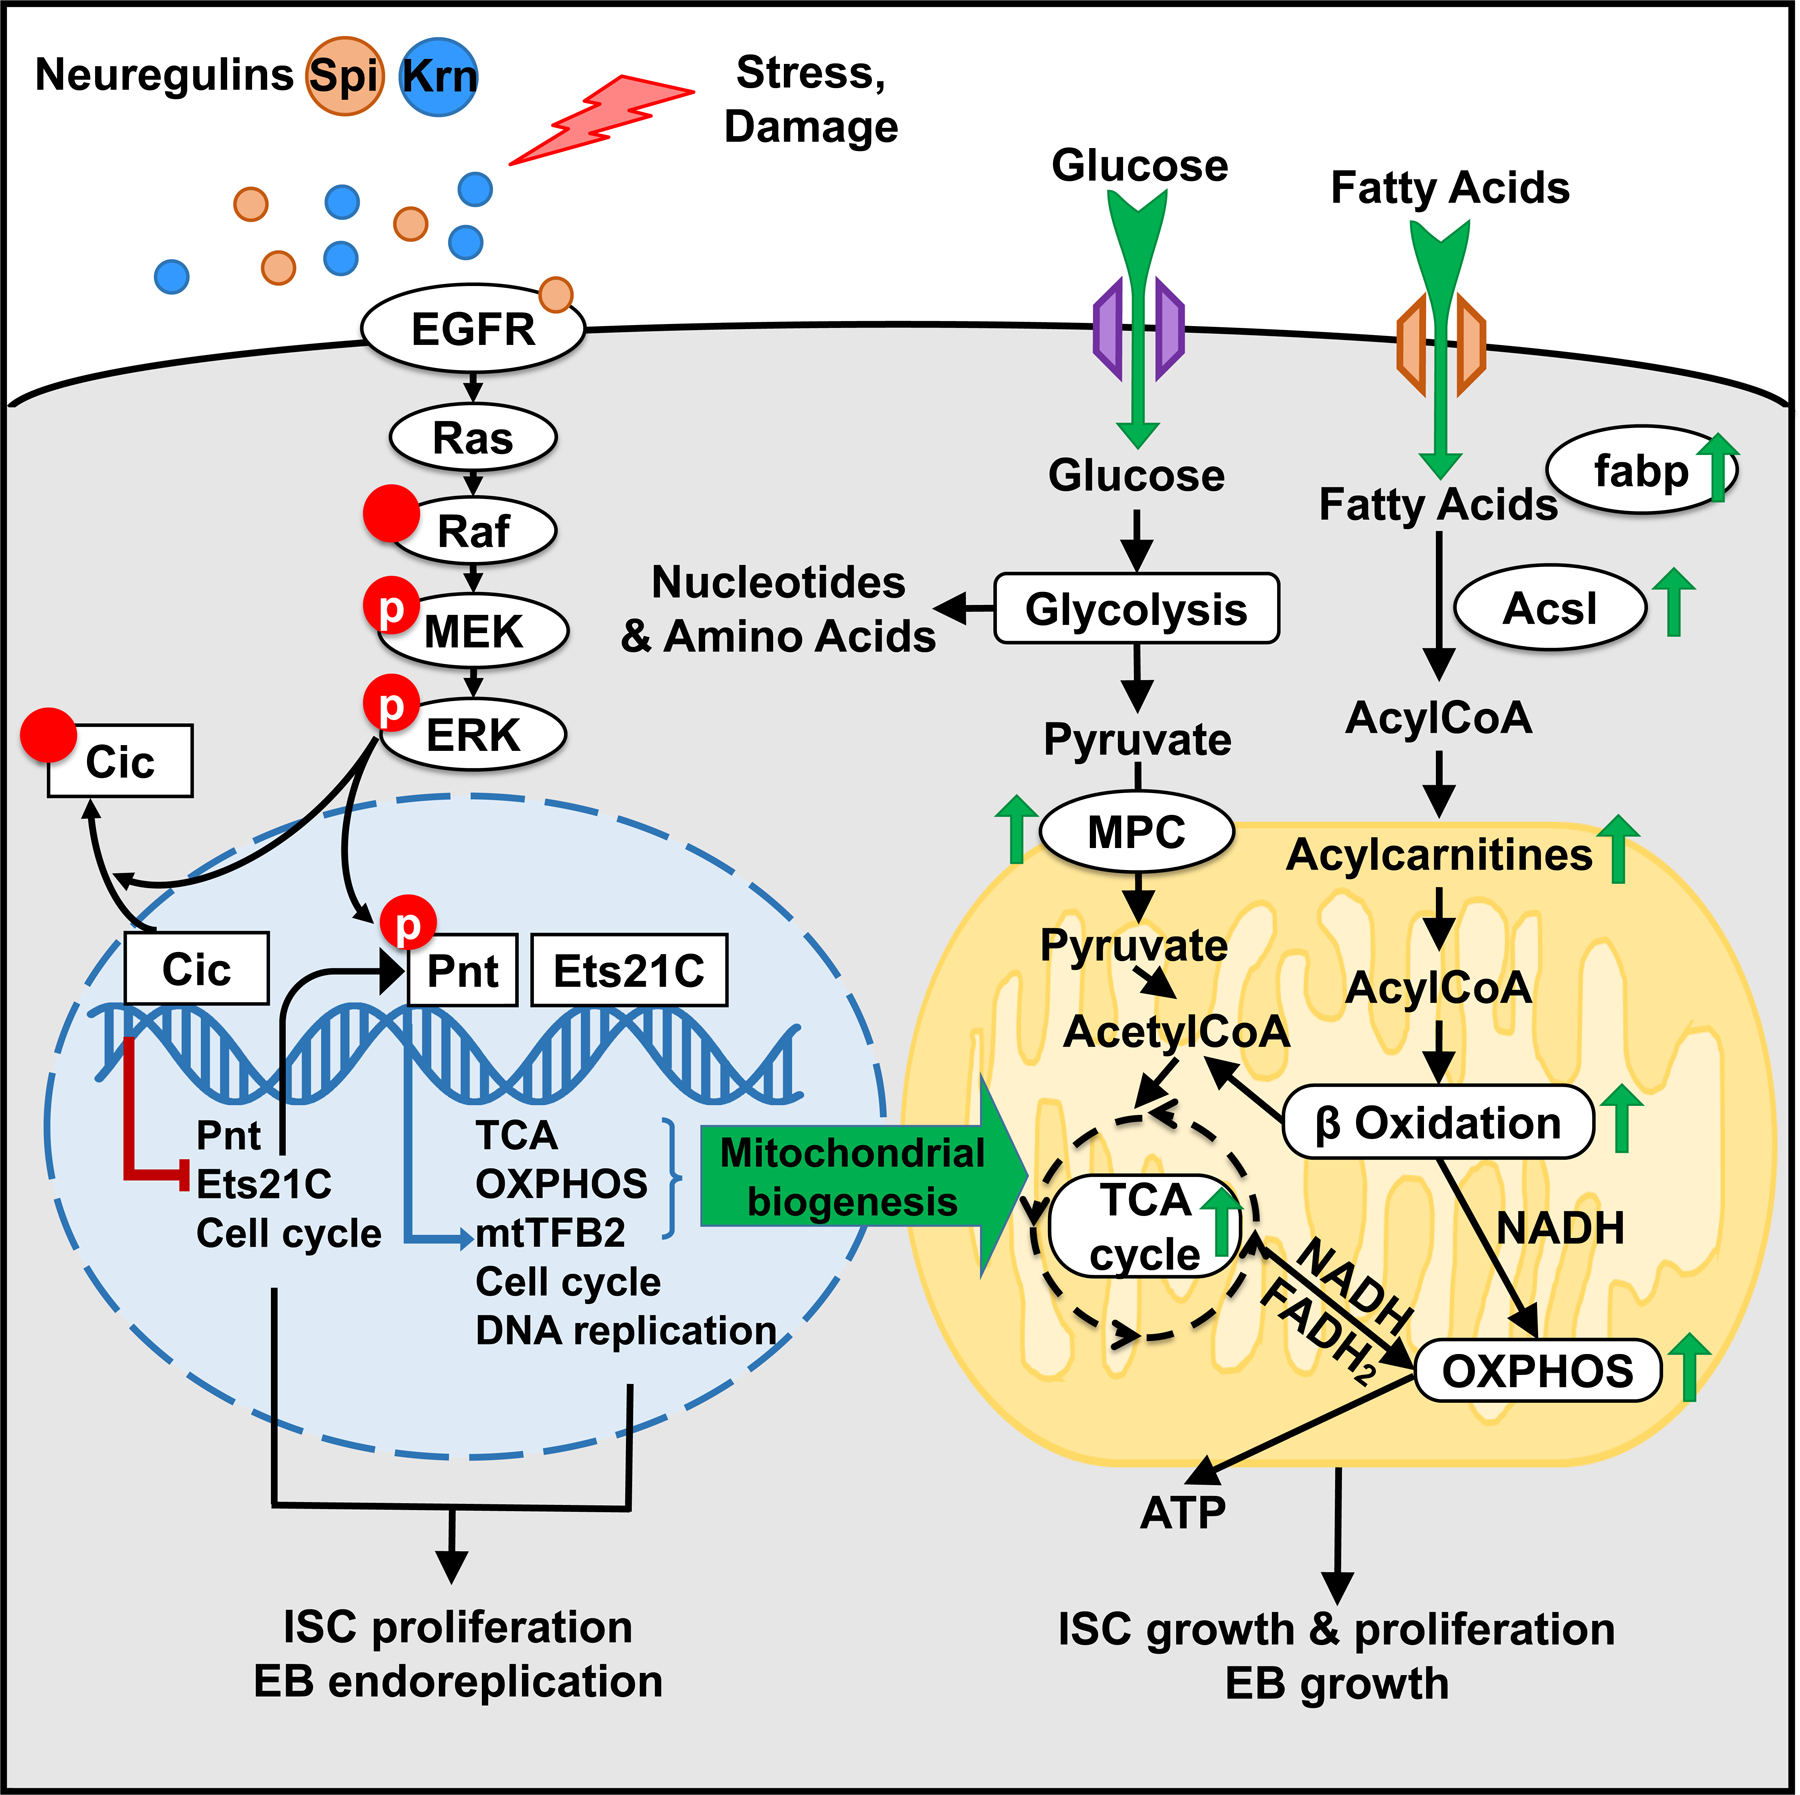
EGFR-RAS-ERK signaling promotes growth and proliferation in many cell types, and genetic hyperactivation of RAS-ERK signaling drives many cancers. Yet, despite intensive study of upstream components in EGFR signal transduction, the identities and functions of downstream effectors in the pathway are poorly understood. In Drosophila intestinal stem cells (ISCs), the transcriptional repressor Capicua (Cic) and its targets, the ETS-type transcriptional activators Pointed (pnt) and Ets21C, are essential downstream effectors of mitogenic EGFR signaling. Here, we show that these factors promote EGFR-dependent metabolic changes that increase ISC mass, mitochondrial growth, and mitochondrial activity. Gene target analysis using RNA and DamID sequencing revealed that Pnt and Ets21C directly upregulate not only DNA replication and cell cycle genes but also genes for oxidative phosphorylation, the TCA cycle, and fatty acid beta-oxidation. Metabolite analysis substantiated these metabolic functions. The mitochondrial transcription factor B2 (mtTFB2), a direct target of Pnt, was required and partially sufficient for EGFR-driven ISC growth, mitochondrial biogenesis, and proliferation. MEK-dependent EGF signaling stimulated mitochondrial biogenesis in human RPE-1 cells, indicating the conservation of these metabolic effects. This work illustrates how EGFR signaling alters metabolism to coordinately activate cell growth and cell division.

Keywords: Ets21C; ISC; Pointed; intestinal stem cell; mitochondrial biogenesis; mtTFB2; proliferation.


Conflict of interest statement

Declaration of interests The authors declare no competing interests.

Figures

Figure 1.
Figure 1.. EGFR signaling regulates ISC growth and division.
(A) Confocal images of posterior midguts, showing the induction of ISC proliferation and growth by EGFR signaling. Guts were stained with Phosphorylated Histone H3 (PH3) and DAPI. Top panels: 8h transgene induction in ISCs, showing a very low level of YFP fluorescent protein accumulation. Bottom panels: 24h induction. From left to right: control (w1118), sSpi OE, Ets21C-PC OE, PntP1 OE, and PntP2 OE. Scale bar is 50μM. (B) Quantification of PH3+ mitotic cells in whole guts. Both 8h and 24h activation of EGFR signaling led to significantly increased mitotic cell numbers, with 24h activation having a more robust proliferative effect. (C) Flow cytometry unit distribution of Forward Scatter (FSC) Area of YFP+ ISCs upon 24h activation of EGFR signaling by EGF ligand sSpi or downstream transcription factors Pnt and Ets21C. ISC cell size was increased by EGFR activation. (D-F) The requirements of EGFR signaling and downstream transcription factors Pnt and Ets21C for ISC proliferation and growth during tissue repair. (D) Confocal images of posterior midguts infected with Pseudomonas entomophila (P.e.). Guts were stained for PH3 and with DAPI. (E) The increase of mitotic cell numbers upon P.e. infection is dependent on EGFR signaling. (F) Flow cytometry unit distribution of FSC-Area of YFP+ ISCs in response to P.e. infection. EGFR signaling and transcription factors Pnt and Ets21C are required for ISC growth. (G-I) The growth effect of EGFR signaling is independent of proliferation, and depend on MEK-ERK cascade. (G) Confocal images of posterior midguts. Scale bar is 50μM. (H) Both Stg and MEK knockdown blocked ISC proliferation, (I) but only MEK knockdown blocked cellular growth. Violin plot showing ISC cell size. Thick line represents the median and thin lines represent quartiles. See also Figure S1. (*p<0.05, **p<0.01, ***p<0.001, ****p<0.0001; ns, not significant)
Figure 2.
Figure 2.. Pnt and Ets21C directly upregulate DNA replication and cell cycle genes.
(A-B) Heatmap showing the genes differentially expressed by 24h of (A) Ets21C-OE, (B) PntP1-OE or PntP2-OE in ISCs. Genes marked as “bound” (~40% of differentially expressed genes) had DamID peaks falling in the gene body (from transcription start site to termination site) or known regulatory regions (experimentally defined in vivo and collected in the RedFly database) of that gene. Transcripts per million (TPM) values were z-score normalized along rows before plotting. Genes were manually grouped by category. Within each category, genes were ordered based on decreasing average expression across samples. See also Table S1, Data S1 and Data S2. (C-E) Dot plots of selected Gene Ontology Biological Process Terms (GO-terms) enriched in response to Ets21C, PntP1, or PntP2 OE in ISC. For the full list of enriched GO-terms, see Data S3. Red labels indicate terms for significantly up-regulated genes, while green ones indicate terms for significantly down-regulated genes. The size of the dot indicates the gene count for the GO-terms, and the color indicates the proportion of genes in the GO term that are significantly differentially expressed. (F) Heatmap of Log2FC of cell cycle and DNA replication genes regulated by PntP1, PntP2, and Ets21C. Blue boxes indicate the presence of a direct DamID binding site or sites on the gene. See also Figure S2.
Figure 3.
Figure 3.. EGFR signaling up-regulates oxidative phosphorylation and TCA cycle genes in ISCs.
(A-C) Dot plot of selected enriched GO-terms of early, consistent, and late responder genes to sSpi over-expression, which are the genes significantly changed only at 8h, only at 24h, or at both 8h and 24h (with the same trend), respectively. For the full list of enriched GO-terms, see Data S4. Red indicates significantly enriched terms for the up-regulated gene set, while green indicates significantly enriched terms for the down-regulated gene set. The size of the dot indicates the gene count for the GO-term, and the color indicates the proportion of genes in the GO term that are significantly differentially expressed. (D-E) Heatmap of (D) OXPHOS and (E) TCA cycle genes after sSpi and Ets21C 24h over-expression. All genes with known function involved in metabolic pathways (KEGG dme00190 and dme00020) and expressed in ISCs were included. Black boxes on the right of the heatmaps indicate DamID binding for the specified TF. Transcripts per million (TPM) values were z-score normalized along rows before plotting. Genes were manually ordered. (F) Gene Set Enrichment Analysis of sSpi 24h differentially expressed genes showing OXPHOS, TCA, and Pyruvate Metabolism were significantly up-regulated. (G) Venn diagram shows that Pnt and Ets21C differentially expressed genes are essential for EGFR signaling early activation, making up to 56.35% of sSpi 8h transcription output. The overlap is significant, P=1.24e-276. See also Figure S3.
Figure 4.
Figure 4.. EGFR signaling reprograms ISC metabolism.
(A) GC-MS metabolomics profiling from 3×100 control midguts or midguts overexpressing sSpi in esg+ cells for 4 days. Heatmap of top 35 altered metabolites (Top 35 by P value). Raw data was log transformed and normalized by Pareto scaling, and then Z-scores were calculated across all samples. Each row represents one metabolite. For complete data see Data S5. (B) Enrichment analysis results of metabolomics following sSpi overexpression, from MetaboAnalystR. (C) Differences in abundance of major lipid classes after sSpi overexpression for 4 days. Y-axis represents log2 fold-changes between sSpi and control samples. For each class, mass-spectrometry peaks belonging to lipids in the class were summed. Values from control and sSpi-overexpression biological replicates were then compared via t-test. Significance is depicted by the bars’ color, with grey bars indicating that differences are not significant (p>0.05). Circles on top of the bar-plot depict the relative abundance of each lipid class in sSpi overexpression samples. For the full list of lipids, see Data S5. (D) EGFR signaling-induced ISC proliferation was repressed by CPT1 inhibition. Etomoxir (25μM), a CPT1 inhibitor, was mixed in fly food and fed to flies 36h prior to dissection. Etomoxir had no effect on control guts, but reduced mitotic cell number in sSpi-overexpressing guts. (E) Flow cytogram showing that EGFR signaling increased ISC mitochondrial membrane potential (TMRM staining), which was repressed by CPT1 inhibition. (F) The Ratios of redox and energy upon 2 days EGFR signaling activation by targeted metabolomics, NADPH/NADP+ was found to be increased. For complete data see Data S5. (G-H) Flow cytogram showing that EGFR signaling increased 2NE-DG (G) and BODIPY uptake; (H) fluorescent dodecanoic acid uptake in 2C, 4C, and 8C cells of midgut epithelial. See also Figure S4.
Figure 5.
Figure 5.. EGFR signaling regulates ISC growth by controlling mitochondrial biogenesis.
(A-B) Live-imaging of ISCts >YFP ISC cells (green), stained with Hoechst dye (blue), and MitoTracker dye (red). Scale bar is 5μM. The ratio of MitoTracker area to ISC-YFP area across all Z-slices of an ISC cell was calculated. Compared to controls, ISCs expressing sSpi, Ets21C, PntP1, or PntP2 for 24h had more MitoTracker stained areas relative to their cell size, while the ISCs expressing EgfrRNAi had less. (C-D) Mitochondria of progenitor cells marked by esgts >mito-GFP. The 3D re-construction of gut epithelia showed that after 24h P.e. infection or sSpi OE, the mitochondrial volume in the progenitor cells was significantly increased. Scale bar is 10μM. (E) Flow cytometry unit distribution of MitoTracker-Area and TMRM-Area of YFP positive ISCs upon activation or repression of EGFR signaling. In ISCs, sSpi, PntP1, PntP2, and Ets21C over-expression increased mitochondrial area and activity; EGFR knockdown decreased mitochondria area and activity. (F) Flow cytometry unit distribution of FSC-Area, MitoTracker-Area, and TMRM-Area of 4C state esg>GFP cells. The mitochondrial biogenesis effect of EGFR signaling is independent of proliferation, and dependent on MEK-ERK cascade. (G) Flow cytometry unit distribution of MitoTracker-Area and TMRM-Area of YFP positive ISCs. P.e. infection promoted mitochondria growth and activity, and required EGFR, Ets21C, and Pnt. (H) EGFR signaling affects Mitochondria DNA content in ISCs. Relative mitoDNA content was calculated using the DNA level of two mitochondria genes (CO1 and CO3) relative to two chromosomal genes (Ets21C and β-tub56D). qPCR was performed on total DNA samples extracted from sorted ISCs. Error bar represents SEM. See also Figure S5.
Figure 6.
Figure 6.. mtTFB2, a transcriptional target of Pnt, is required for ISC proliferation and cellular growth.
(A) COBALT Constraint-based multiple alignment (https://www.ncbi.nlm.nih.gov/tools/cobalt/cobalt.cgi) of human NRF2, Drosophila Ets97D, PntP2, and Ets21C protein showing the conserved Pnt and ETS domains. This is a column-based method that highlights highly conserved and less conserved columns based on amino acids’ relative entropy threshold. Alignment columns with no gaps are colored in red (highly conserved) or blue (less conserved). (B) DamID binding peaks (Significant peaks when compared to Dam alone control) of PntP1 and PntP2 upstream of mtTFB2 gene. (C-D) PntP1 and PntP2 up-regulated the expression of CG3909 and mtTFB2 by RNASeq. (E-F) mtTFB2 is sufficient to mildly induce ISC proliferation. Confocal images of posterior midgut. Guts were stained for GFP (green), PH3 (red), mtTFB2-HA (white), and with DAPI (blue). mtTFB2-HA protein localized distinctly in mitochondria. Scale bar is 50μM. (G) Over-expression of mtTFB2 increased mitochondria DNA content in ISCs. Relative mitoDNA content was calculated using the DNA level of two mitochondria genes (CO1 and CO3) relative to two chromosomal genes (Ets21C and β-tub56D). qPCR was performed on total DNA samples extracted from sorted ISCs. Error bar represents SEM. (H) FACS showed mtTFB2 OE increased the percentage of esgts>GFP cell in total single live cell. The FCS-Area, MitoTracker-Area, and TMRM-Area of esg+ cell over-expressing mtTFB2 were increased. (I) Knockdown of mtTFB2 or TFAM was sufficient to block proliferation induced by Krn. Confocal images of posterior midguts. Guts were stained for PH3 (red), GFP (green), and with DAPI (blue). Scale bar is 50μM. (J) Flow cytometry unit distribution of FSC-Area, MitoTracker-Area, and TMRM-Area of 4C state esgts>GFP cells. mtTFB2 knockdown impacted cell size, mitochondria size and activity in both physiological conditions and upon EGFR signaling activation. (K) mtTFB2 and TFAM are necessary for ISC proliferation induced by P.e. infection. Confocal images of posterior midguts, with and without P.e. infection. Scale bar is 50μM. (L-M) Quantification of PH3 positive cells in whole guts. (N) Image of esgts F/O driving mtTFB2 knockdown for 21 days, showing that clone formation requires mtTFB2. Scale bar is 50μM. (O) Survival assay showing that mtTFB2 knockdown in the esg lineage significantly reduced the life span of flies. See also Figure S6.
Figure 7.
Figure 7.. Effects of EGFR signaling on ISC gene expression and metabolism.
We show the effects of upregulating EGFR signaling in the ISC nucleus (blue), mitochondrion (yellow), and cytoplasm (grey). Green arrows indicate example processes, gene products, and metabolites that are up-regulated by EGFR signaling in response to the EGFR-dependent transcription factors Cic, Pnt and Ets21C.

Comment in

References

    1. Biteau B, and Jasper H (2011). EGF signaling regulates the proliferation of intestinal stem cells in Drosophila. Development 138, 1045–1055. - PMC - PubMed
    1. Buchon N, Broderick NA, Kuraishi T, and Lemaitre B (2010). DrosophilaEGFR pathway coordinates stem cell proliferation and gut remodeling following infection. BMC Biology 8, 152. - PMC - PubMed
    1. Jiang H, Grenley MO, Bravo M-J, Blumhagen RZ, and Edgar BA (2011). EGFR/Ras/MAPK Signaling Mediates Adult Midgut Epithelial Homeostasis and Regeneration in Drosophila. Cell Stem Cell 8, 84–95. - PMC - PubMed
    1. Xu N, Wang SQ, Tan D, Gao Y, Lin G, and Xi R (2011). EGFR, Wingless and JAK/STAT signaling cooperatively maintain Drosophila intestinal stem cells. Developmental Biology 354, 31–43. - PubMed
    1. Basak O, Beumer J, Wiebrands K, Seno H, van Oudenaarden A, and Clevers H (2017). Induced Quiescence of Lgr5+ Stem Cells in Intestinal Organoids Enables Differentiation of Hormone-Producing Enteroendocrine Cells. Cell Stem Cell 20, 177–190.e4. - PubMed

Publication types

MeSH terms