. 2022 Oct 21;40(10):932-948.
doi: 10.1093/stmcls/sxac048.

Single-Cell RNA-Seq Identifies Dynamic Cardiac Transition Program from ADCs Induced by Leukemia Inhibitory Factor

Affiliations

Single-Cell RNA-Seq Identifies Dynamic Cardiac Transition Program from ADCs Induced by Leukemia Inhibitory Factor

Jiayi Yao et al. Stem Cells. .

Abstract

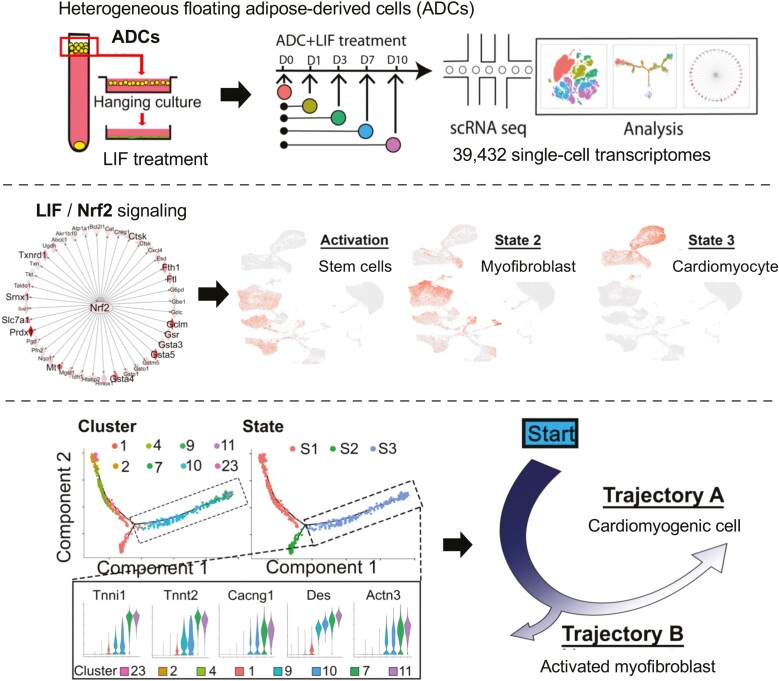
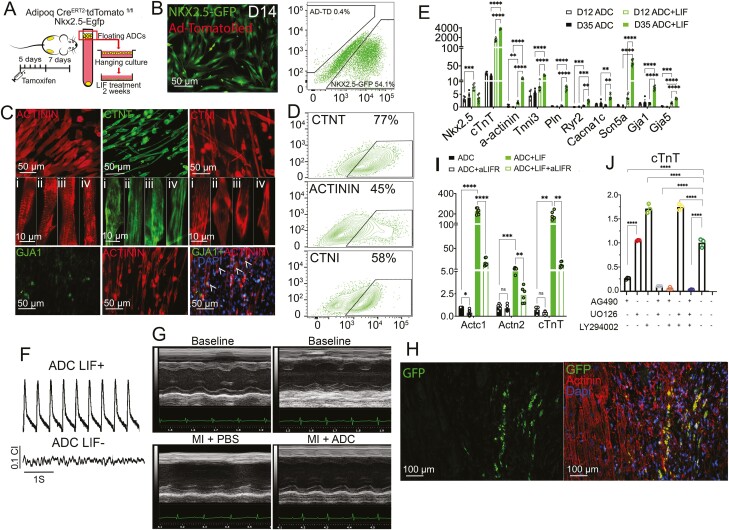
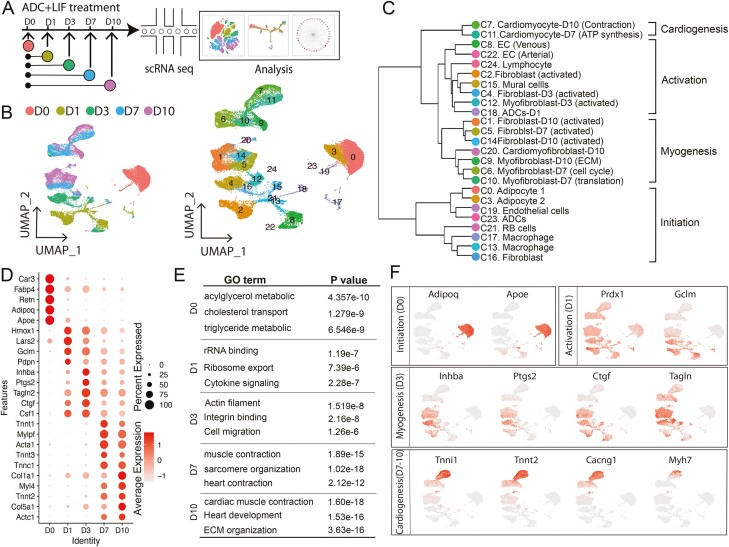
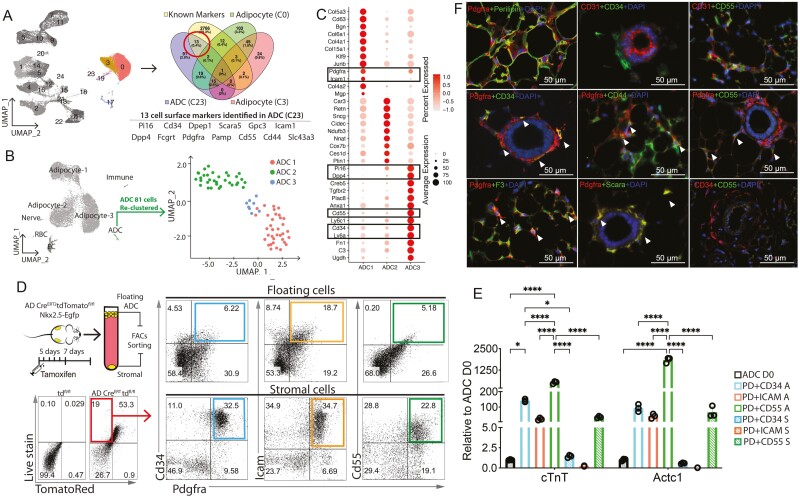
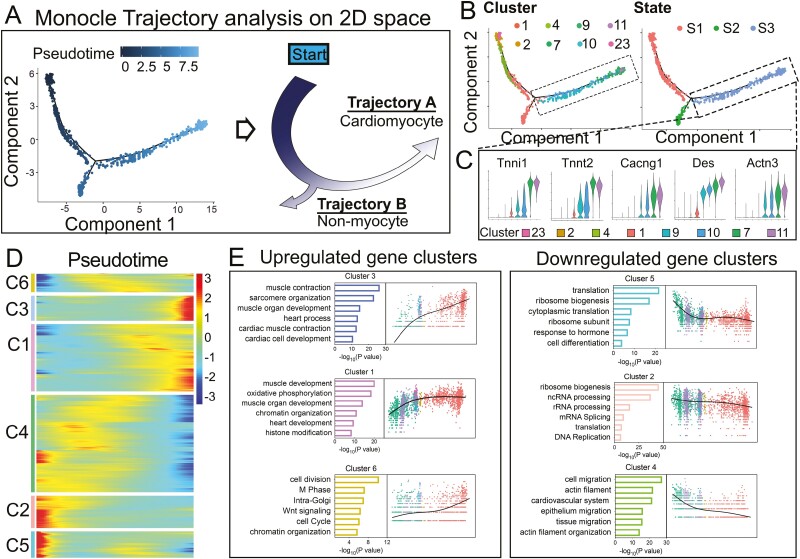
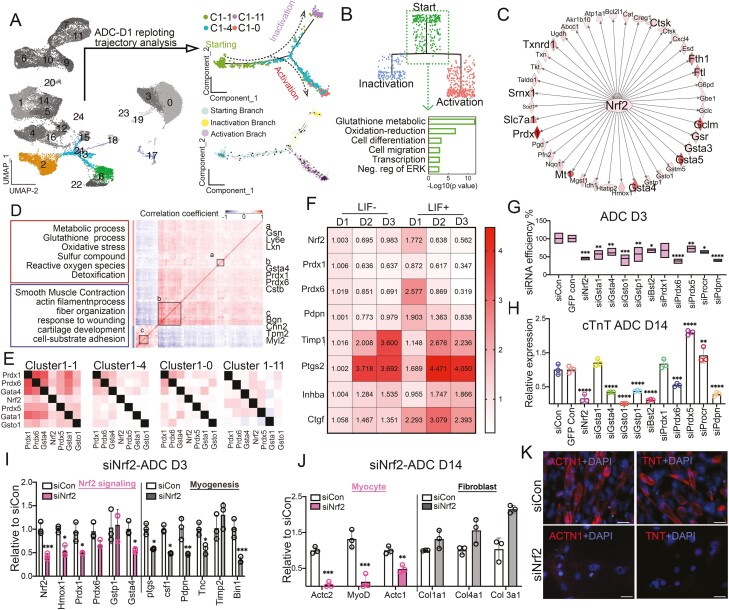
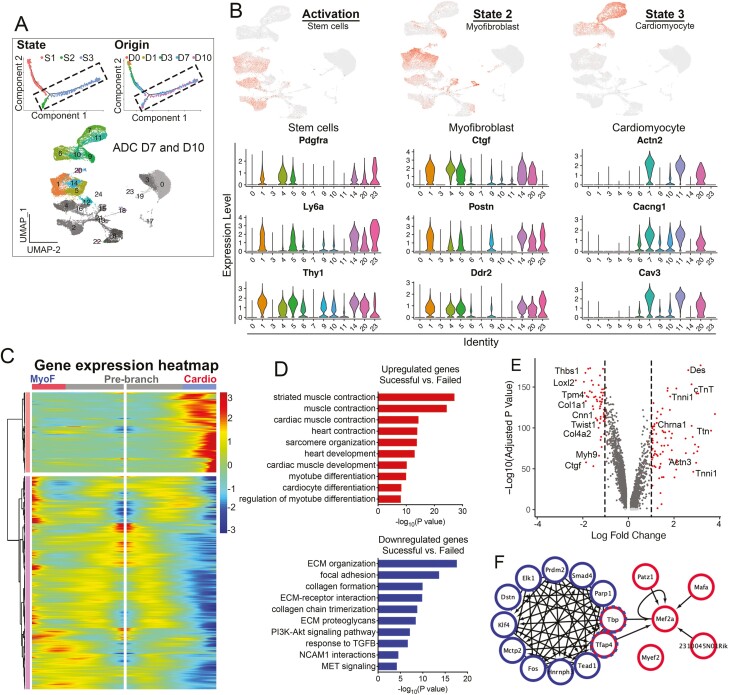
Adipose-derived cells (ADCs) from white adipose tissue are promising stem cell candidates because of their large regenerative reserves and the potential for cardiac regeneration. However, given the heterogeneity of ADC and its unsolved mechanisms of cardiac acquisition, ADC-cardiac transition efficiency remains low. In this study, we explored the heterogeneity of ADCs and the cellular kinetics of 39,432 single-cell transcriptomes along the leukemia inhibitory factor (LIF)-induced ADC-cardiac transition. We identified distinct ADC subpopulations that reacted differentially to LIF when entering the cardiomyogenic program, further demonstrating that ADC-myogenesis is time-dependent and initiates from transient changes in nuclear factor erythroid 2-related factor 2 (Nrf2) signaling. At later stages, pseudotime analysis of ADCs navigated a trajectory with 2 branches corresponding to activated myofibroblast or cardiomyocyte-like cells. Our findings offer a high-resolution dissection of ADC heterogeneity and cell fate during ADC-cardiac transition, thus providing new insights into potential cardiac stem cells.

Keywords: ADC; adipose; cardiac transition; cell sequencing; derived cells; leukemia inhibitory factor (LIF); single.


Figures

None
Graphical abstract
Figure 1.
Figure 1.
LIF Induces ADC-Cardiac Transition. (A) Schematic of experimental design for collecting floating ADCs from Adipoq CreERT2-tdTomatofl/flNkx2.5-Egfp mouse (see details in Methods). (B) Immunofluorescence and flow cytometry of AD-TD (Adipoq CreERT2-tdTomato)+ and Nkx2.5-GFP+ cells 14 days (D14) and 6 days, respectively, post-LIF treatment of ADCs. (C,D) Representative immunofluorescence (C) and flow cytometry (D) of ADC-derived cardiomyocyte-like cells for α-ACTININ (sarcomere marker, red), CTNT (cardiac troponin T, green), CTNI (cardiac troponin I, red), and GJA1 (Gap junction α-1 protein, green) after LIF treatment for 21 days. Arrowheads indicate GJA1 and α-ACTININ double-positive cells. (E) Expression of cardiac markers in ADCs at day (D)12 and D35 with or without LIF treatment, as shown via real-time PCR. Gene expression is calculated as fold change compared with the ADCs on day 0 (n=6). (F) Representative traces of spontaneous beating activity of monolayer ADC-derived cardiomyocyte-like cells with or with our LIF recorded with impedance system. (G) Functional assessment of before (baseline) and 21 days after MI and injection of FBS or ADC-cardiomyocyte-like cells. See Supplementary Figure S4 for additional results. (H) Dual immunofluorescence detection of GFP+/ α-ACTININ ADC-derived cardiomyocyte-like cells at 21 days after MI at the mid-infarct level. Arrowheads show GFP and α-ACTININ double-positive cells. (I) Expression of Actc1, Actn2, and cTnT in ADCs at D10 after blocking LIFR using anti-LIFR neutralizing antibody, as shown via real-time PCR. Gene expression is calculated as fold change compared with the ADCs without treatment (n=6). (J) Expression level of cTnT in ADCs at day (D)10 after blocking of LIF signaling after exposure to vehicles AG490, UO126, and LY294002, examined using real-time PCR. Gene expression is calculated as fold change compared with the ADCs without treatment (n=3). In (E), (I), and (J), data are shown by mean ± SEM. Two way ANOVA, *P < .05, **P < .01, ***P < .001, ****P < .0001.
Figure 2.
Figure 2.
High-resolution dissection of ADC-cardiac transition using scRNA-Seq. (A) Schematic diagram of scRNA-seq analysis strategy during ADC-cardiac transition. Overall, 10 545, 6460, 5087, 7673, and 9667 cells were analyzed for ADC day (D)0, ADC D1, ADC D3, ADC D7, and ADC D10 (indicated by different colors), respectively. The flow chart of the scRNA-seq analysis was adopted from 10x Genomics. (B) UMAP projection of all 39 432 individual cells during the ADC-cardiac transition process, colored by origin (left) and each subpopulation based on the transcriptomic phenotype (right). (C) Hierarchal clustering analysis of all clusters from scRNA-seq. (D) Expression of top genes at the indicated time points. (E) Gene ontology (GO) analysis of genes specifically expressed in the indicated time points. (F) UMAP projection of cells and typical gene expression at the indicated time points.
Figure 3.
Figure 3.
Identification of LIF responsive ADCs from AD-D0. (A) UMAP (colored) highlighted 10,545 ADC cells from day (D)0 (left) were analyzed to identify cell surface markers. Venn diagram indicating the number of differentially (FDR <0.01) expressed genes across ADC cluster C23, adipocyte cluster C0, adipocyte cluster C0, and published cell surface makers and the overlap between each set of genes. A total of 13 markers were identified as ADC C23-specific expressed cell surface markers. (B) UMAP from AD-D0 highlighting the ADC cluster and reclustered at right. (C) Expression of top genes in the indicated ADC clusters. (D) AD-TD negative and Hoechst 33342-positive populations from floating ADCs and stromal cells were further analyzed in Pdgfrα+CD34+, Pdgfrα +Icam1+, and Pdgfrα+CD55+ populations. (E) Expression of cardiac markers in FACS sorted Pdgfrα+CD34+, Pdgfrα +Icam1+, and Pdgfrα+CD55+ floating ADCs (A) and stromal cells (S) 28 days post-LIF treatment, as shown via real-time PCR (n = 3). Data are shown by mean ± SEM. Two-way ANOVA, *P < .05, ***P < .001, ****P < .0001. (F) Immunostaining of identified cell surface markers in mouse subcutaneous fat tissue. Arrowheads indicate double-positive cells. Scale bars = 50 μm.
Figure 4.
Figure 4.
Reconstruction of ADC-cardiac transition trajectory in a pseudotime manner. (A) The arrangement of cells on the tree (left) shows that cells on the left side of the tree (dark blue) are less differentiated than those on the right side (light blue). Based on the pseudotime, the schematic diagram (right) indicates the transition direction. (B) Cells on the trajectory tree are colored by cluster assignment and state. (C) Violin plot displaying the expression of representative cardiac markers in state 3. (D) Heatmap to display differentially expressed gene (DEG) clusters along the pseudotime trajectory. (E) GO analysis and signature gene expression dynamics in each cell cluster.
Figure 5.
Figure 5.
Identification of Nrf2 signaling pathway in initiation of ADC-cardiac transition fate triggered by LIF. (A) UMAP (colored) highlighted 6460 ADC cells from day (D)1 (left) were replotted and further analyzed ADC populations by Monocle 2 and RNA velocity. Arrows in RNA velocity (lower right) indicated the direction of the average velocity at a grid of points along the trajectory. (B) GO analysis (lower) of starting branch identified by dendrogram plots from the hierarchical clustering (upper). (C) Gene correlation network in cardiac transition stage identified Nrf2 signaling predicted by ingenuity pathway analysis (IPA). (D) Heatmaps showing Pearson correlation coefficient and representative GO terms enriched in positively or negatively correlated target genes, whose expression significantly correlated (P < .05) to Nrf2. (E) Coexpression measured by redundant Jaccard index clustering of Nrf2 signaling genes in clusters C1-1, C1-4, C1-0, and C1-11. (F) Heatmap of Nrf2 signaling expression level along LIF treatment time course via qPCR. (G) ADCs were transfected with siRNAs (5 nM) at D0. Cells were lysed on day 3 and real-time RT-PCR was performed using the indicated TaqMan gene expression assays. Knockdown data are expressed relative to data from cells transfected with control siRNA (n = 3). (H) Expression of cTnT in ADCs at D14 with siRNAs, as shown by real-time PCR (n = 3). Gene expression is calculated as fold change compared with the siCON ADCs at D14. (I) Expression of Nrf2 signaling and myogenic markers in ADCs at D3 with siNrf2, as shown via real-time PCR (n = 3). Gene expression is calculated as fold change compared with the siCON ADCs at D3. (J) Expression of myocyte and fibroblast markers in ADCs at D14 with siNrf2, as shown by real-time PCR (n = 3). Gene expression is calculated as fold change compared with the siCON ADCs at D14. (K) Representative ICC staining of ADC-derived cardiomyocyte-like cells for ACTN1(red) and TRIT (red) in ADCs with or without siNrf2. Scale bar = 50 μm. In (G), (H), (I), and (J), data are shown as mean ± SEM. One-way ANOVA, *P < .05, **P < .01, ***P < .001, ****P < .0001.
Figure 6.
Figure 6.
Molecular census of myofibroblast and cardiomyocyte stages. (A) Cells on the Monocle trajectory tree colored by state and time point origin (upper). UMAP (colored) highlighted 7673 ADC cells with D7 color, and 9667 ADC cells with D10 color (lower). (B) Expression of select genes in populations from different stages as visualized in UMAP (upper) and vln (lower) plots. (C) Gene expression heatmap of DEGs in a pseudotime-temporal order. Myofibroblast (MyoF) and cardiomyogenic (cardio) transition trajectories (including pre-branch) are shown on the left and right, respectively. (D) GO analysis of upregulated and downregulated genes comparing the successful (cardio) with failed (myofibroblast) branches. (E) Volcano plot displaying DEGs comparing stages 2 and 3. Red dots represent genes that are differentially expressed by >2 fold. (H) Transcriptional gene correlation network in ADC-cardiac transition from stages 2 to 3.

Similar articles

References

    1. van Berlo JH, Molkentin JD.. An emerging consensus on cardiac regeneration. Nat Med. 2014;20(12):1386-1393. 10.1038/nm.3764 - DOI - PMC - PubMed
    1. Crea F, Libby P.. Acute coronary syndromes: the way forward from mechanisms to precision treatment. Circulation. 2017;136(12):1155-1166. 10.1161/CIRCULATIONAHA.117.029870 - DOI - PMC - PubMed
    1. Cahill TJ, Choudhury RP, Riley PR.. Heart regeneration and repair after myocardial infarction: translational opportunities for novel therapeutics. Nat Rev Drug Discov. 2017;16(10):699-717. 10.1038/nrd.2017.106 - DOI - PubMed
    1. Bassat E, Mutlak YE, Genzelinakh A, et al. . The extracellular matrix protein agrin promotes heart regeneration in mice. Nature. 2017;547(7662):179-184. - PMC - PubMed
    1. Laflamme MA, Murry CE.. Heart regeneration. Nature. 2011;473(7347):326-335. - PMC - PubMed

Publication types

MeSH terms

Substances