

Accurate simulation of cuff electrode stimulation predicting in-vivo strength-duration thresholds
- PMID: 35896504
- PMCID: PMC9529855
- DOI: 10.1111/aor.14374
Accurate simulation of cuff electrode stimulation predicting in-vivo strength-duration thresholds
Abstract
Background: In-silico experiments used to optimize and inform how peripheral nerve based electrode designs perform hold the promise of greatly reducing the guesswork with new designs as well as the number of animals used to identify and prove promising designs. Given adequate realism, in-silico experiments offer the promise of identifying putative mechanisms that further inform exploration of novel stimulation and recording techniques and their interactions with bioelectric phenomena. However, despite using validated nerve fiber models, when applied to the more complex case of an implanted extracellular electrode, the in-silico experiments often do not compare quantitatively with the results of experiments conducted in in-vivo experiments. This suggests that the accuracy/realism of the environment and the lamination of the nerve bundle plays an important role in this discrepancy. This paper describes the sensitivity of in-silico models to the electrical parameter estimates and volume conductor type used.
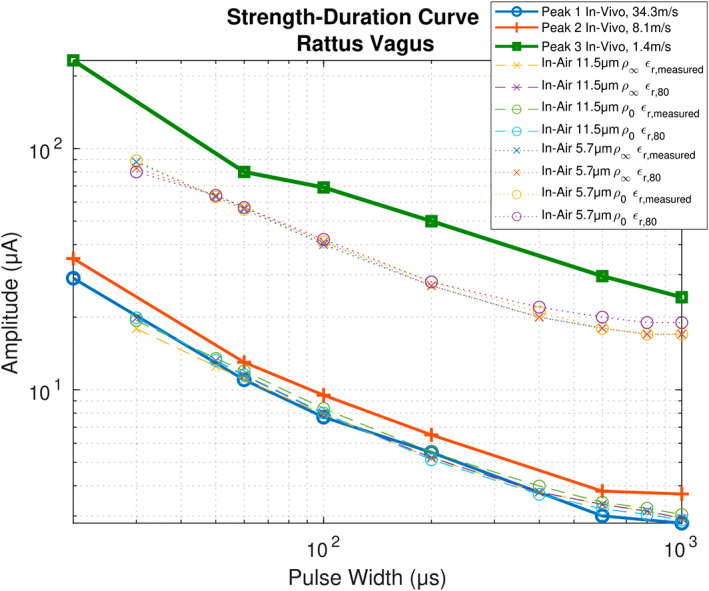
Methods: In-vivo work was performed on rat vagus nerves (N = 2) to characterize the strength-duration curve for various peaks identified in a compound nerve action potential (CAP) measured via a needle electrode. The vagus nerve has several distinct populations of nerve fiber calibers and types. Recruitment of a fiber caliber/type generates distinct peaks that can be identified, and whose conduction delay correlates to a conduction velocity. Peaks were identified by their recruitment thresholds and associated to their conduction velocities by the conduction delays of their peaks. An in-silico analog of the in-vivo experiment was constructed and experiments were run at the two extreme volume conductor cases: (1) The nerve in-saline, and (2) the nerve in-air. The specifically targeted electrical parameters were extraneural environment (in-air versus saline submersion), the resistivity (ρ) of the epineurium and perineurium, and the relative permittivity (εr ) of those same tissues. A time varying finite element method (FEM) model of the potential distribution vs time was quantified and projected onto a modified McIntyre, Richardson, and Grill (MRG), myelinated spinal nerve, active fiber model in NEURON to identify the threshold of activation as a function of stimulus pulse amplitude versus pulse width versus fiber diameter. The in-silico results were then compared to the in-vivo results.
Results: The finite element method simulations spanned two macro environments: in-saline and in-air. For these environments, the resistivities for low and high frequencies as well as two different permittivity cases were used. Between these 8 cases unique cases it was found that the most accurate combination of those variables was the in-air environment for low-frequency resistivity (ρ0 ) and ex-vivo a measured permittivity (εr,measured ) from unpublished ex-vivo experiments in canine vagal nerve, achieving a high degree of convergence (r2 = 0.96). As the in-vivo work was conducted in in-air, the in-air boundary condition test case was convergent with the in-silico results.
Conclusions: The results of this investigation suggest that increasing realism in simulations begets more accurate predictions. Of particular importance are (ρ) and extraneural environment, with reactive electrical parameters becoming important for input waveforms with energy in higher frequencies.
Keywords: NEURON; finite element analysis; neural simulations; threshold prediction.
© 2022 The Authors. Artificial Organs published by International Center for Artificial Organ and Transplantation (ICAOT) and Wiley Periodicals LLC.
Conflict of interest statement
The authors have no conflict of interest.
Figures


References
-
- Irnich W. The terms “chronaxie” and “rheobase” are 100 years old. Pacing Clin Electrophysiol. 2010. Apr;33(4):491–6. - PubMed
-
- Watanabe T, Futami R, Hoshimiya N, Handa Y. An approach to a muscle model with a stimulus frequency‐force relationship for FES applications. IEEE Trans Rehab Eng. 1999. Mar;7(1):12–8. - PubMed
-
- Parker JL, Shariati NH, Karantonis DM. Electrically evoked compound action potential recording in peripheral nerves. Bioelectron Med. 2018. Jan;1(1):71–83.
-
- Boretius T, Badia J, Pascual‐Font A, Schuettler M, Navarro X, Yoshida K, et al. A transverse intrafascicular multichannel electrode (TIME) to interface with the peripheral nerve. Biosens Bioelectron. 2010. Sep 15;26(1):62–9. - PubMed
-
- Malagodi MS, Horch KW, Schoenberg AA. An intrafascicular electrode for recording of action potentials in peripheral nerves. Ann Biomed Eng. 1989. Jul;17(4):397–410. - PubMed
MeSH terms
Grants and funding
LinkOut - more resources
Full Text Sources
Research Materials
Miscellaneous
