. 2022 Jul 27;13(1):4350.
doi: 10.1038/s41467-022-31929-6.

Differential neutralization and inhibition of SARS-CoV-2 variants by antibodies elicited by COVID-19 mRNA vaccines

Collaborators, Affiliations

Differential neutralization and inhibition of SARS-CoV-2 variants by antibodies elicited by COVID-19 mRNA vaccines

Li Wang et al. Nat Commun. .

Abstract

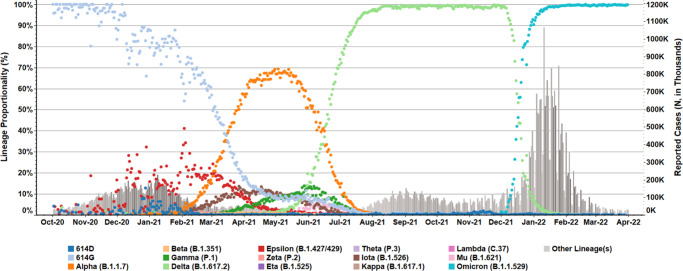
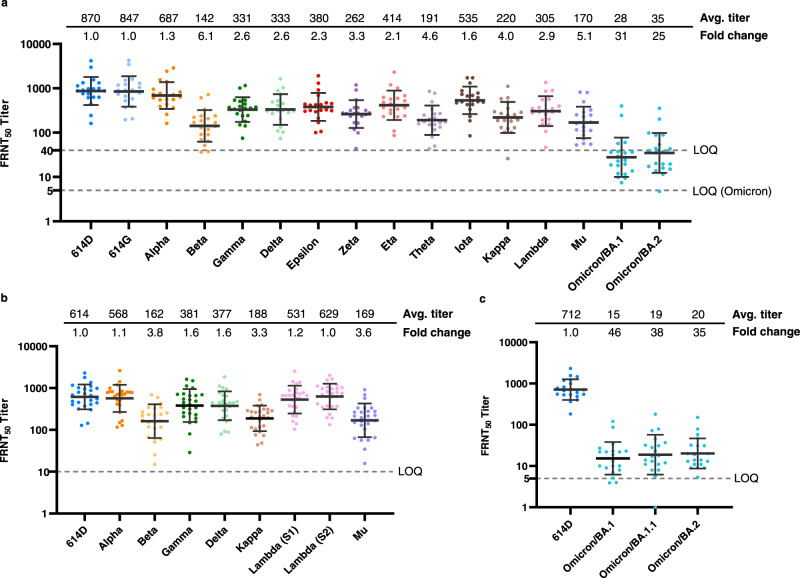
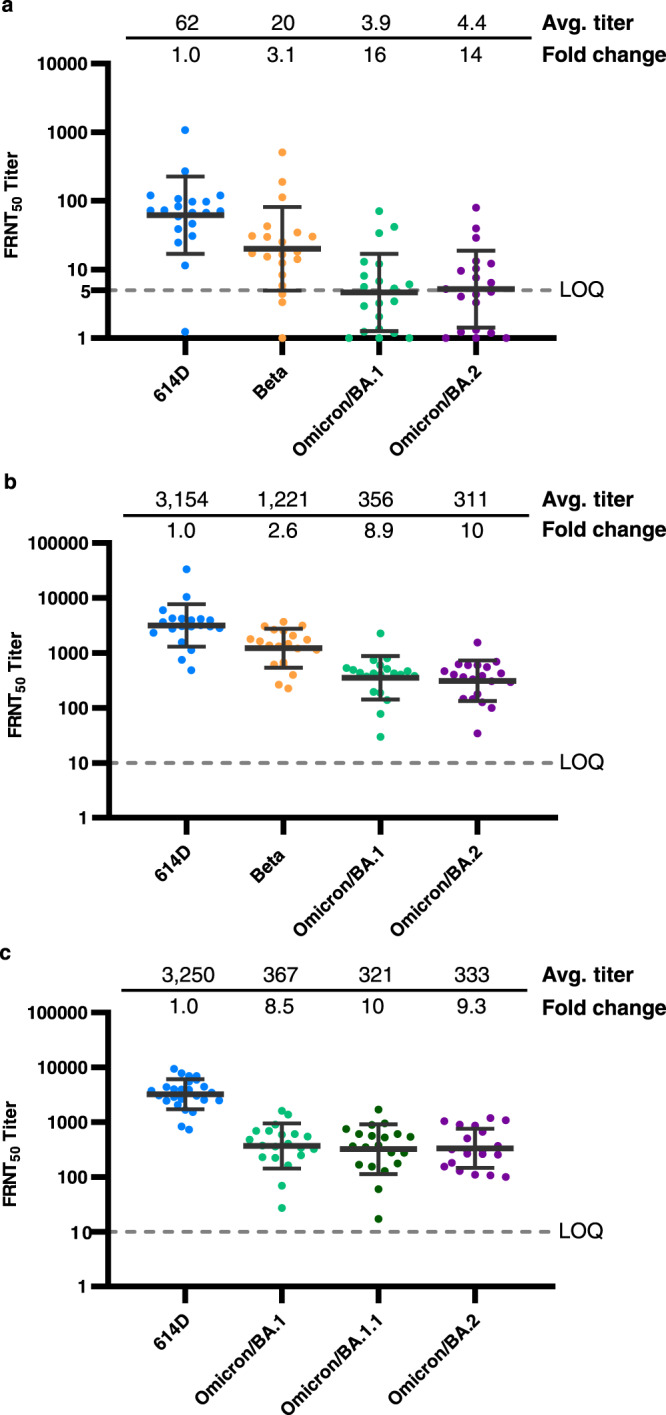
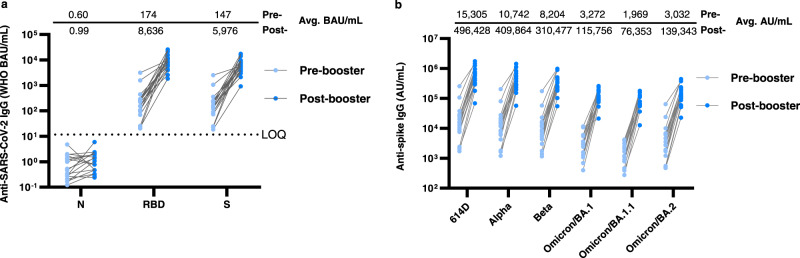
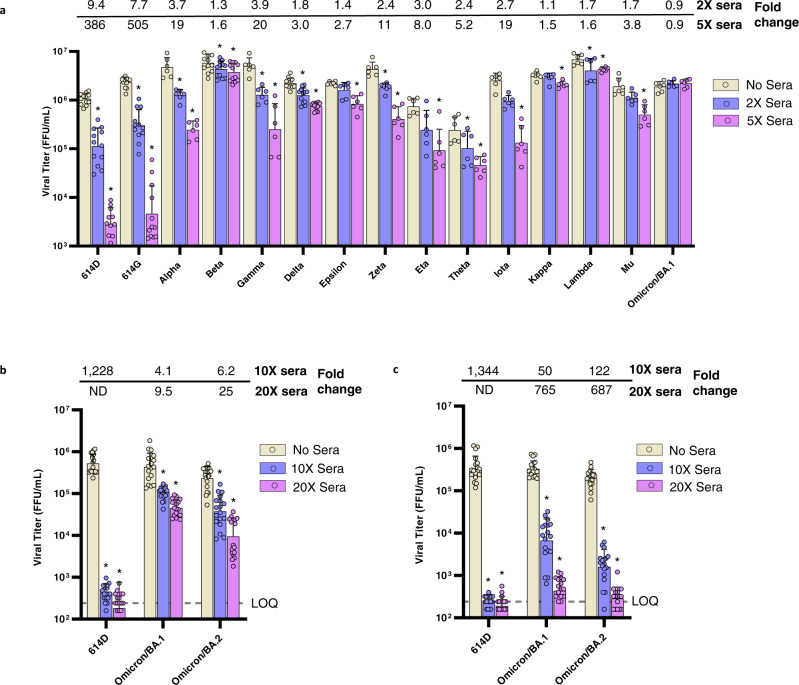
The evolution of severe acute respiratory syndrome coronavirus 2 (SARS-CoV-2) has resulted in the emergence of new variant lineages that have exacerbated the COVID-19 pandemic. Some of those variants were designated as variants of concern/interest (VOC/VOI) by national or international authorities based on many factors including their potential impact on vaccine-mediated protection from disease. To ascertain and rank the risk of VOCs and VOIs, we analyze the ability of 14 variants (614G, Alpha, Beta, Gamma, Delta, Epsilon, Zeta, Eta, Theta, Iota, Kappa, Lambda, Mu, and Omicron) to escape from mRNA vaccine-induced antibodies. The variants show differential reductions in neutralization and replication by post-vaccination sera. Although the Omicron variant (BA.1, BA.1.1, and BA.2) shows the most escape from neutralization, sera collected after a third dose of vaccine (booster sera) retain moderate neutralizing activity against that variant. Therefore, vaccination remains an effective strategy during the COVID-19 pandemic.


Conflict of interest statement

X.X. and P.-Y.S. have filed a patent on the reverse genetic system. X.X., and P.-Y.S. received compensation from Pfizer for COVID-19 vaccine development. Other authors declare no competing interests.

Figures

Fig. 1
Fig. 1. Prevalence of SARS-CoV-2 variants in the United States.
SARS-CoV-2 variant prevalence is highlighted for US clinical specimens processed within the National SARS-CoV-2 Strain Surveillance network, the CDC-contracted diagnostic and research laboratories, and the US baseline surveillance program. Daily incidence (dot icons, 0 to 100%) from October 2020 to March 2022 were indicated for key WHO labeled variants (Pangolin lineage in parentheses), and specimens encoding critical sequence markers (614D/G) but do not belong to those variants. Daily, reported clinical cases are summarized in the bar graph (right-side, dual Y-axis).
Fig. 2
Fig. 2. Neutralizing activity of mRNA vaccinee sera (post-second dose) against live SARS-CoV-2 viruses.
Each dot represents the neutralizing titer (FRNT50) of an individual serum sample against a specific SARS-CoV-2 virus, which is labeled on the X-axis. Different colors represent the progenitor virus or different variants (specific mutations provided in Supplementary Table 1). Vaccinee serum samples were obtained from people who were vaccinated 2–6 weeks post second dose. The geometric mean FRNT50 titers are represented in the graph as bars on top of the dots with geometric standard deviation. The geometric mean FRNT50 titers (avg. titer) and average fold changes relative to reference virus 614D (set as 1-fold) are shown on the top of the graph. For each variant, the average fold change is the geometric mean of the individual FRNT50 ratios (614D/variant) calculated for each serum sample. Dashed line represents the limit of quantitation (LOQ). For statistical analysis, a two-tailed Wilcoxon matched-pairs signed-rank test was performed by comparing each variant with 614D. Test statistics and P value are summarized in Supplementary Table 2. Source data are provided as a Source Data file. a Representative reporter viruses of all past and current WHO designated SARS-CoV-2 VOCs and VOIs were tested. N = 20 biologically independent sera examined over 16 viruses. LOQ = 5 for Omicron and LOQ = 40 for all other viruses. The average fold changes of all viruses differ significantly (P < 0.0001) from 614D, except for 614G (P = 0.8124). b VOCs and selected VOIs isolated from clinical specimens were tested. N = 26 biologically independent sera examined over 9 viruses. The average fold changes of all viruses differ significantly (P < 0.0001) from 614D, except for Alpha (P = 0.4833) and the two Lambda viruses (Lambda S1 and S2, P = 0.0796 and 0.7265, respectively). c Omicron subvariant BA.1, BA.1.1, and BA.2 isolated from clinical specimens were tested. N = 20 biologically independent sera examined over four viruses. The average fold changes of all viruses differ significantly (P < 0.0001) from 614D.
Fig. 3
Fig. 3. Neutralizing activity of mRNA vaccinee sera (pre- and post-booster) against live SARS-CoV-2 viruses.
Each dot represents the neutralizing titer (FRNT50) of an individual serum sample against a specific SARS-CoV-2 virus, which is labeled on the X-axis. Different colors represent the progenitor virus or different variants and subvariants. The geometric mean FRNT50 titers are represented in the graph as bars on top of the dots with geometric standard deviation. The geometric mean FRNT50 titers (avg. titer) and average fold changes relative to reference virus 614D (set as 1-fold) are shown on the top of the graph. Dashed line represents the limit of quantitation (LOQ). For statistical analysis, a two-tailed Wilcoxon matched-pairs signed-rank test was performed by comparing each variant with 614D. Test statistics and P value are summarized in Supplementary Table 2. Source data are provided as a Source Data file. a 614D, Beta, and Omicron subvariants BA.1 and BA.2 reporter viruses were tested. N = 20 biologically independent pre-booster sera (6–7 months post-second dose). The average fold changes of all variants differ significantly (P < 0.0001) from 614D. LOQ = 5. b 614D, Beta and Omicron subvariants BA.1 and BA.2 reporter viruses were tested. N = 20 biologically independent post-booster sera (2–6 weeks post-third dose). The average fold changes of all viruses differ significantly (P < 0.0001) from 614D. LOQ = 10. c 614D and Omicron subvariants BA.1, BA.1.1, and BA.2 isolated from clinical specimens were tested. N = 20–25 biologically independent post-booster sera examined over four viruses. The average fold changes of all viruses differ significantly (P < 0.0001) from 614D. LOQ = 10.
Fig. 4
Fig. 4. Evaluation of anti-SARS-CoV-2 IgG binding activity in mRNA vaccinee sera (pre- and post-booster).
Each dot represents calculated IgG concentration (BAU/mL or AU/mL) of an individual serum sample against a specific protein antigen. The geometric mean IgG concentrations (avg. BAU/mL or AU/mL) from pre- and post-booster sera are shown on the top of the graph. For statistical analysis, a two-tailed Wilcoxon matched-pairs signed-rank test was performed by comparing antibody concentration of pre- and post-booster sera. Test statistics and P value are summarized in Supplementary Table 2. Source data are provided as a Source Data file. a IgG antibodies specific to SARS-CoV-2 nucleocapsid (N), receptor binding domain (RBD) and spike(S) were measured. N = 18–20 biologically independent pre-booster sera (light blue) and N = 18–20 biologically independent post-booster sera (dark blue). The average IgG concentrations in all post-booster sera differ significantly (P < 0.0001) from the pre-booster sera, except those specific to the nucleocapsid (P = 0.1084). Dashed line represents the limit of quantification for the N protein. LOQ = 11.8. b IgG antibodies specific to SARS-CoV-2 spike proteins of 6 different viruses were measured. N = 17–20 biologically independent pre-booster sera (light blue) and N = 17–20 biologically independent post-booster sera (dark blue). The average IgG concentrations in all post-booster sera differ significantly (P < 0.0001) from the pre-booster sera. BAU: binding antibody units calibrated to WHO international standard. AU arbitrary units.
Fig. 5
Fig. 5. Inhibition of mRNA vaccinee sera against live SARS-CoV-2 viruses.
Calu-3 cells were infected with 200–400 focus forming units (FFU) of each virus and incubated for 2 days in media with or without sera. The viruses were collected from Calu-3 supernatant at 2 days post inoculation and titrated by FFU assay. The geometric mean viral titers of variants under different treatment conditions are represented in the graph as bars with geometric standard deviation. Bar graphs present the titers of each variant under different treatment conditions. Error bars representing titer differences are marked as *, representing p < 0.05, compared to the no sera control within each virus group. Two-tailed Wilcoxon matched-pairs signed-rank test was used for statistical significance analysis and the statistics and P value are summarized in Supplementary Table 2. Source data are provided as a Source Data file. Titer fold changes (reductions) compared to the no sera control are shown on the top of the panel. a The sera for incubation were pooled from the individual sera used in Fig. 2a and diluted to 2X or 5X concentration (diluted sera titer FRNT50 = 2 or 5 against 614D reference virus). N = 6 or 12 viral titers over 2 biologically independent sera pools in 1–2 independent experiments. b The sera for incubation were pooled from the individual sera used in Fig. 2a (post-second dose) and diluted to 10X or 20X concentration (diluted sera titer FRNT50 = 10 or 20 against 614D reference virus). N = 18 viral titers over 2 biologically independent sera pools in 1–2 independent experiments. The fold change for the 614D-20X sera group is not determined (ND) as the average viral titer of that group is below the LOQ. c The sera for incubation were pooled from the individual sera used in Fig. 3b (post-third dose) and diluted to 10X or 20X concentration (diluted sera titer FRNT50 = 10 or 20 against 614D reference virus). N = 18 viral titers over 2 biologically independent sera pools in 1–2 independent experiments. The fold change for the 614D-20X sera group is not determined (ND) as the average viral titer of that group is below the LOQ. Yellow bars, viral titers in the absence of sera; blue bars, viral titers in 2X or 10X sera; purple bars, viral titers in 5X or 20X sera. Limit of quantification LOQ = 240 FFU/mL.

Similar articles

Cited by

References

    1. Zhu N, et al. A novel coronavirus from patients with pneumonia in China, 2019. N. Engl. J. Med. 2020;382:727–733. - PMC - PubMed
    1. Korber B, et al. Tracking changes in SARS-CoV-2 spike: evidence that D614G increases infectivity of the COVID-19 virus. Cell. 2020;182:812–827.e819. doi: 10.1016/j.cell.2020.06.043. - DOI - PMC - PubMed
    1. Hou YJ, et al. SARS-CoV-2 D614G variant exhibits efficient replication ex vivo and transmission in vivo. Science. 2020;370:1464–1468. doi: 10.1126/science.abe8499. - DOI - PMC - PubMed
    1. Plante JA, et al. Spike mutation D614G alters SARS-CoV-2 fitness. Nature. 2021;592:116–121. doi: 10.1038/s41586-020-2895-3. - DOI - PMC - PubMed
    1. Zhou B, et al. SARS-CoV-2 spike D614G change enhances replication and transmission. Nature. 2021;592:122–127. doi: 10.1038/s41586-021-03361-1. - DOI - PubMed

Publication types

Supplementary concepts