. 2022 Jul 27;13(1):4287.
doi: 10.1038/s41467-022-30773-y.

Genome-wide association study identifies Sjögren's risk loci with functional implications in immune and glandular cells

Bhuwan Khatri  1 Kandice L Tessneer  1 Astrid Rasmussen  1 Farhang Aghakhanian  1 Tove Ragna Reksten  2   3 Adam Adler  4 Ilias Alevizos  5 Juan-Manuel Anaya  6 Lara A Aqrawi  7   8 Eva Baecklund  9 Johan G Brun  3 Sara Magnusson Bucher  10 Maija-Leena Eloranta  9 Fiona Engelke  11 Helena Forsblad-d'Elia  12 Stuart B Glenn  1 Daniel Hammenfors  13 Juliana Imgenberg-Kreuz  9 Janicke Liaaen Jensen  7 Svein Joar Auglænd Johnsen  14 Malin V Jonsson  3   15 Marika Kvarnström  16   17 Jennifer A Kelly  1 He Li  2   18 Thomas Mandl  19 Javier Martín  20 Gaétane Nocturne  21 Katrine Brække Norheim  3   22 Øyvind Palm  23 Kathrine Skarstein  3   24 Anna M Stolarczyk  1 Kimberly E Taylor  25 Maria Teruel  26 Elke Theander  27   28 Swamy Venuturupalli  29   30 Daniel J Wallace  29   30 Kiely M Grundahl  1 Kimberly S Hefner  31 Lida Radfar  32 David M Lewis  33 Donald U Stone  34 C Erick Kaufman  35 Michael T Brennan  36   37 Joel M Guthridge  2   38 Judith A James  2   35 R Hal Scofield  2   35   39 Patrick M Gaffney  1 Lindsey A Criswell  25   40   41 Roland Jonsson  3   13 Per Eriksson  42 Simon J Bowman  43   44   45 Roald Omdal  3   14 Lars Rönnblom  9 Blake Warner  5 Maureen Rischmueller  46   47 Torsten Witte  11 A Darise Farris  2 Xavier Mariette  21 Marta E Alarcon-Riquelme  26 PRECISESADS Clinical ConsortiumCaroline H Shiboski  48 Sjögren’s International Collaborative Clinical Alliance (SICCA)Marie Wahren-Herlenius  3   16 Wan-Fai Ng  49   50 UK Primary Sjögren’s Syndrome RegistryKathy L Sivils  2   18 Indra Adrianto  51 Gunnel Nordmark  9 Christopher J Lessard  52   53
Affiliations

Genome-wide association study identifies Sjögren's risk loci with functional implications in immune and glandular cells

Bhuwan Khatri et al. Nat Commun. .

Erratum in

  • Author Correction: Genome-wide association study identifies Sjögren's risk loci with functional implications in immune and glandular cells.
    Khatri B, Tessneer KL, Rasmussen A, Aghakhanian F, Reksten TR, Adler A, Alevizos I, Anaya JM, Aqrawi LA, Baecklund E, Brun JG, Bucher SM, Eloranta ML, Engelke F, Forsblad-d'Elia H, Glenn SB, Hammenfors D, Imgenberg-Kreuz J, Jensen JL, Johnsen SJA, Jonsson MV, Kvarnström M, Kelly JA, Li H, Mandl T, Martín J, Nocturne G, Norheim KB, Palm Ø, Skarstein K, Stolarczyk AM, Taylor KE, Teruel M, Theander E, Venuturupalli S, Wallace DJ, Grundahl KM, Hefner KS, Radfar L, Lewis DM, Stone DU, Kaufman CE, Brennan MT, Guthridge JM, James JA, Scofield RH, Gaffney PM, Criswell LA, Jonsson R, Eriksson P, Bowman SJ, Omdal R, Rönnblom L, Warner B, Rischmueller M, Witte T, Farris AD, Mariette X, Alarcon-Riquelme ME; PRECISESADS Clinical Consortium; Shiboski CH; Sjögren’s International Collaborative Clinical Alliance (SICCA); Wahren-Herlenius M, Ng WF; UK Primary Sjögren’s Syndrome Registry; Sivils KL, Adrianto I, Nordmark G, Lessard CJ. Khatri B, et al. Nat Commun. 2022 Oct 31;13(1):6519. doi: 10.1038/s41467-022-34311-8. Nat Commun. 2022. PMID: 36316359 Free PMC article. No abstract available.
  • Author Correction: Genome-wide association study identifies Sjögren's risk loci with functional implications in immune and glandular cells.
    Khatri B, Tessneer KL, Rasmussen A, Aghakhanian F, Reksten TR, Adler A, Alevizos I, Anaya JM, Aqrawi LA, Baecklund E, Brun JG, Bucher SM, Eloranta ML, Engelke F, Forsblad-d'Elia H, Glenn SB, Hammenfors D, Imgenberg-Kreuz J, Jensen JL, Johnsen SJA, Jonsson MV, Kvarnström M, Kelly JA, Li H, Mandl T, Martín J, Nocturne G, Norheim KB, Palm Ø, Skarstein K, Stolarczyk AM, Taylor KE, Teruel M, Theander E, Venuturupalli S, Wallace DJ, Grundahl KM, Hefner KS, Radfar L, Lewis DM, Stone DU, Kaufman CE, Brennan MT, Guthridge JM, James JA, Scofield RH, Gaffney PM, Criswell LA, Jonsson R, Eriksson P, Bowman SJ, Omdal R, Rönnblom L, Warner B, Rischmueller M, Witte T, Farris AD, Mariette X, Alarcon-Riquelme ME; PRECISESADS Clinical Consortium; Shiboski CH; Sjögren’s International Collaborative Clinical Alliance (SICCA); Wahren-Herlenius M, Ng WF; UK Primary Sjögren’s Syndrome Registry; Sivils KL, Adrianto I, Nordmark G, Lessard CJ. Khatri B, et al. Nat Commun. 2023 Feb 3;14(1):598. doi: 10.1038/s41467-023-36369-4. Nat Commun. 2023. PMID: 36737443 Free PMC article. No abstract available.

Abstract

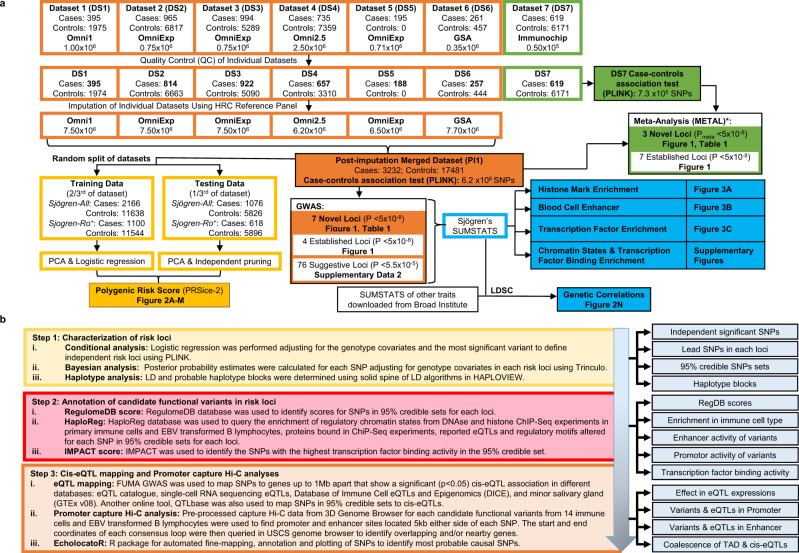
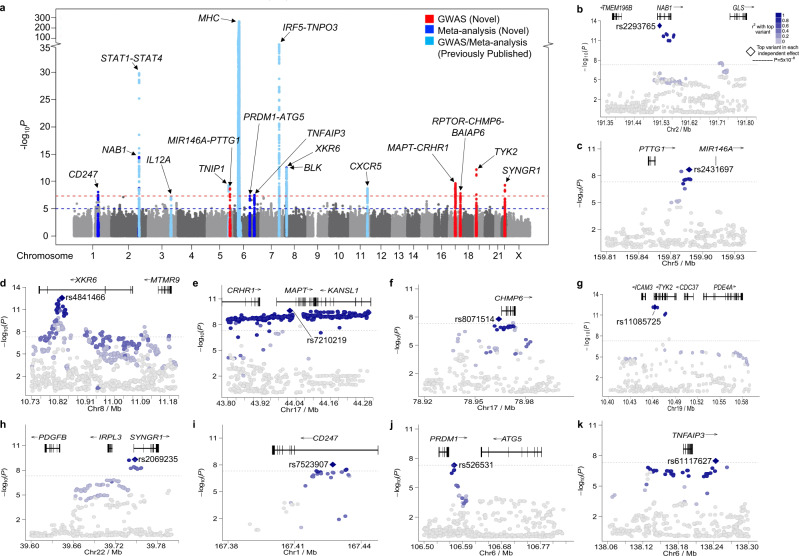
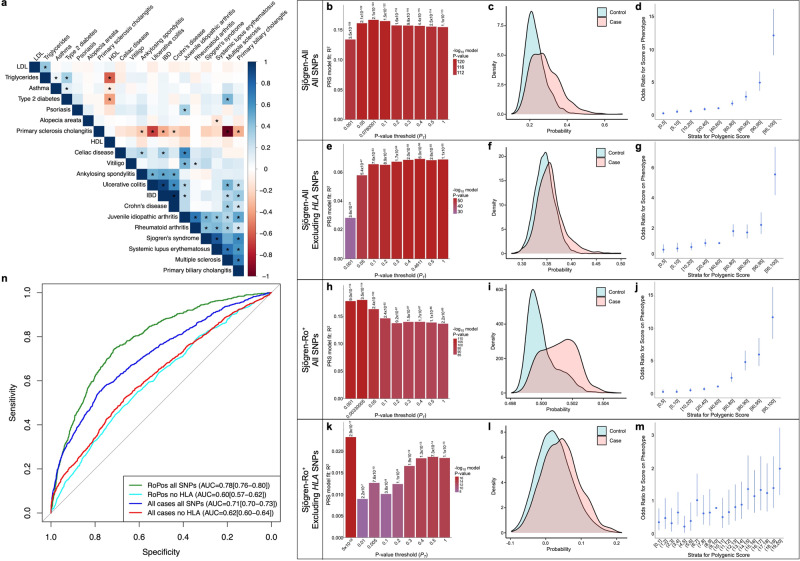
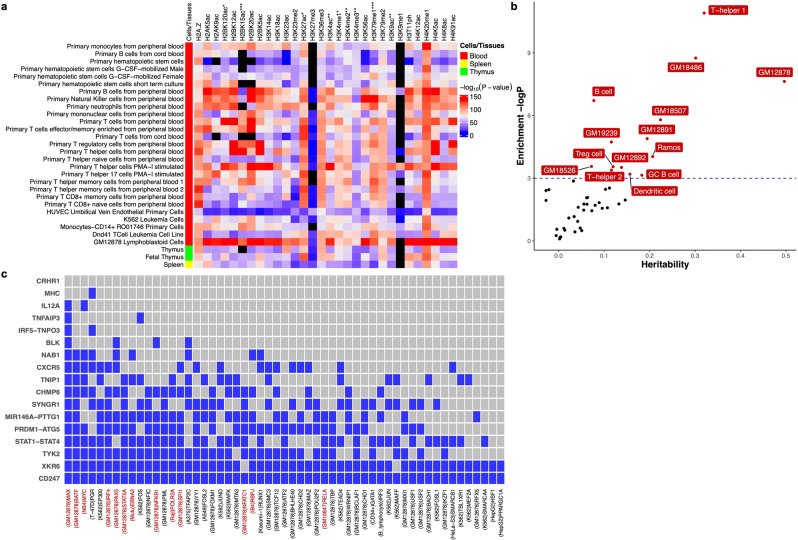
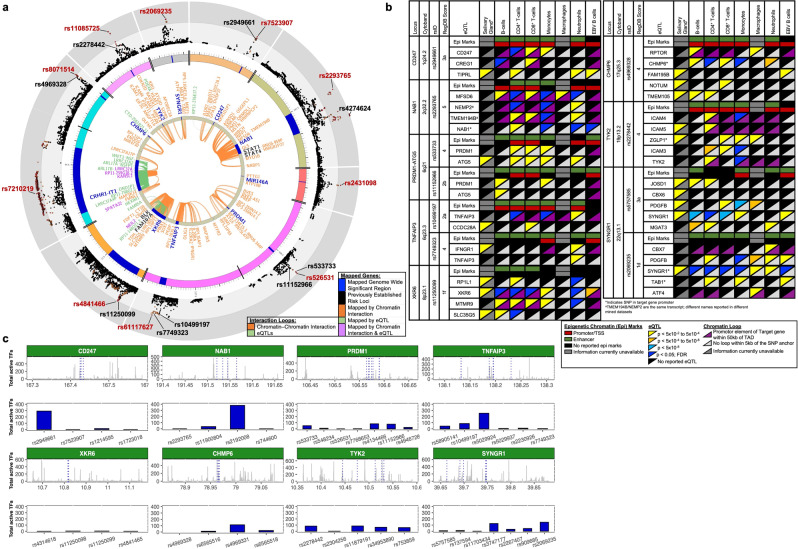
Sjögren's disease is a complex autoimmune disease with twelve established susceptibility loci. This genome-wide association study (GWAS) identifies ten novel genome-wide significant (GWS) regions in Sjögren's cases of European ancestry: CD247, NAB1, PTTG1-MIR146A, PRDM1-ATG5, TNFAIP3, XKR6, MAPT-CRHR1, RPTOR-CHMP6-BAIAP6, TYK2, SYNGR1. Polygenic risk scores yield predictability (AUROC = 0.71) and relative risk of 12.08. Interrogation of bioinformatics databases refine the associations, define local regulatory networks of GWS SNPs from the 95% credible set, and expand the implicated gene list to >40. Many GWS SNPs are eQTLs for genes within topologically associated domains in immune cells and/or eQTLs in the main target tissue, salivary glands.


Conflict of interest statement

I.A. is currently employed by Horizon. E.B. has an active research collaboration with Pfizer. T.M. is employed as medical lead in rheumatology at Novartis. R.H.S. is a consultant for Jansen Pharmaceuticals. S.J.B. provided consultancy services for Abbvie, Galapagos, and Novartis in 2020–2021. B.M.W. has active collaborative research agreements with Astellas Bio and Pfizer, Inc. M.R. received grants from Bristol Myers-Squibb, Novartis, and Servier for clinical trials in Sjögren’s Syndrome. H.L. and K.L. Sivils are current employees of Janssen. A.D.F. and C.J.L. have an active collaborative research agreement with Janssen. All other authors have reported that they have no competing interests to report.

Figures

Fig. 1
Fig. 1. Schematic of the Sjögren’s GWAS and Bioinformatic Workflow.
a Workflow of the six genotyped datasets (DS1–6) and one ImmunoChip dataset (DS7) used in this study, including the number of cases, controls, and SNPs included in each dataset pre- and post-quality control, and after whole-genome imputation. The post-imputation merged dataset (PI1) containing DS1–6 was used to perform the SNP-Sjögren’s single marker trait analysis (orange), the polygenic risk score (PRS) analysis (yellow), the genetic correlation analyses (blue), and the epigenetic enrichment analyses (blue). Meta-analysis was performed using the genotyped PI1 merged dataset and DS7 ImmunoChip dataset (green) merged using the DS7 genotyping platform. See Supplementary Data 1 for detailed information for each dataset. b Statistical and bioinformatic analysis workflow applied to each novel risk locus to identify and predict functionality of likely functional SNPs.
Fig. 2
Fig. 2. Summary of the SNP-Sjögren associations in a European population.
a Manhattan plot shows the summary data from the meta-analysis of the 7.3 × 105 SNPs shared between the GWAS and ImmunoChip dataset (Supplementary Data 1) after imputation. The −log10(P) for each variant is plotted according to chromosome and base pair position. A total of seven novel loci (indicated in red) exceeded genome-wide significance (GWS) of PGWAS < 5 × 10−8 (red dashed line). Three additional novel loci (indicated in royal blue) exceed GWS after meta-analysis (PMETA < 5 × 10−8). Several previously established loci were replicated (indicated in light blue). The suggestive GWAS and meta-analysis threshold (PSuggestive < 5 × 10−5) is indicated by the blue dashed line. bh Logistical regression analysis was performed on GWAS dataset PI1 after imputation, identifying the top SNP associations (e.g., index SNPs) of the novel GWS regions of association: NAB1 (b), PTTG1-MIR146A (c), XKR6 (d), MAPT-CRHR1 (e), RPTOR-CHMP6-BAIAP6 (f), TYK2 (g), SYNGR1 (h). ik Logistical regression analysis was performed after meta-analysis of the GWAS and ImmunoChip data, identifying the top SNP associations (e.g., index SNPs) of the novel GWS regions of association: CD247 (i), PRDM1-ATG5 (j), TNFAIP3 (k).
Fig. 3
Fig. 3. Polygenic risk score analysis of the Sjögren-SNPs in all genotype Sjögren’s cases and Ro+ Sjögren’s cases with or without the HLA region.
a Heatmap of LDSC-estimated genetic correlations between Sjögren’s and 19 other immune-mediated diseases and other common traits using European GWAS summary data from the 1000 Genomes Project. Box color indicates magnitude of correlation; * indicates significant P-value after Bonferroni correction. bm Polygenic risk scores (PRS) were calculated for all genotyped individuals from the Sjögren-All (bg) or Sjögren-Ro+ (hm) subsets, divided 2/3 into training and 1/3 into testing datasets, using LD-pruned genotyped SNPs (r2 > 0.2) including (bd, hj) or excluding (eg, km) SNPs from the HLA region (6p21.3–22.3.). (b, e, h, k) Bar plot of multiple P-value thresholds (PT) for PRS prediction of Sjögren’s. c, f, i, l Histogram of the PRS distribution in Sjögren’s cases (orange) and controls (teal). d, g, j, m Strata plot of the odds ratio (OR) when comparing PRS from different quantile ranges. Bars indicate the 95% confidence intervals of the OR from each quantile range. n Area under the receiver operating characteristic curve (AUROC) values of PRS using LD-pruned genotyped Sjögren-SNPs including SNPs from 6p21.3–22.3 in all genotyped Sjögren’s cases (dark blue) or Ro+ Sjögren’s cases (green) relative to population controls, and LD-pruned genotyped Sjögren-SNPs excluding SNPs from 6p21.3–22.3 in all genotyped Sjögren’s cases (red) or Ro+ Sjögren’s cases (light blue) relative to population controls.
Fig. 4
Fig. 4. Epigenetic and transcription factor enrichment analysis of Sjögren’s risk loci in specific cell types and tissues.
a Enrichment analysis of 30 histone marks in 127 different cell types and tissues from the Roadmap Epigenome Consortium Project was performed using GREGOR software. Heatmap displays the enrichment P-value for each histone mark plotted relative to specific immune cell types from the blood (red), spleen (yellow), and thymus (green). Black boxes indicate missing data. Complete analysis of all 127 cell types and tissues from the Roadmap Epigenome Consortium Project are reported in Supplemental Fig. 8 and Supplemental Data 3. b Enrichment of heritability in cell type-specific enhancers reported in the EnhancerAtlas2.0 database. Enrichment was calculated as partitioned heritability divided by the proportion of GWS Sjögren-SNPs that intersect with enhancer regions in each cell type. Cell types exhibiting significant GWS Sjögren-SNPs in enhancers are indicated in red. Blue dashed line is the threshold of significance after correction for multiple testing of P ≲ 0.05. c Enrichment of cell type-specific transcription factor binding sites. Transcription factors are indicated by a blue box if at least one Bonferroni-corrected (P ≲ 0.05) intersection between an indicated transcription factor and Sjögren-associated risk locus was detected. Red font indicates transcription factors that are also associated with the EBNA2 super enhancer. The cell type with the most significant interaction is listed in parentheses for each transcription factor.
Fig. 5
Fig. 5. Chromatin Interactions and eQTLs of the ten novel Sjögren-associated genetic risk loci.
a Circos plot shows the zoom regional Manhattan plots for each genetic risk locus (outer most layer); SNPs with P-value <0.05 (black); r2 > 0.08 (red); r2 > 0.06 (orange). Index SNP rsIDs are indicated in red. Black rsIDs are prioritized SNPs from the 95% credible set that are also eQTLs that exhibit chromatin-chromatin interactions and are shown in (b). Outer circle displays the chromosome coordinate with the genomic risk loci highlighted in blue. Genes that are eQTLs (green) or exhibit chromatin interaction by Hi-C in Epstein–Barr virus (EBV)-transformed B lymphocytes (orange) are reported on the inner circles as text or interaction links. Each index gene is colored blue. Genes that are eQTLs and engage in chromatin interactions are reported in purple. b Cell type-specific functional annotations (horizontal rectangles), select eQTLs (top triangles), and chromatin-chromatin interactions (bottom triangle) are shown for the indicated prioritized SNPs from each 95% credible set. MIR146A was omitted because mined eQTL databases did not test MIR146A. Complex linkage disequilibrium of the CRHR1 association impaired refinement and fine-mapping of the region. c IMPACT annotation of the most likely functional Sjögren-SNPs to quantify SNP position in 700 cell-type-specific active transcription factor binding sites. Top panel depicts SNP position (blue lines) relative to genomic coordinates (Mb) of each indicated locus. Bottom panel shows the total number of active transcription factor binding sites detected at each indicated SNP.

References

    1. Nocturne G, Mariette X. Advances in understanding the pathogenesis of primary Sjögren’s syndrome. Nat. Rev. Rheumatol. 2013;9:544–556. doi: 10.1038/nrrheum.2013.110. - DOI - PubMed
    1. Mariette X, Criswell LA. Primary Sjögren’s syndrome. N. Engl. J. Med. 2018;378:931–939. doi: 10.1056/NEJMcp1702514. - DOI - PubMed
    1. Hjelmervik TOR, Petersen K, Jonassen I, Jonsson R, Bolstad AI. Gene expression profiling of minor salivary glands clearly distinguishes primary Sjögren’s syndrome patients from healthy control subjects. Arthritis Rheumatism. 2005;52:1534–1544. doi: 10.1002/art.21006. - DOI - PubMed
    1. Wakamatsu E, et al. DNA microarray analysis of labial salivary glands of patients with Sjögren’s syndrome [8] Ann. Rheum. Dis. 2007;66:844–845. doi: 10.1136/ard.2006.063370. - DOI - PMC - PubMed
    1. Hu S, et al. Salivary proteomic and genomic biomarkers for primary Sjögren’s syndrome. Arthritis Rheumatism. 2007;56:3588–3600. doi: 10.1002/art.22954. - DOI - PMC - PubMed

Publication types

MeSH terms